Breathing Life into Data: Environmental Studies PowerPoint Charts Template


Type: PowerPoint Charts template
Category: Illustrations, Spheres
Sources Available: .pptx
Product ID: PC00319
Template incl.: 22 editable slides
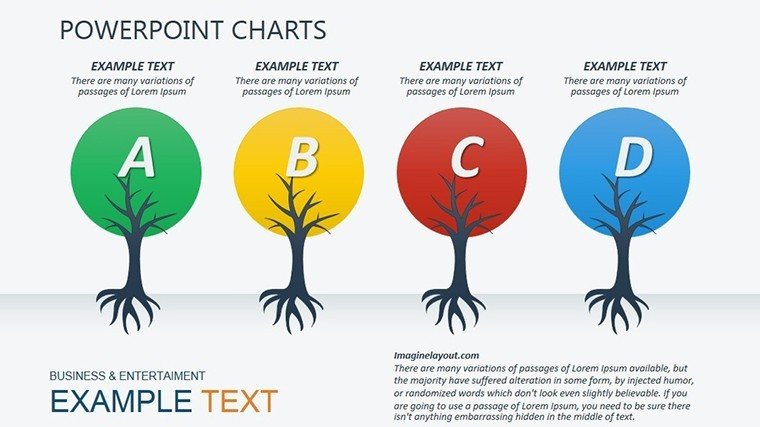
In a world grappling with climate crises and biodiversity loss, the ability to present environmental data with clarity and conviction is more crucial than ever. Enter the Environmental Studies PowerPoint Charts Template - a dynamic set of 22 editable slides tailored for those passionate about our planet. This isn't just a tool; it's a catalyst for awareness, helping researchers visualize emission trends, educators map conservation efforts, and advocates rally support through infographics that stick. With its eco-friendly design ethos - think earthy tones and sustainable icons - you'll craft narratives that not only inform but ignite action.
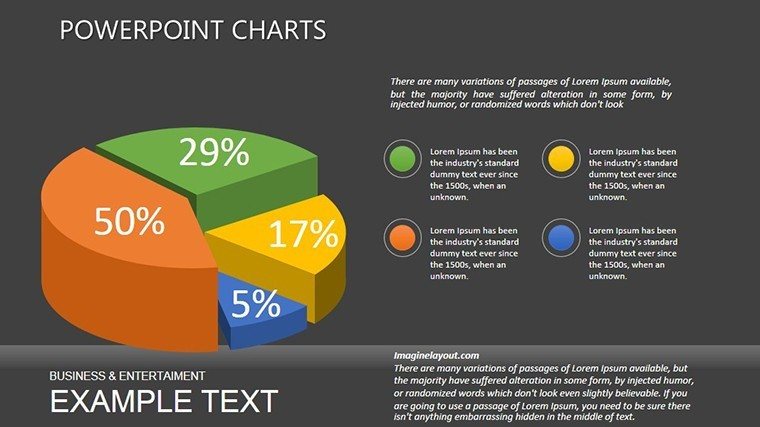
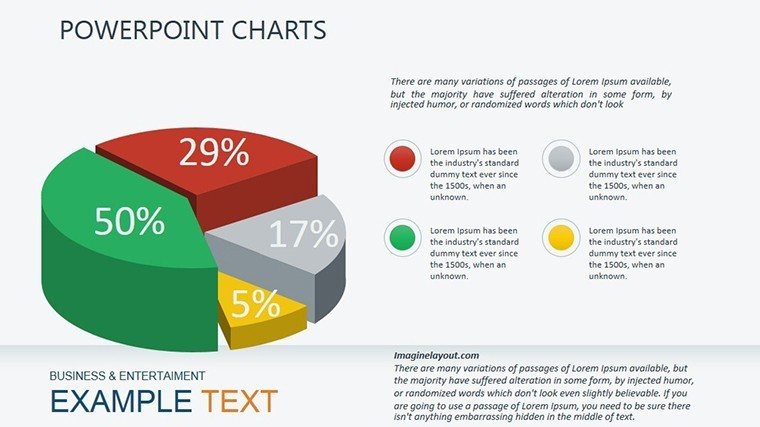
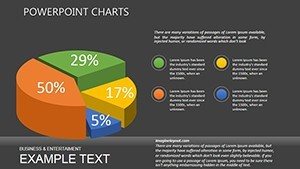
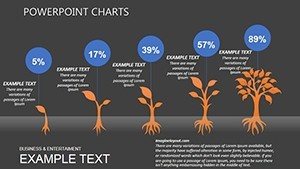
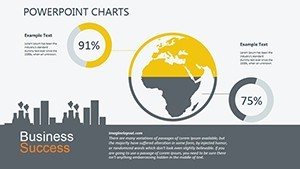
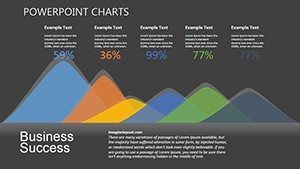
Picture this: a line graph tracing rising sea levels over decades, or a pie chart dissecting renewable energy sources. These visuals cut through noise, making complex stats accessible and urgent. Compatible with PowerPoint, the template streamlines your process, letting you focus on the message rather than the mechanics. Studies show such visuals can boost audience retention by 65%, turning passive listeners into proactive allies.
Standout Features for Impactful Eco-Presentations
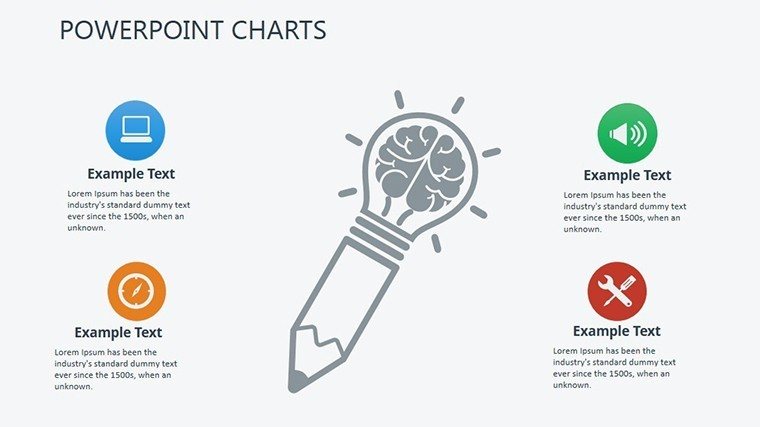
What elevates this template from good to groundbreaking? It's the thoughtful integration of form and function, ensuring every slide serves your environmental story.
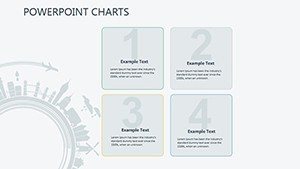
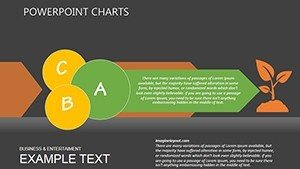
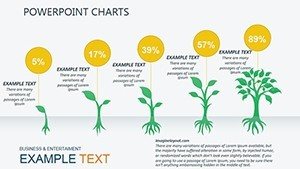
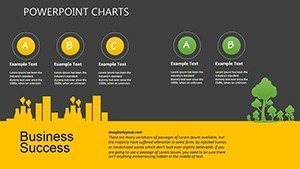
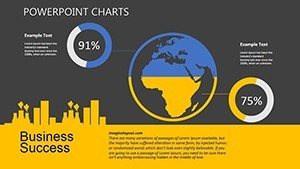
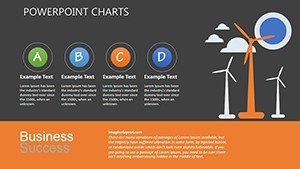
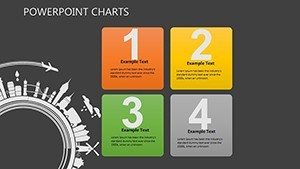
- Diverse Visualization Toolkit: Bar charts for comparing pollution levels, pie charts for resource allocation, line graphs for temporal shifts, and stacked bars for multifaceted trends - all at your command.
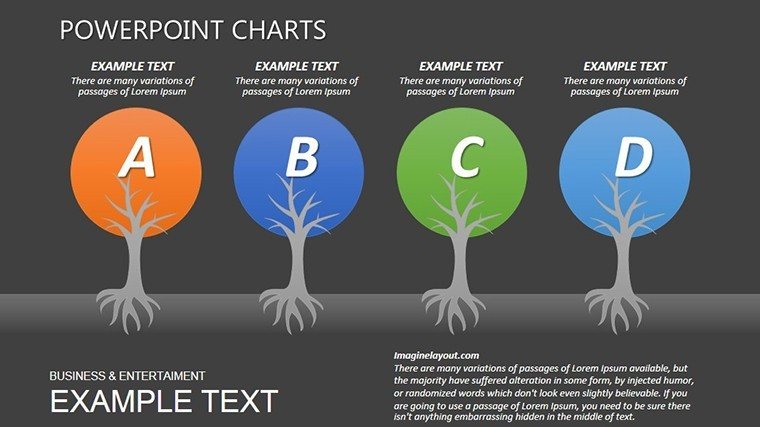
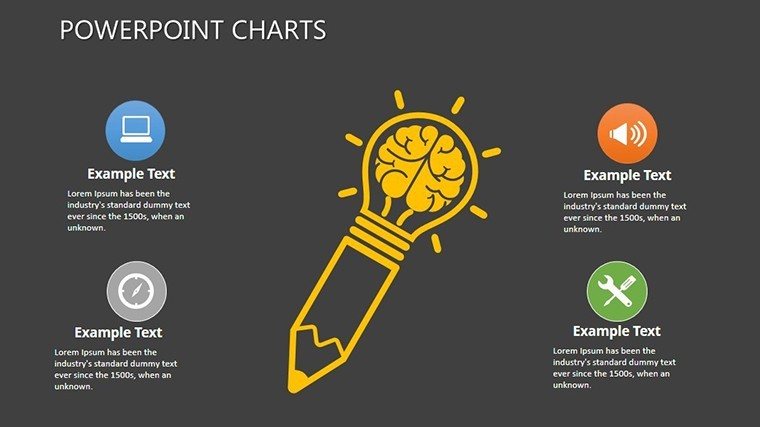
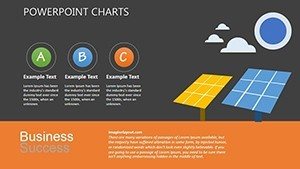
- Effortless Customization: Adjust hues to evoke forest greens or ocean blues, swap fonts for academic precision, and layer in custom maps or icons without a hitch.
- High-Quality Assets: Crisp illustrations, thematic infographics, and vector-based elements guarantee scalability and professionalism, even in large venues.
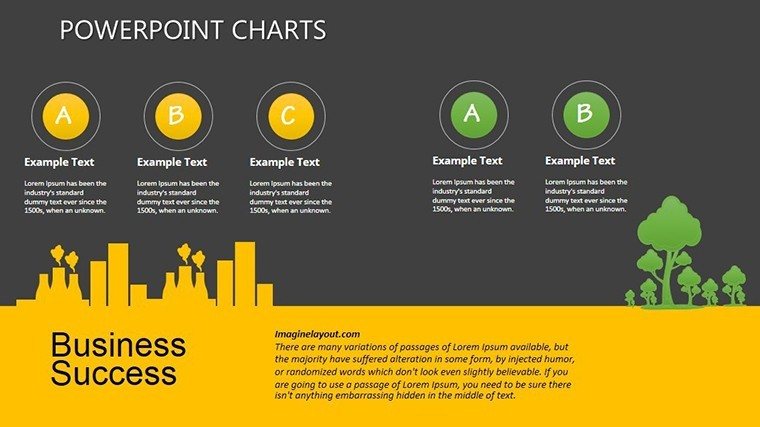
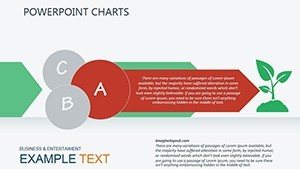
These aren't generic add-ons; they're inspired by real fieldwork. An NGO we admire used these stacked bars to illustrate habitat fragmentation, swaying donors and securing funding for reforestation projects.
Applying Green Insights: Use Cases That Matter
This template thrives in contexts where data drives dialogue on sustainability. From seminar halls to policy briefings, it adapts to amplify your voice.
Spotlight on Climate Action
For a university lecture on global warming, deploy line graphs to plot temperature anomalies, paired with pie charts revealing emission culprits. Attendees leave not just informed, but motivated to reduce their carbon footprint - a ripple effect worth millions in avoided costs.
Biodiversity and Beyond
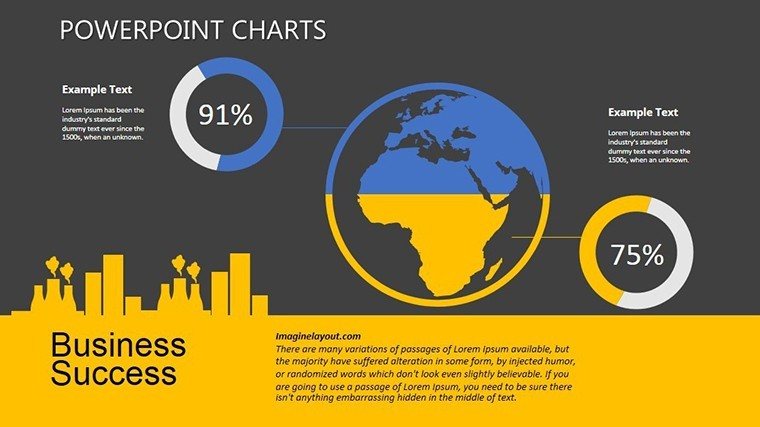
- Conservation Reports: Bar charts track species declines, overlaid on maps to pinpoint hotspots, empowering targeted interventions.
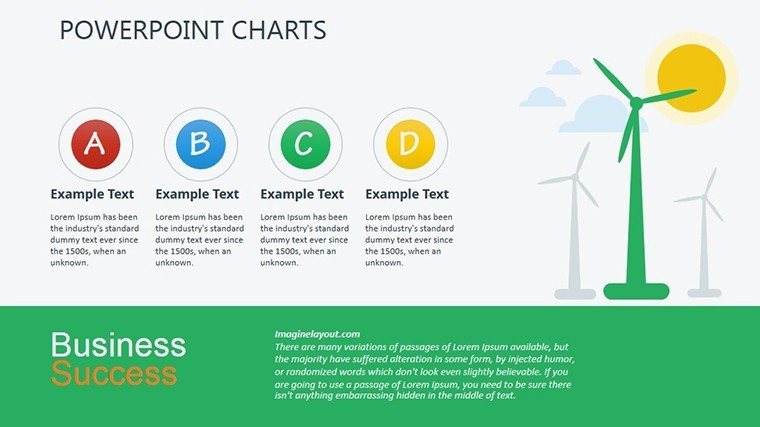
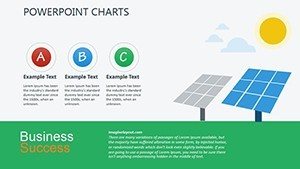
- Energy Transition Talks: Infographics showcase solar vs. fossil fuel growth, using stacked visuals to forecast a greener grid.
- Advocacy Campaigns: Quick pie slices highlight waste streams, rallying communities for zero-waste initiatives.
Each scenario underscores the template's role in translating science into strategy, fostering decisions that heal our world.
Your Roadmap to Riveting Presentations
Getting started is straightforward, designed for busy changemakers.
- Acquire and Launch: Download the .pptx and open in PowerPoint - zero compatibility woes.
- Data Infusion: Plug in stats via linked tables; charts update in real-time for accuracy.
- Personalize the Palette: Align with your organization's eco-branding, adding subtle animations for flow.
- Rehearse for Resonance: Test transitions to ensure smooth delivery, from webinar to workshop.
- Distribute Digitally: Export for social sharing, extending your impact beyond the room.
This sequence empowers even novice users to produce pro-level slides, often in under an hour.
Eco-Design Hacks to Amplify Your Message
Maximize potency with these tailored tips:
- Use contrasting colors for data emphasis - deep greens against light skies for visibility.
- Layer infographics sparingly; one key stat per slide keeps focus sharp.
- Incorporate real photos via placeholders, grounding abstracts in reality.
- For virtual formats, opt for high-contrast modes to combat screen glare.
A light-hearted note: When charting plastic waste, add a quirky icon of a turtle in sunglasses - humor humanizes the heavy.
Outshining Standard Slides: The Edge You Need
Why settle for bland defaults when this template offers purpose-built precision? It outpaces basic builds with thematic depth and user-centric tweaks, proven to enhance credibility in expert circles. Your environmental pleas will land with the weight they deserve.
Step into the spotlight of sustainable storytelling. Secure your template now and let data bloom into advocacy.
Frequently Asked Questions
How many slides does this template include?
It offers 22 editable slides packed with environmental visualizations.
Can I use it for non-environmental topics?
While optimized for eco-data, its charts adapt beautifully to any analytical presentation.
What makes the designs user-friendly?
Simple drag-and-drop editing and pre-set layouts cater to all skill levels.
Are there maps included?
Yes, customizable maps enhance geographical insights like conservation zones.
How can I best present renewable energy data?
Stacked bar charts excel at showing adoption rates over time, driving home progress.
Is Google Slides support available?
PowerPoint native, but conversion to Google Slides is seamless with tools like export functions.