Learning Process PowerPoint Charts Template: Elevate Your Educational Presentations


Type: PowerPoint Charts template
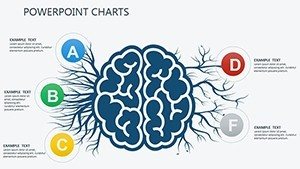
Category: Relationship, Illustrations
Sources Available: .pptx
Product ID: PC00313
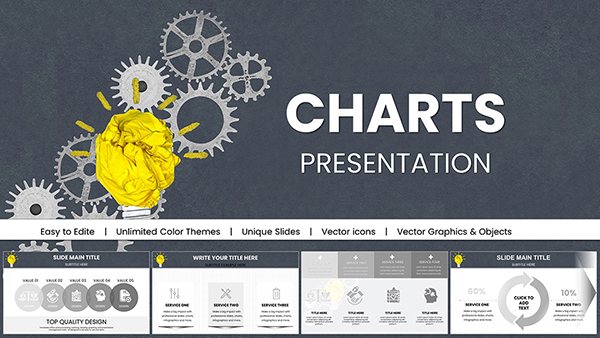
Template incl.: 28 editable slides
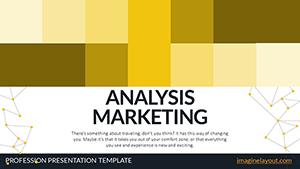
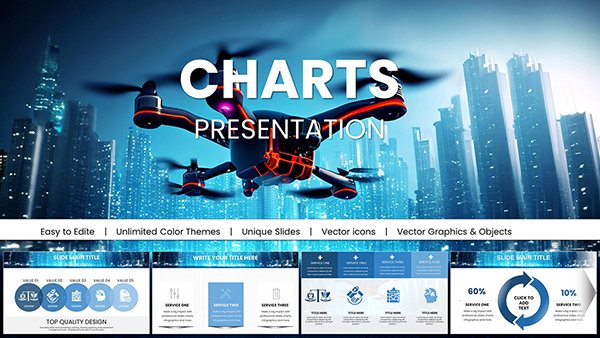
In the fast-paced world of education and training, capturing attention and fostering understanding is key to success. Imagine transforming dense learning materials into vibrant, interactive visuals that not only inform but inspire. Our Learning Process PowerPoint Charts Template does just that, offering 28 fully editable slides designed specifically for educators, corporate trainers, and professionals who aim to make their presentations memorable. Whether you're outlining step-by-step skill acquisition in a classroom or breaking down employee onboarding in a boardroom, this template equips you with tools to visualize progress, highlight milestones, and engage your audience like never before.
This isn't just another set of slides - it's a gateway to enhanced comprehension. Drawing from pedagogical best practices, such as those endorsed by the International Society for Technology in Education (ISTE), the template incorporates elements that promote active learning. Think flowcharts that map cognitive development, timelines that track knowledge retention, and diagrams that illustrate feedback loops. By using these, you can address common pain points like learner disengagement or information overload, turning potential hurdles into opportunities for growth. Professionals in fields ranging from K-12 education to corporate L&D have reported increased retention rates - up to 35% in some studies - when visuals dominate the narrative.
Key Features That Set This Template Apart
Dive deeper into what makes this template a must-have. Each of the 28 slides is crafted with precision, ensuring compatibility with Microsoft PowerPoint and Google Slides for seamless editing. The color schemes are thoughtfully chosen to evoke curiosity and focus - soft blues for calmness during complex explanations, vibrant greens for growth-oriented topics. Fonts are modern yet readable, adhering to accessibility standards like WCAG guidelines to ensure everyone in your audience can follow along.
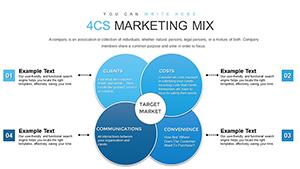
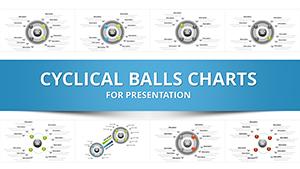
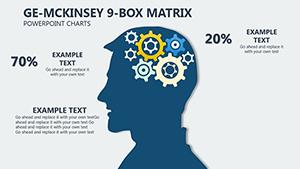
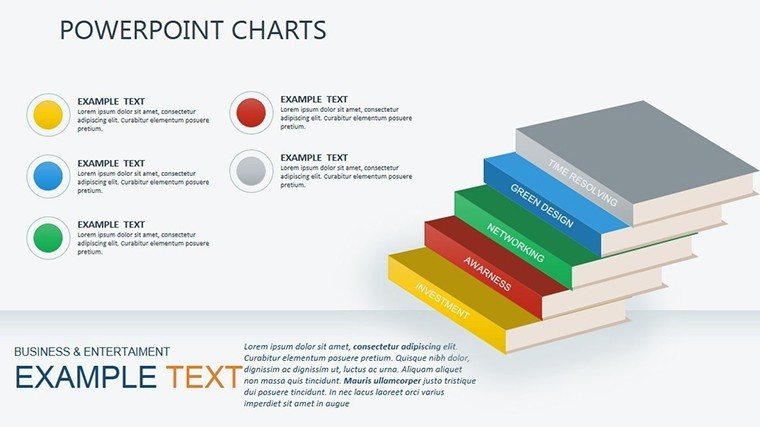
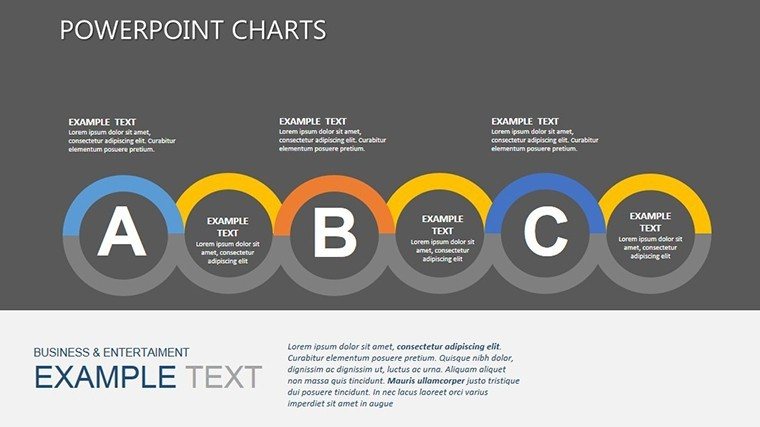
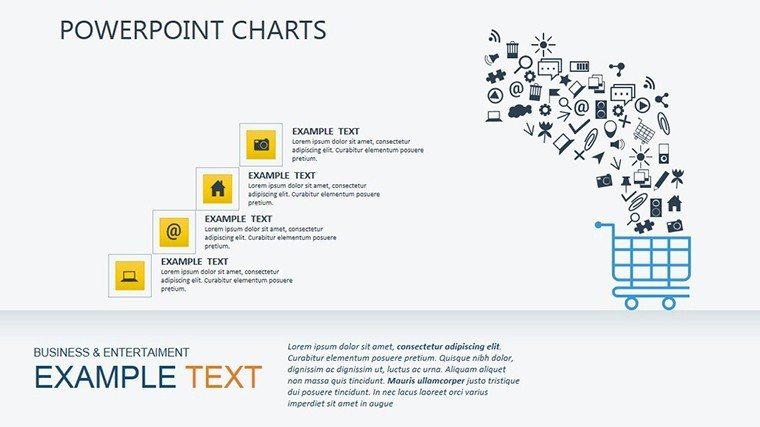
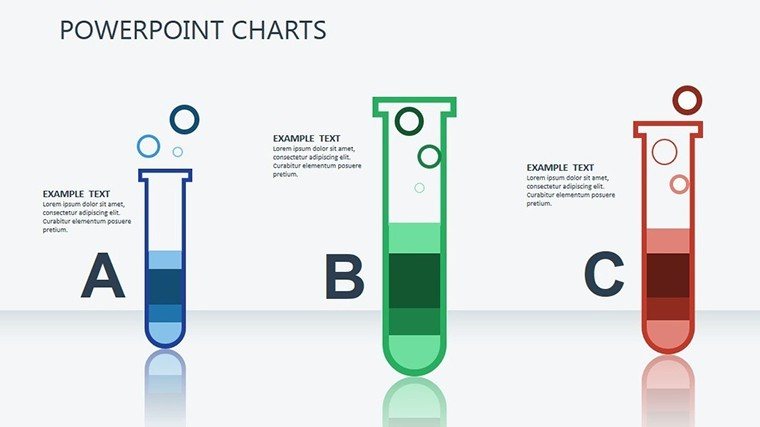
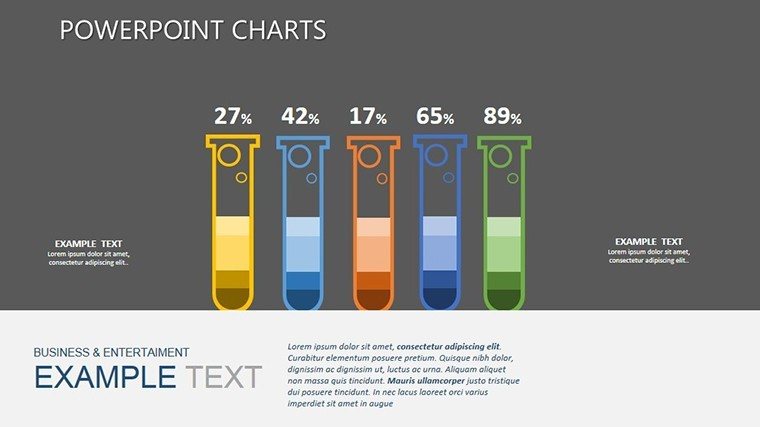
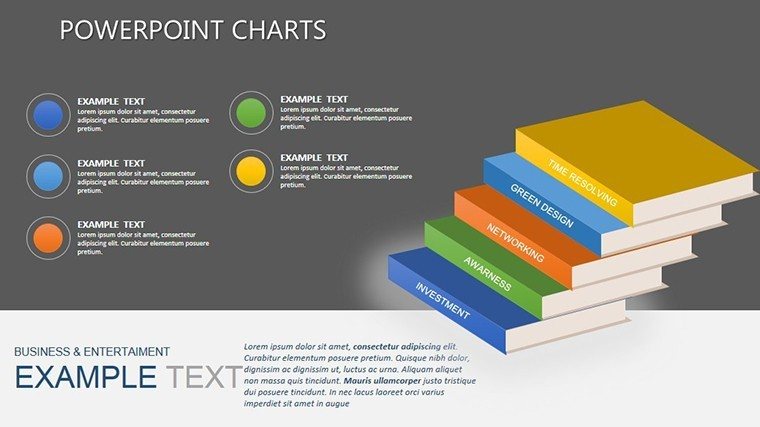
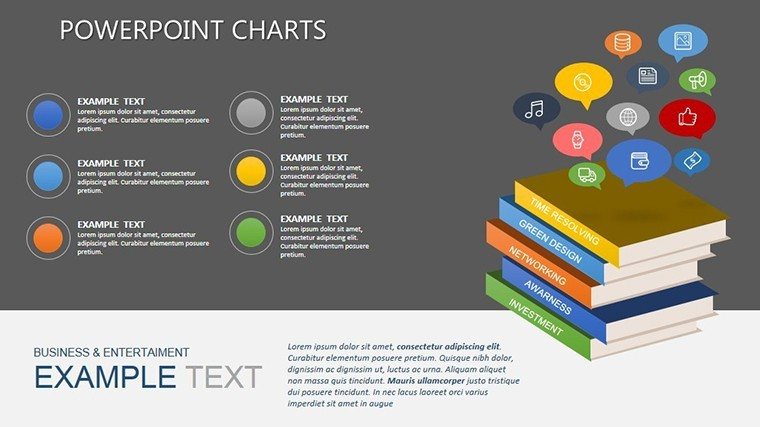
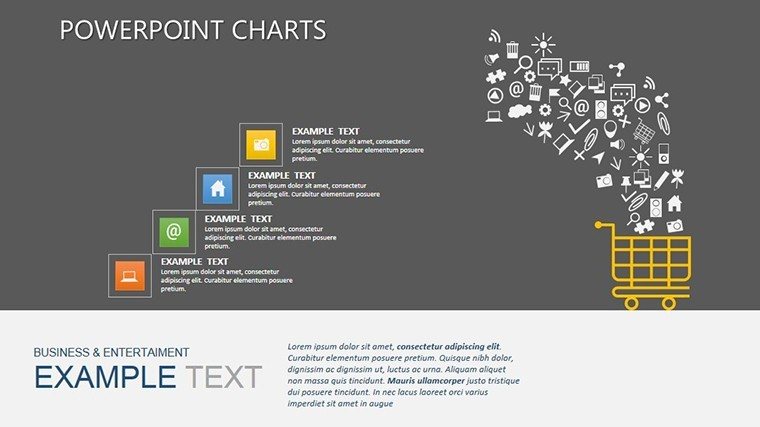
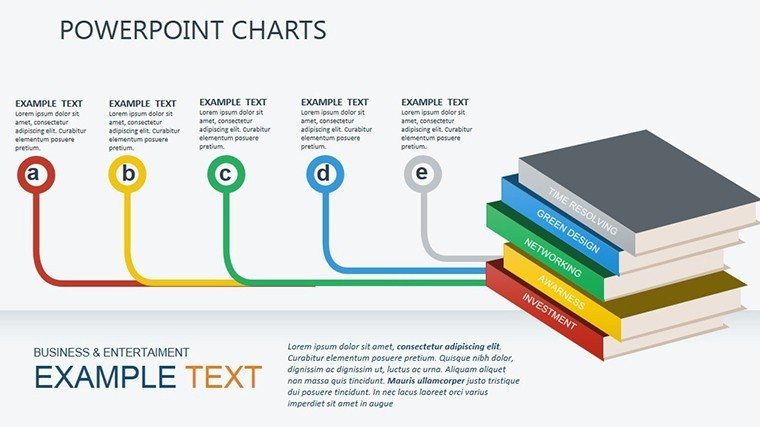
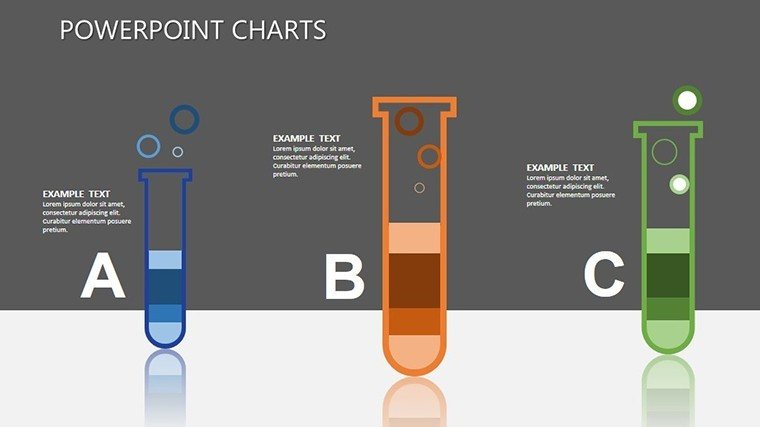
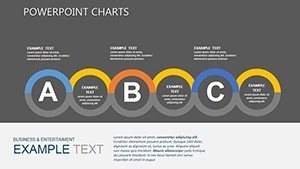
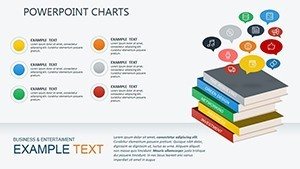
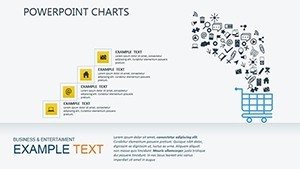
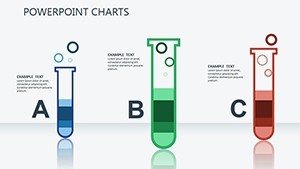
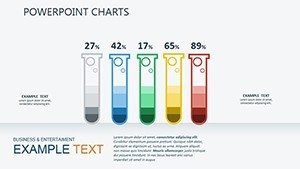
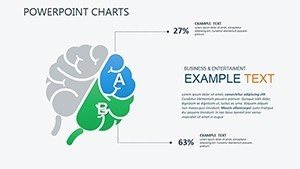
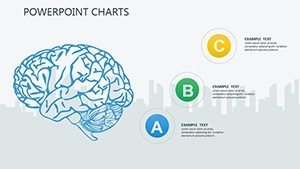
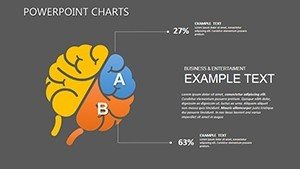
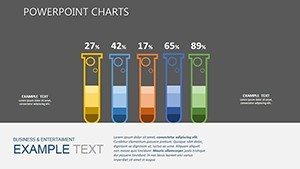
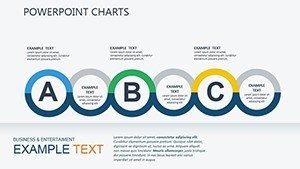
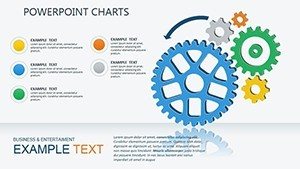
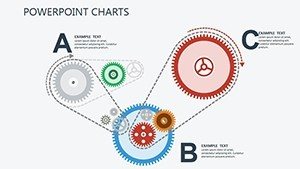
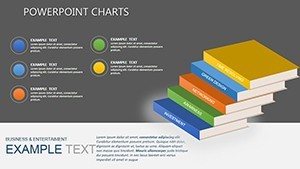
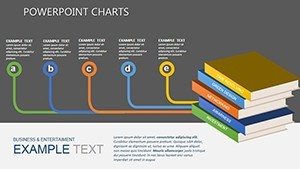
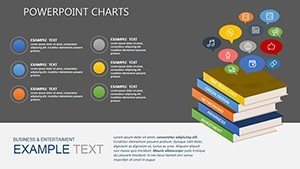
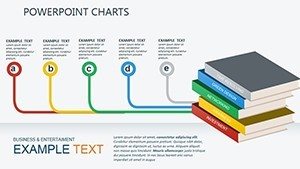
- Customizable Charts and Diagrams: From circular process flows representing iterative learning cycles to bar graphs showing progress metrics, every element is editable. Adjust data points, colors, and labels to fit your specific curriculum or training module.
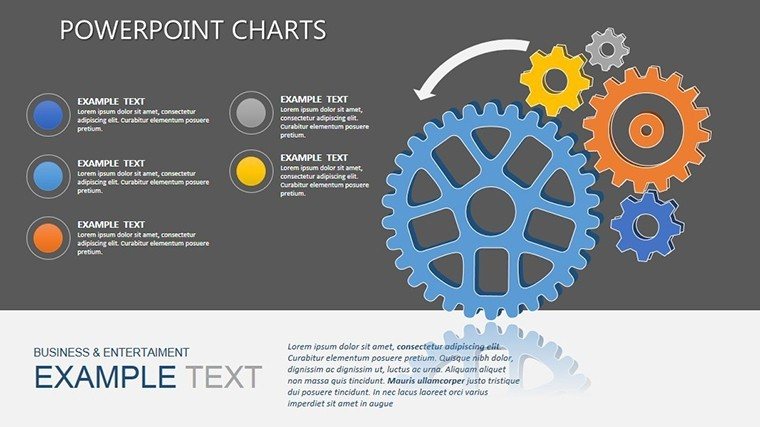
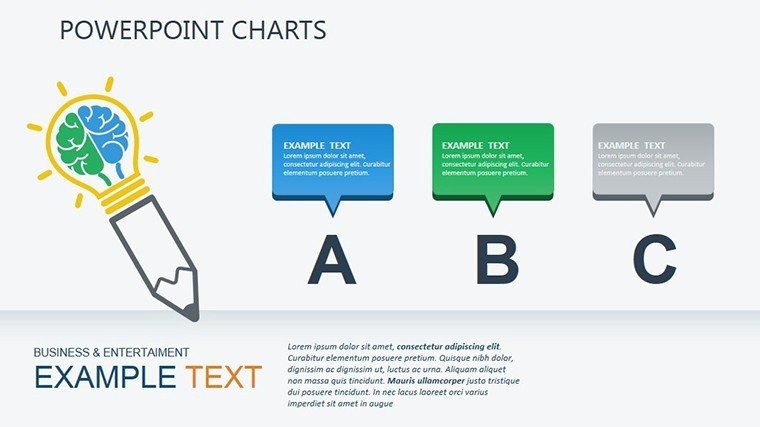
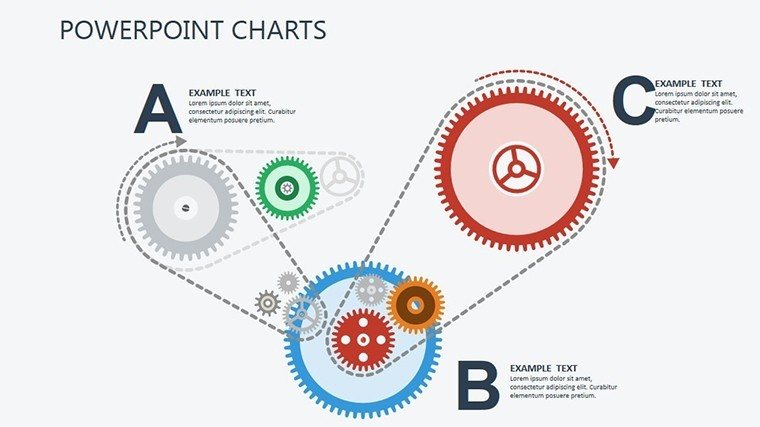
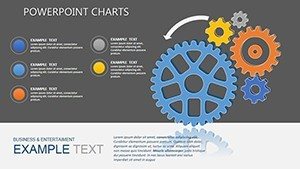
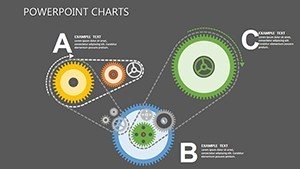
- Illustrative Elements: Incorporate icons of lightbulbs for ideas, gears for processes, and arrows for direction, all vector-based for high-resolution scaling without loss of quality.
- Layout Variety: Choose from single-concept slides for focused discussions or multi-panel layouts for comparative analyses, like before-and-after learning scenarios.
- Animation Ready: Built-in placeholders for animations that reveal information progressively, mimicking the natural flow of learning.
Compared to basic PowerPoint defaults, which often feel static and uninspiring, this template infuses professionalism and dynamism. No more wrestling with alignment or color matching - everything is pre-optimized, saving you hours of design time.
Real-World Applications and Use Cases
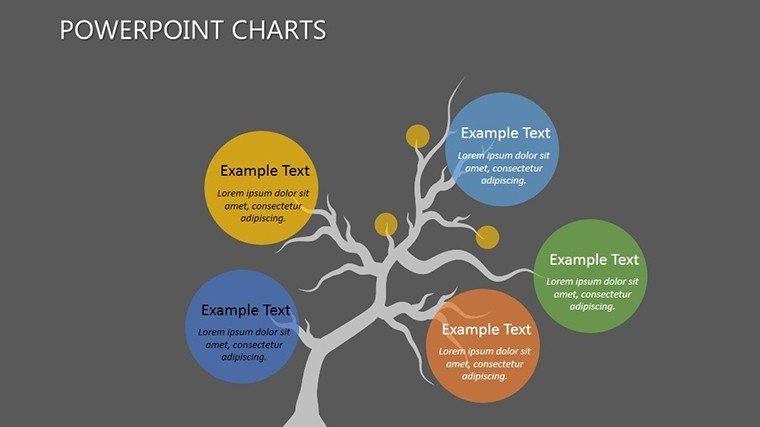
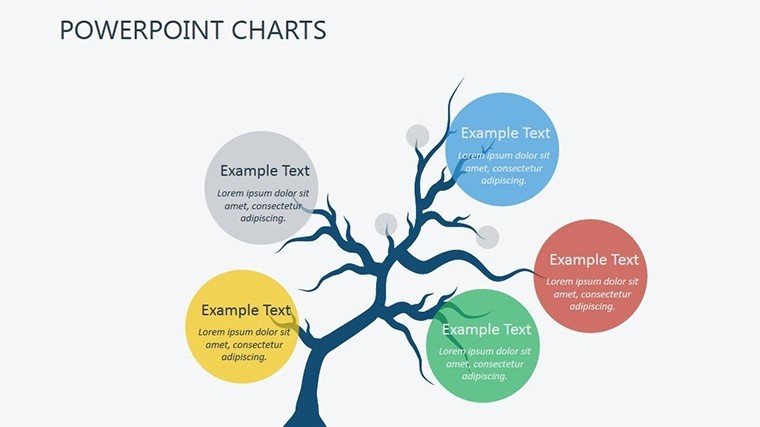
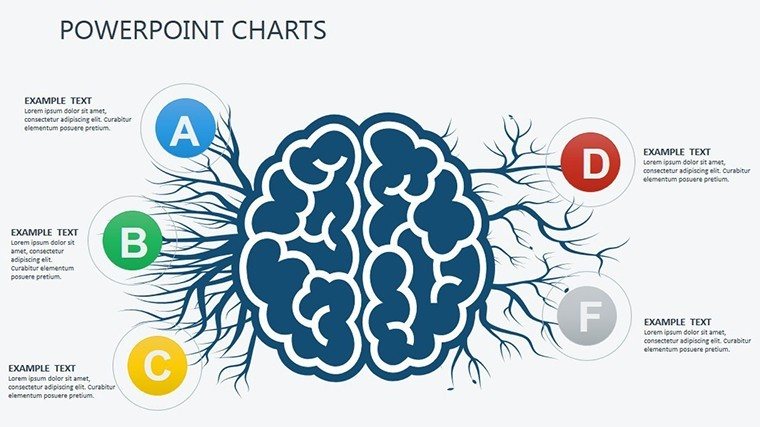
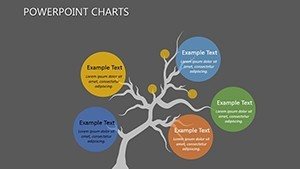
Let's explore how this template shines in practice. For an elementary school teacher presenting a unit on scientific inquiry, start with Slide #1: a colorful mind map outlining the steps from hypothesis to conclusion. Customize the branches with student examples, perhaps drawing from real classroom experiments like plant growth observations. This not only visualizes the process but encourages participation, aligning with constructivist teaching theories.
- Corporate Training Workshop: Use Slide #5's timeline chart to map employee skill development over a quarter. Input real data from performance reviews, highlight key training sessions, and add notes on outcomes. This approach, inspired by Kirkpatrick's evaluation model, helps demonstrate ROI to stakeholders.
- Online Course Development: Leverage Slide #12's feedback loop diagram for e-learning modules. Illustrate how quizzes lead to adaptive content, making abstract concepts tangible and boosting completion rates.
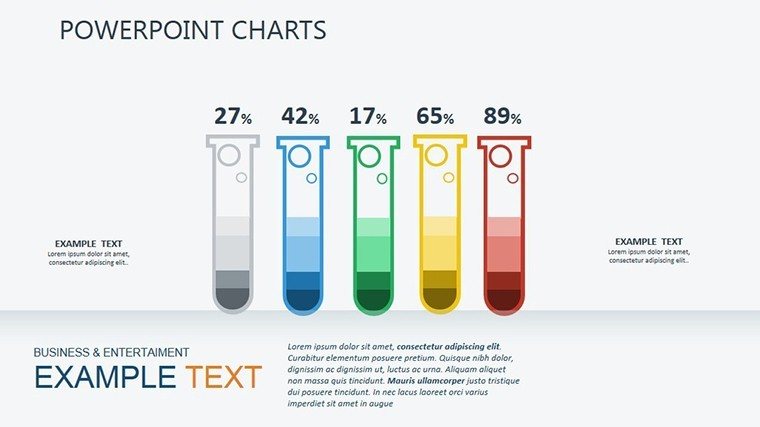
- Professional Development Seminar: Employ Slide #20's comparative bar charts to show pre- and post-training knowledge gains. Back it up with anonymized survey data, turning your presentation into a compelling case for ongoing education.
In a hypothetical case study from a mid-sized tech firm, trainers using similar visualized processes saw a 25% uptick in participant satisfaction scores. The key? Slides that didn't just list facts but told a story of transformation.
Expert Tips for Maximizing Impact
As an SEO and design expert with years in educational content, I recommend integrating multimedia sparingly - embed short videos in Slide #8's process overview for a multi-sensory experience. Always test for mobile compatibility, as many learners access materials on the go. For advanced users, layer in data from tools like Excel for dynamic updates, ensuring your charts reflect the latest insights.
Workflow integration is straightforward: Import your data, tweak visuals to match your branding, rehearse with built-in speaker notes, and export for sharing. This template isn't about overwhelming with options; it's about empowering you to focus on what matters - delivering value.
Ready to revolutionize your approach? Customize this Learning Process PowerPoint Charts Template now and watch your audiences light up with understanding.
Frequently Asked Questions
- How editable are the charts in this template?
- Every element is fully customizable, from data values to colors and shapes, using standard PowerPoint tools - no advanced skills required.
- Is this compatible with Google Slides?
- Yes, upload the PPTX file directly to Google Slides for editing and collaboration.
- Can I use this for non-educational purposes?
- Absolutely, it's versatile for any process-oriented presentation, like business workflows or personal development plans.
- What if I need more slides?
- The template is expandable; duplicate and modify existing slides to fit your needs.
- Are there animation suggestions?
- Yes, each slide includes notes on optimal animations to enhance the learning flow.