Pyramid Chart PowerPoint Template - Fully Editable Geometric Diagrams | Instant Download


Type: PowerPoint Charts template
Category: Pyramids
Sources Available: .pptx
Product ID: PC00311
Template incl.: 26 editable slides
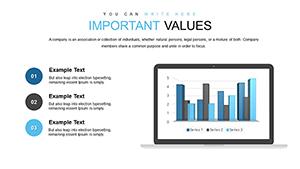
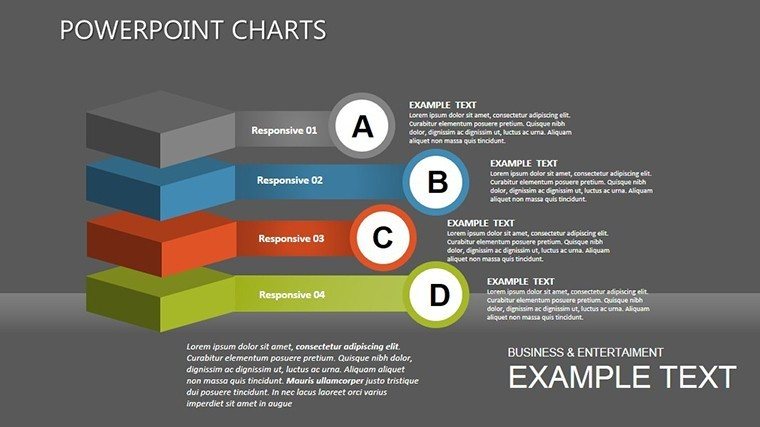
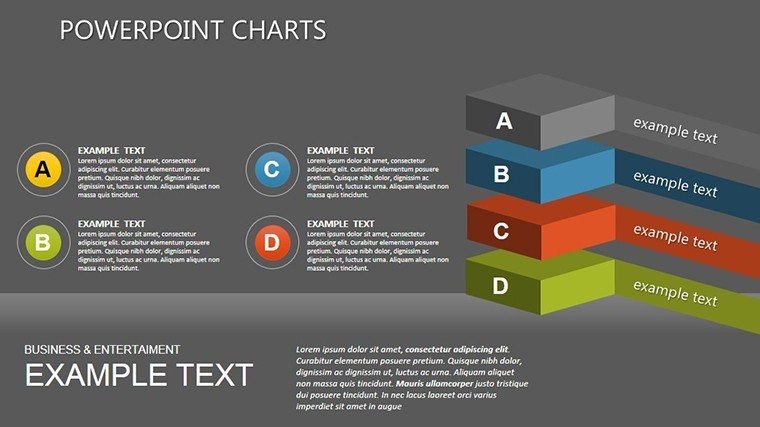
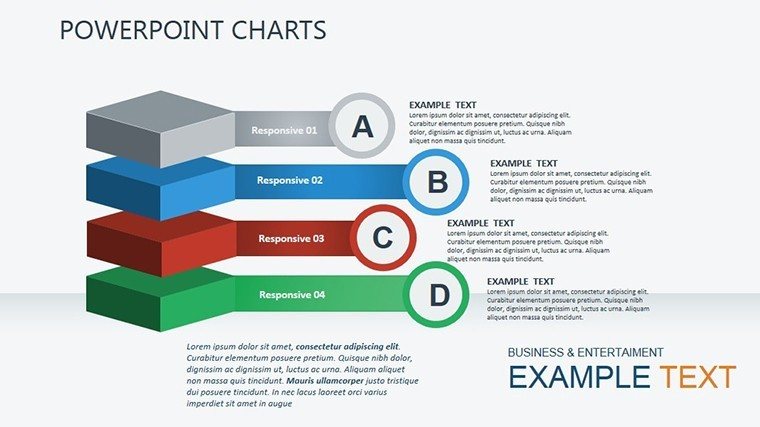
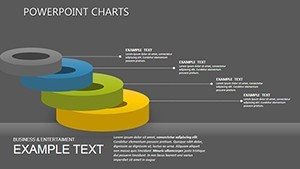
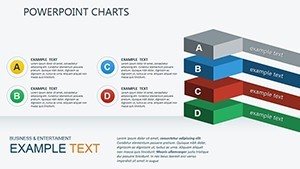
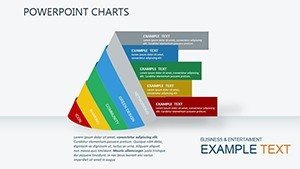
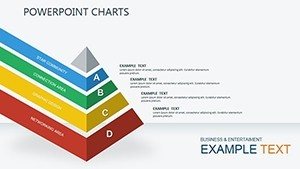
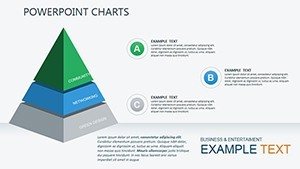
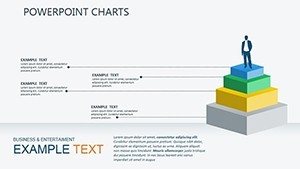
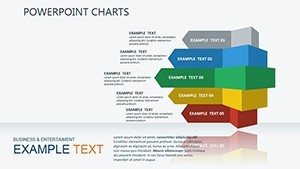
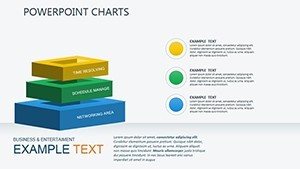
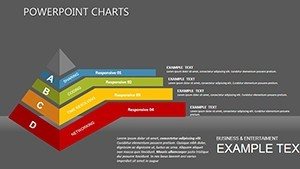
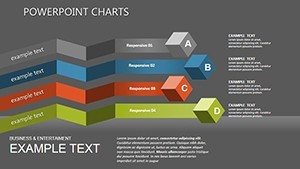
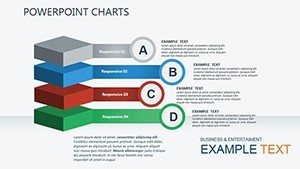
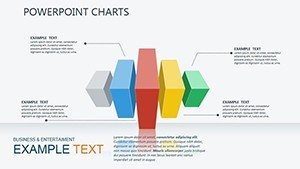
Create impactful hierarchical visualizations using this professional Pyramid Chart PowerPoint template with geometric diagrams. 26 editable slides perfect for business strategies, project management, education, and consulting presentations. Instant download.
When to Use Pyramid and Geometric Charts in Presentations
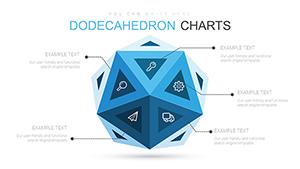
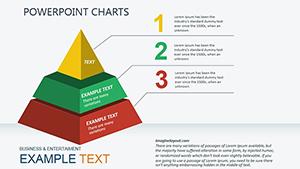
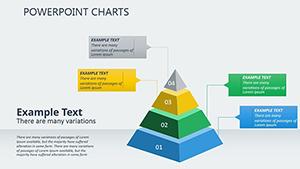
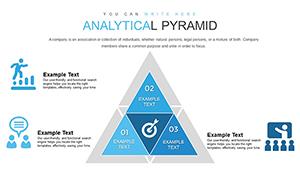
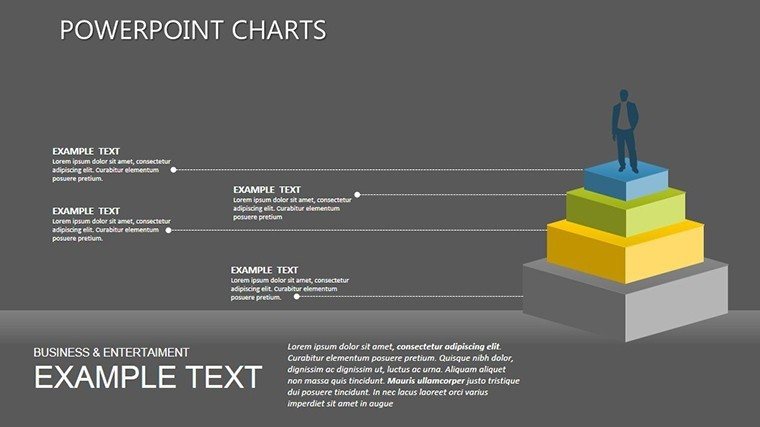
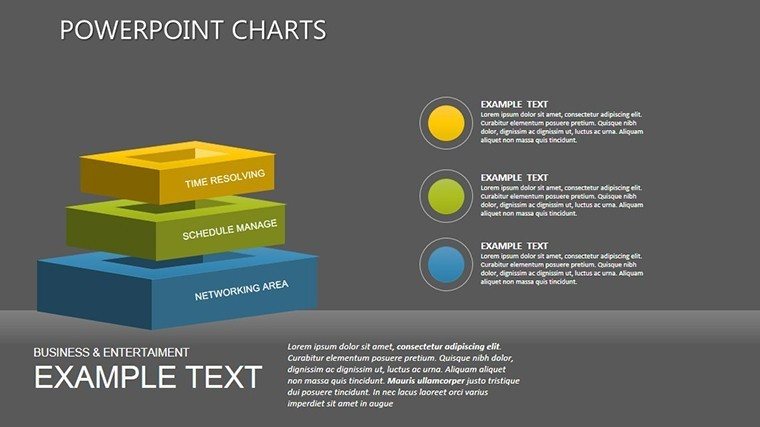
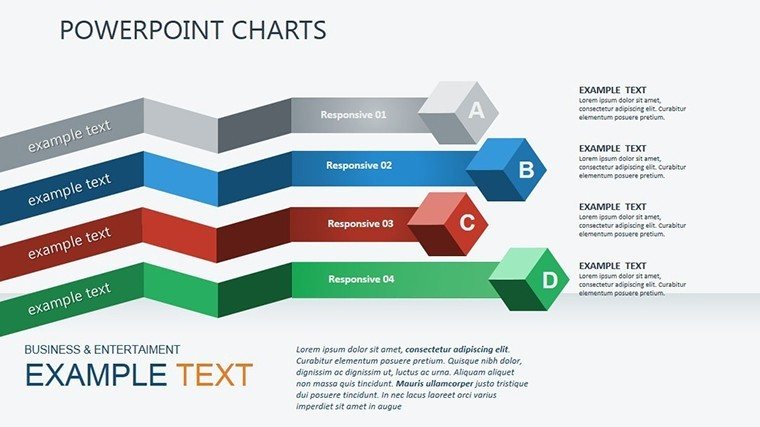
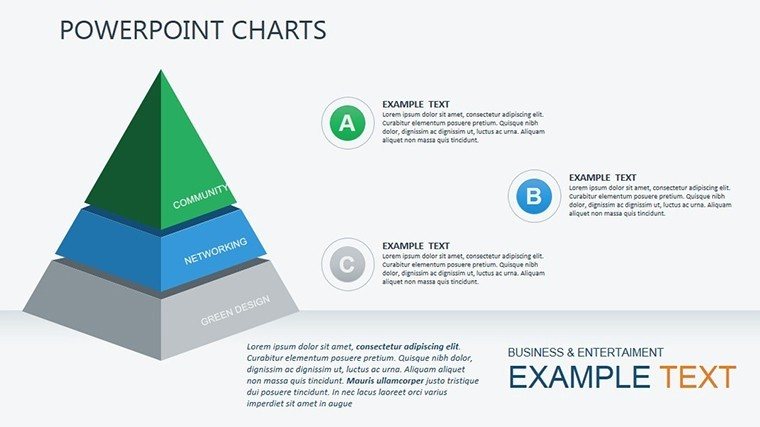
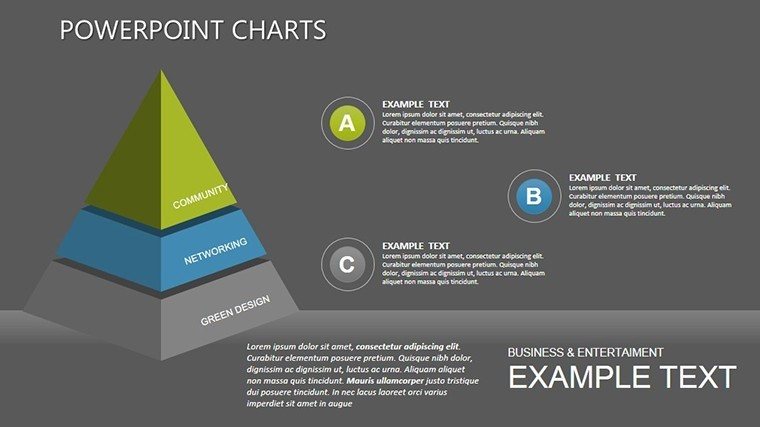
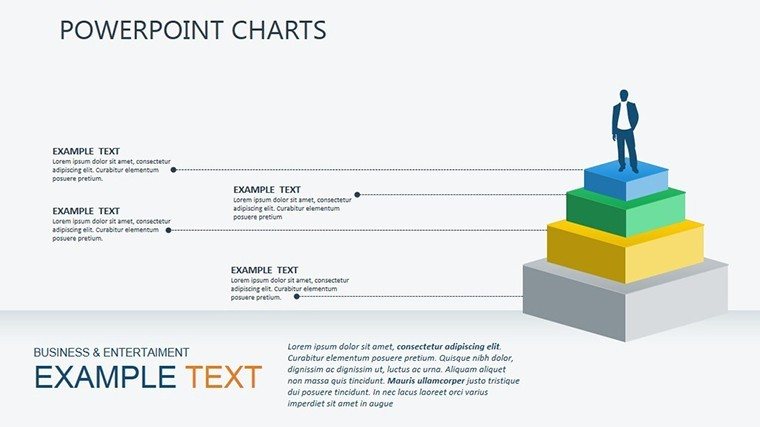
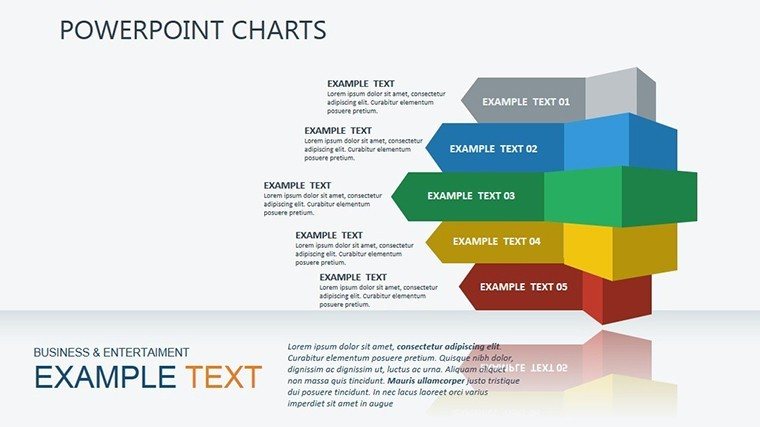
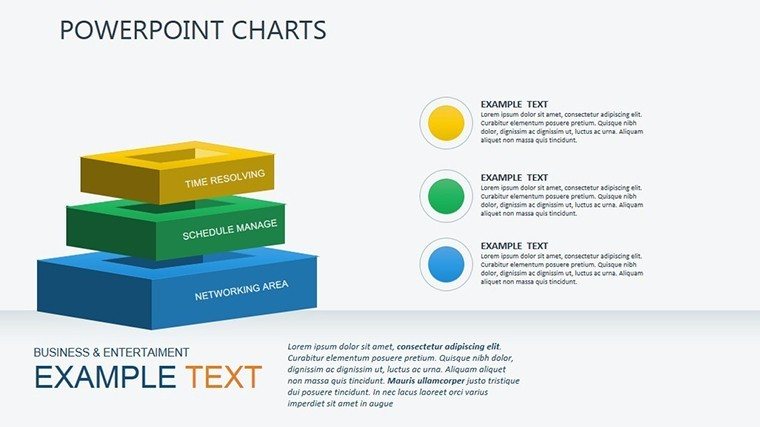
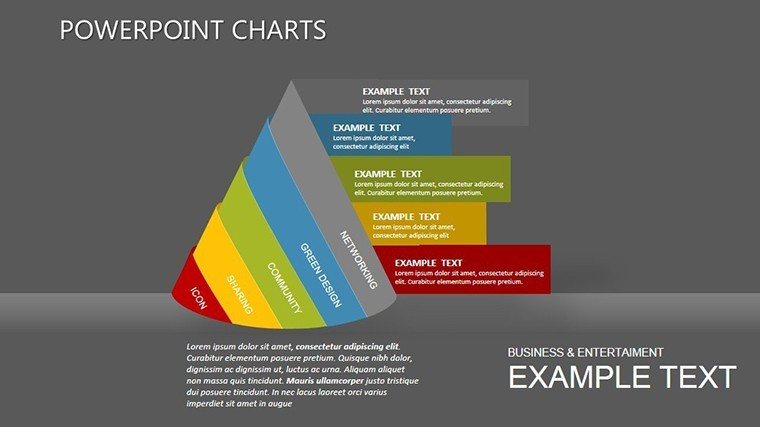
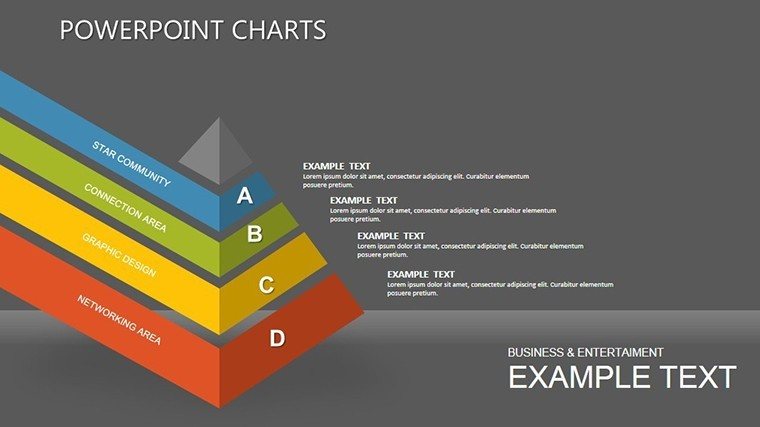
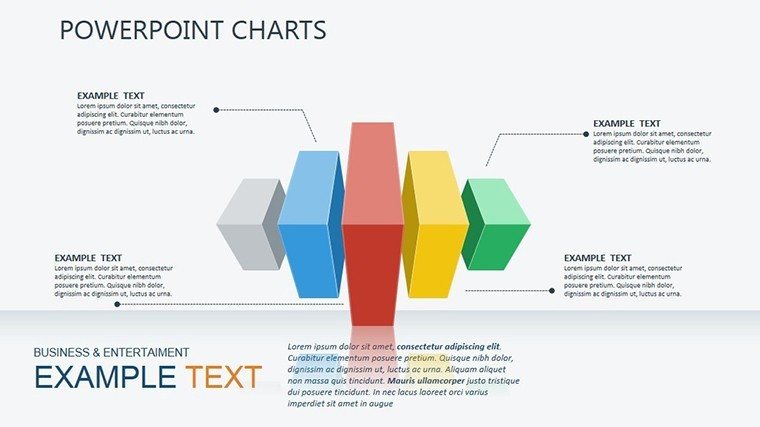
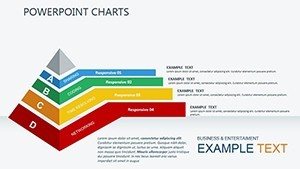
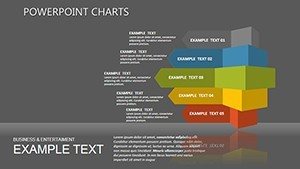
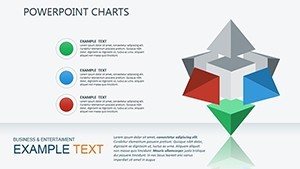
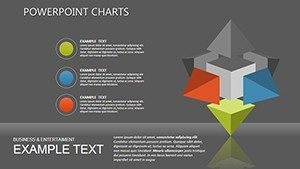
Pyramid charts are excellent for illustrating layered information such as organizational hierarchies, priority levels, or growth stages. Geometric shapes complement them by providing clean visuals for cycles, matrices, or structural comparisons. This template helps solve the common problem of making complex data easy to understand at a glance.
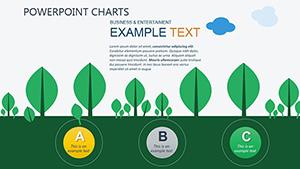
Business professionals use it for strategy overviews, sales funnel analysis, and market positioning. Educators rely on it for explaining theories and concepts with visual depth. Consultants find it ideal for client reports and workshop materials.
Key Features
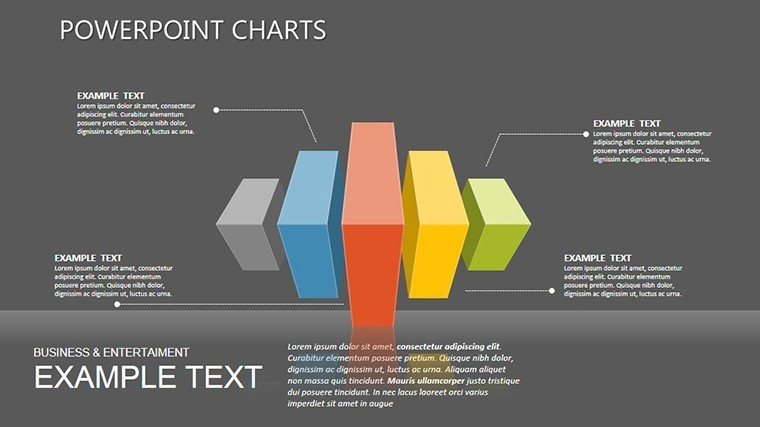
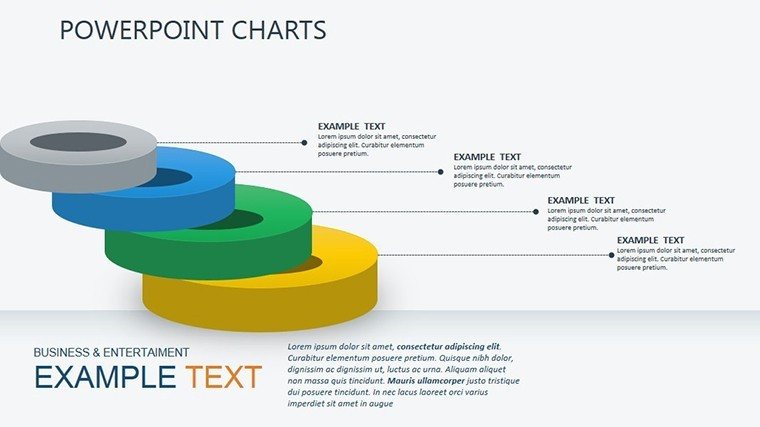
- 26 fully editable slides with striking pyramid and geometric designs
- Vector-based shapes for easy resizing and customization
- Professional color options that match any brand identity
- Compatible with PowerPoint on PC and Mac
- Data visualization optimized for clarity and impact
How to Use This Template
Download the file and open it in Microsoft PowerPoint. Replace placeholder text and data with your information using standard editing tools. Adjust colors, add your logo, and rearrange elements as needed. The intuitive design ensures your presentation looks polished in minutes.
Tested in real scenarios like quarterly reviews and proposal pitches, these slides help maintain audience engagement throughout.
Download now to transform your next presentation with professional pyramid charts.
Frequently Asked Questions
Is the Pyramid Chart PowerPoint template fully editable?
Yes, all shapes, text, colors, and layouts can be customized using standard PowerPoint features.
How many slides are included?
The template includes 26 unique editable slides with various pyramid and geometric chart variations.
What versions of PowerPoint does it support?
It is optimized for PowerPoint 2016 and newer versions, with good compatibility for most recent releases.
Can I use it for client projects?
Yes, the template is licensed for both personal and commercial use including client deliverables.