Development Ecology PowerPoint Charts Template


Type: PowerPoint Charts template
Category: Illustrations
Sources Available: .pptx
Product ID: PC00310
Template incl.: 15 editable slides
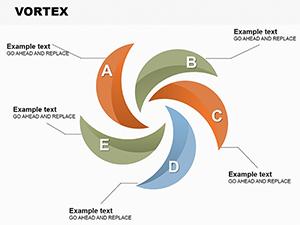
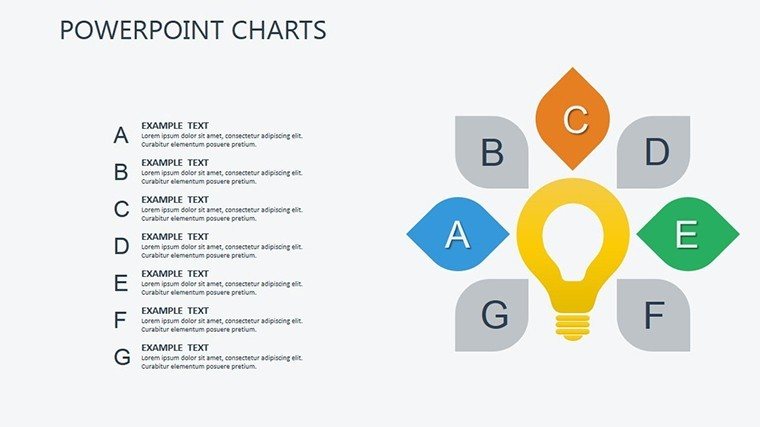
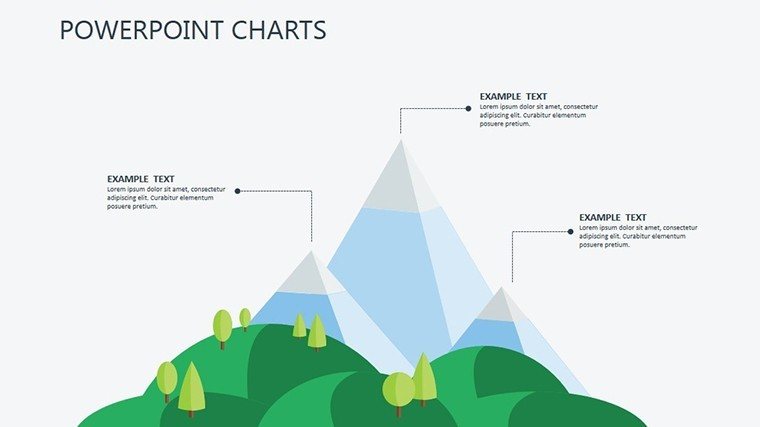
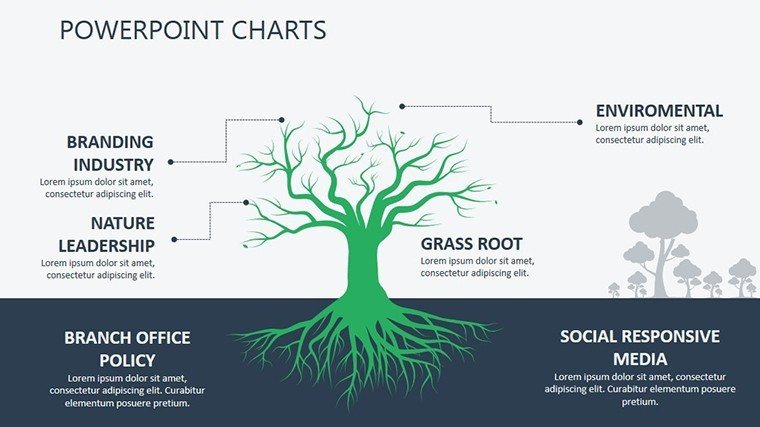
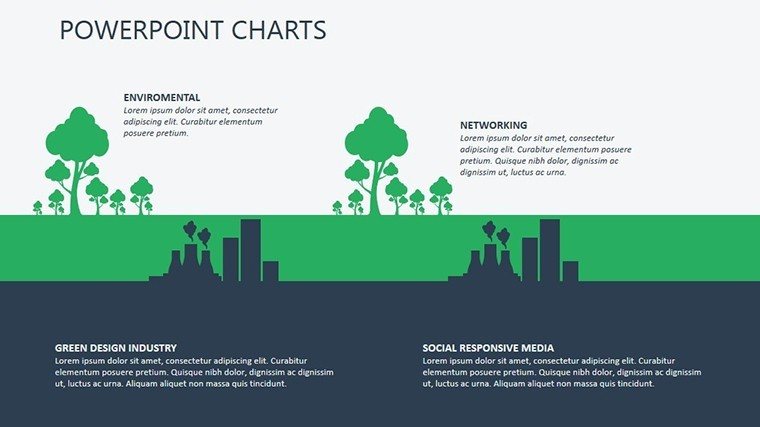
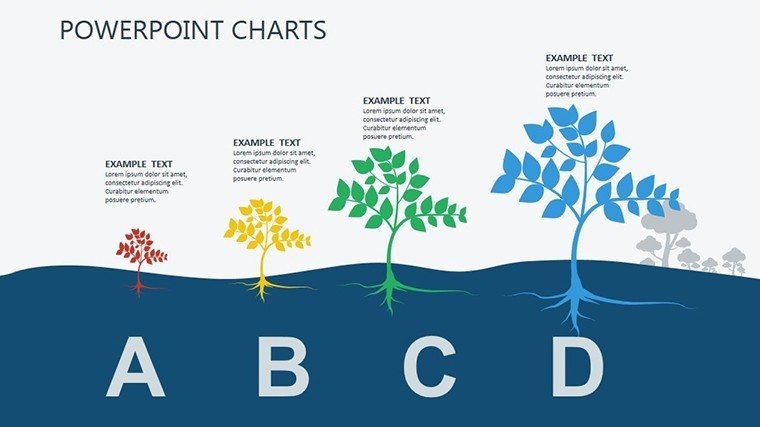
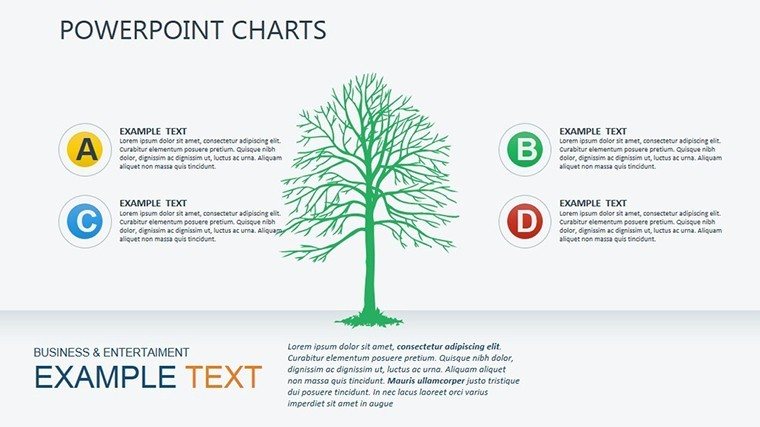
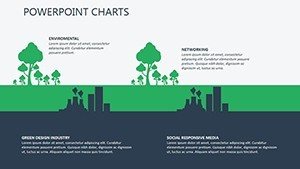
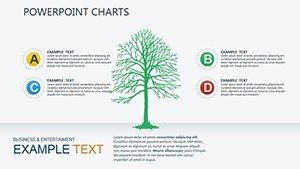
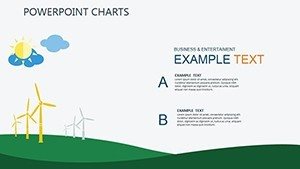
Elevate your presentations with our editable Ecology PowerPoint Charts Template. Showcase environmental data, trends, and solutions with impactful infographics. Ideal for professionals in the development and ecology fields.
Welcome to our Ecology PowerPoint Charts Template, a powerful tool designed to amplify your presentations in the realms of development and environmental sustainability. With this versatile template, you can effortlessly convey complex data and trends, making your message not only informative but also visually compelling.
Why Choose Our Ecology PowerPoint Charts Template:
- Tailored for Sustainability Professionals: Crafted by experts in the development and ecology fields, our template addresses the specific needs of those passionate about sustainable progress.
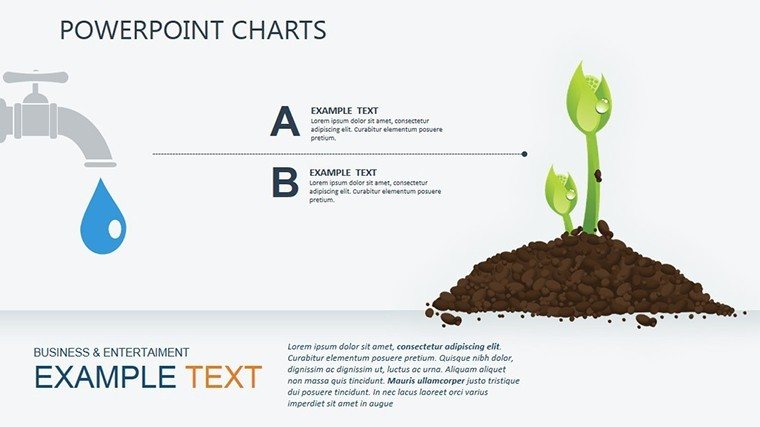
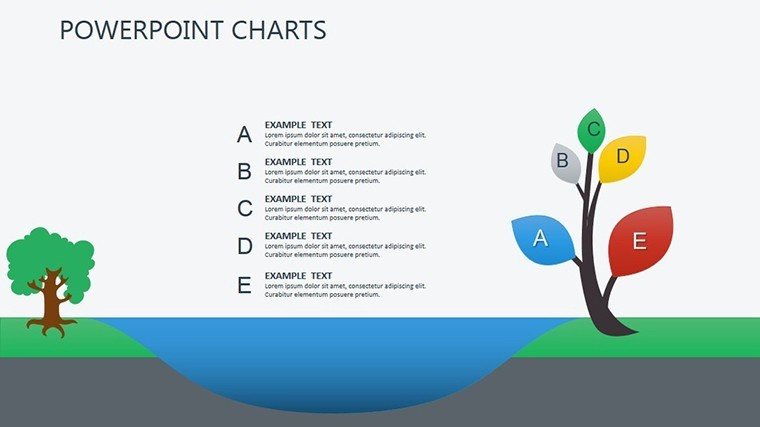
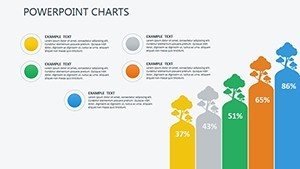
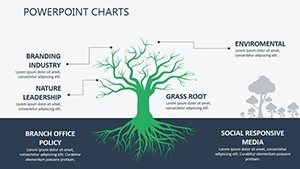
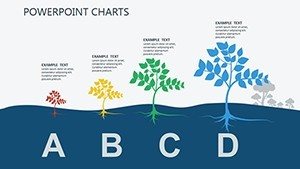
- Dynamic Infographics: Transform data into captivating visuals. Our editable charts and graphs provide an intuitive way to represent environmental trends and solutions.
- Customizable and User-Friendly: Adapt each slide to suit your unique content. With easy-to-use features, you can seamlessly integrate your data and messaging.
Features of Our Ecology PowerPoint Charts Template:
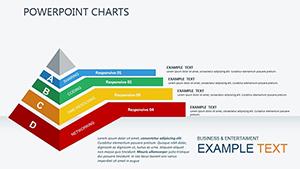
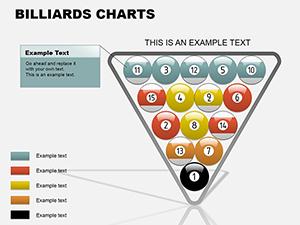
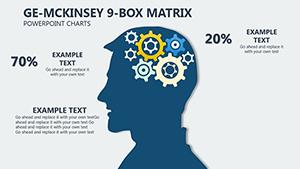
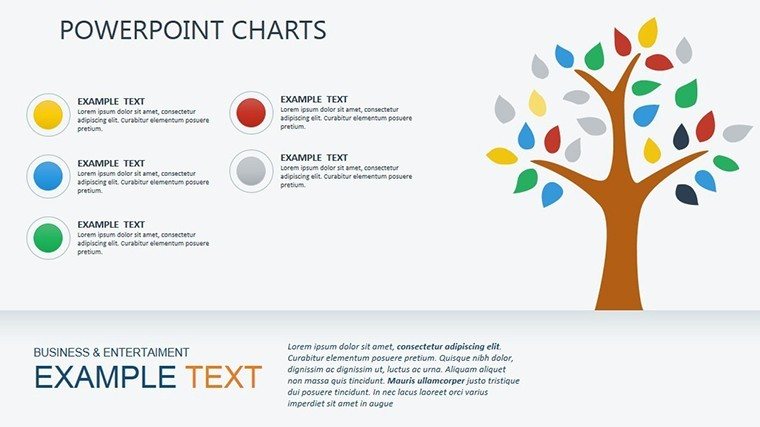
1. Variety of Chart Types:
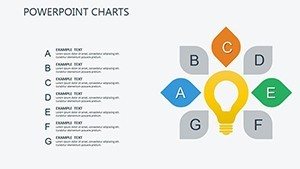
Dive into a diverse collection of chart styles including bar graphs, pie charts, and line graphs. Each can be tailored to present data in the most effective manner.
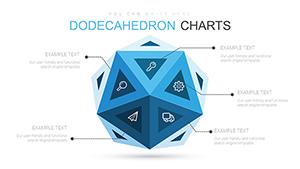
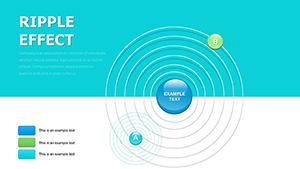
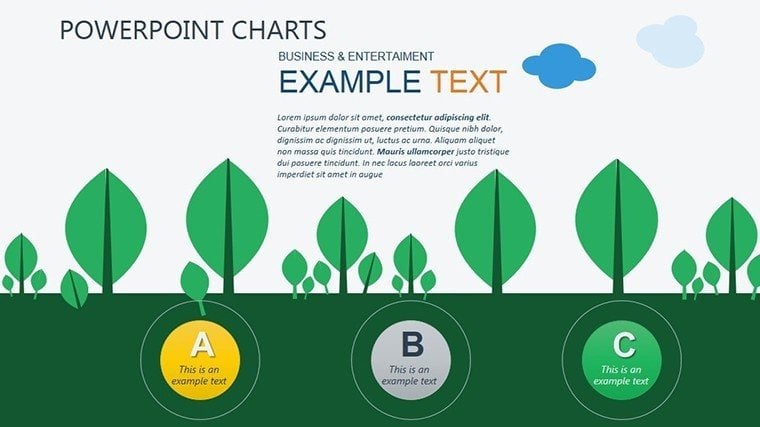
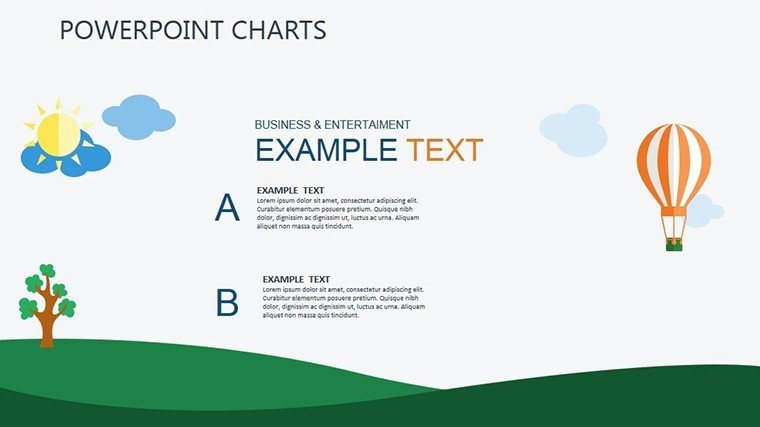
2. Infographic Elements:
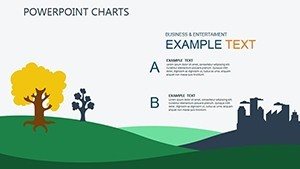
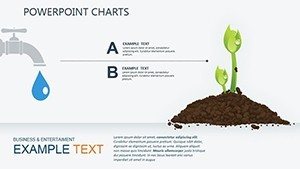
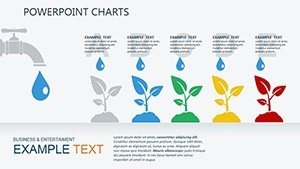
Enhance your presentations with a range of editable icons, images, and shapes. These elements add depth to your content and facilitate clearer communication.
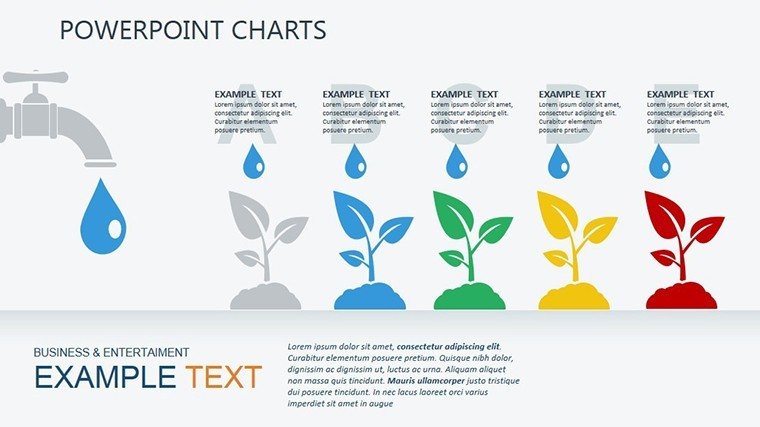
3. Data-Driven Insights:
Our template supports dynamic data inputs, ensuring that your information remains up-to-date and relevant. This feature is invaluable for presenting evolving environmental statistics.
4. Intuitive Editing Tools:
Navigate with ease through our user-friendly interface. Customize colors, fonts, and layouts effortlessly, even for those with limited design experience.
Who Benefits from Our Ecology PowerPoint Charts Template:
- Environmental Advocates: Empower your advocacy efforts with compelling visuals that drive home the urgency of ecological concerns.
- Development Professionals: Clearly communicate sustainable strategies and progress reports to stakeholders and partners.
- Educators and Researchers: Make complex environmental data accessible to students, colleagues, and peers, fostering a deeper understanding of ecological issues.
Our Ecology PowerPoint Charts Template is more than just a presentation tool; it's a catalyst for positive change. Elevate your message, inspire action, and contribute to a more sustainable future. Download now and be a part of the movement towards a greener, more prosperous world.