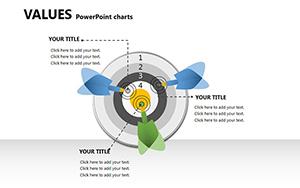
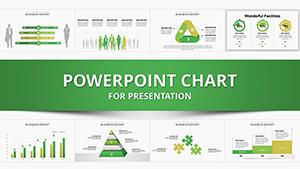
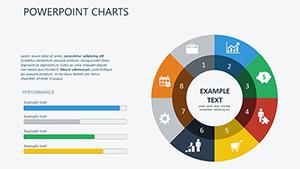
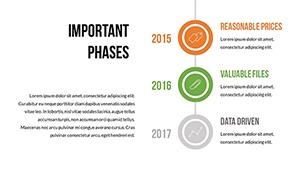
PR PowerPoint Charts Template: Transform Data into Storytelling Mastery


Type: PowerPoint Charts template
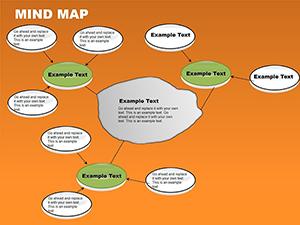
Category: Relationship
Sources Available: .pptx
Product ID: PC00269
Template incl.: 24 editable slides
Imagine stepping into a boardroom where your latest PR campaign doesn't just get presented - it captivates, convinces, and converts. That's the power of our PR PowerPoint Charts Template, a meticulously crafted toolkit designed specifically for public relations pros who need to turn raw metrics into riveting narratives. With 24 fully editable slides, this template isn't just a collection of graphs; it's your secret weapon for making complex data dance in harmony with your brand's voice.
In the fast-paced world of PR, where every pitch, report, or stakeholder update counts, clarity and visual punch are non-negotiable. Our template dives deep into the needs of PR managers and executives, offering versatile bar graphs for comparing media coverage across channels and pie charts that slice through audience demographics with surgical precision. Whether you're highlighting a crisis averted or celebrating a viral success, these charts adapt seamlessly to your story. Built with compatibility in mind - working flawlessly in PowerPoint and Google Slides - this resource saves you hours of design drudgery, letting you focus on what you do best: shaping perceptions and driving results.
What sets this apart? It's not generic clipart fodder. Drawing from real-world PR triumphs - like the award-winning Dove Real Beauty campaign that used simple visuals to amplify emotional impact - we've infused industry-specific icons and layouts. Think subtle nods to press releases, social buzz metrics, and ROI breakdowns that resonate with C-suite audiences. Professionals from agencies like Edelman or in-house teams at Fortune 500s have raved about how such tools elevate their game, turning "good enough" presentations into unforgettable ones. Ready to unlock that edge? Let's explore how this template fits into your workflow.
Unlocking Key Features: Customization That Speaks Your Language
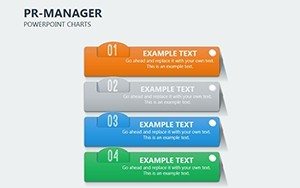
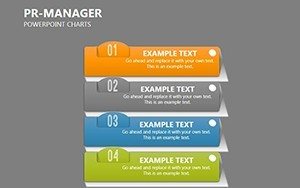
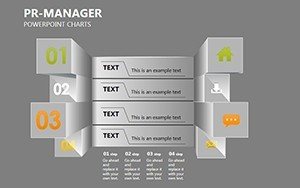
At the heart of our PR PowerPoint Charts Template lies unparalleled flexibility. Each of the 24 slides is a canvas waiting for your touch - drag, drop, and tweak colors to match your client's palette, swap fonts for that on-brand elegance, or resize elements without losing a pixel of polish. We've prioritized editable vectors for charts, ensuring your bar graphs scale from quarterly overviews to annual deep dives without distortion.
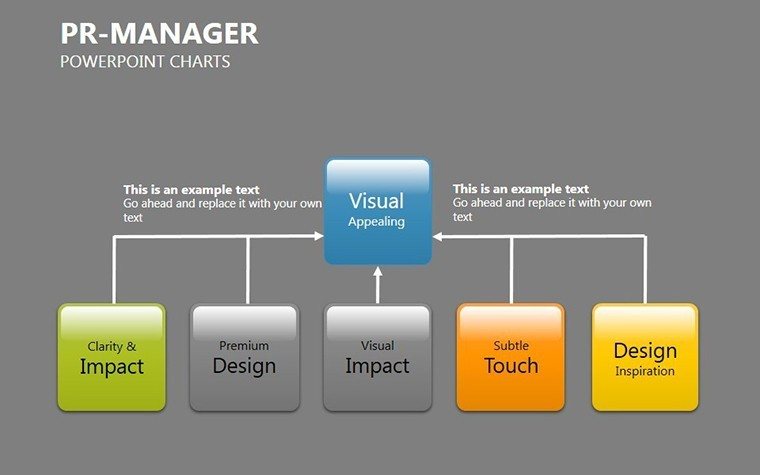
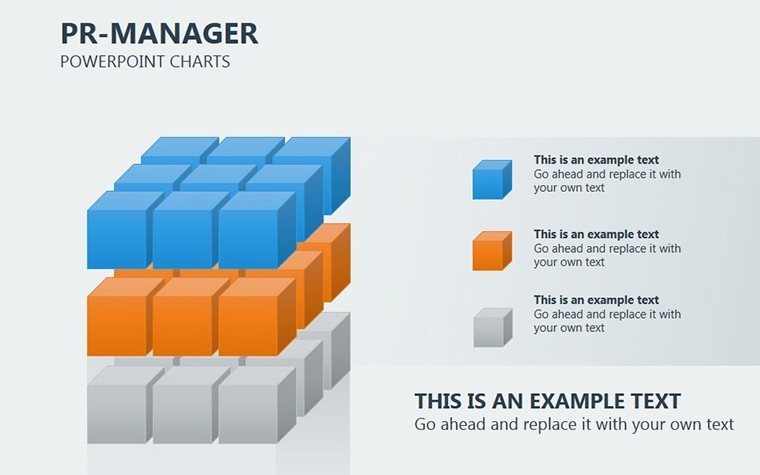
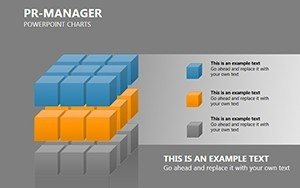
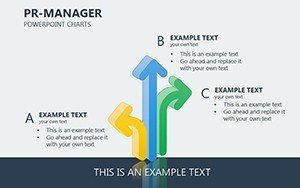
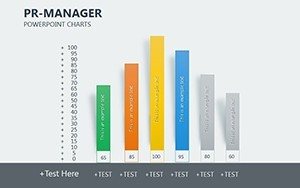
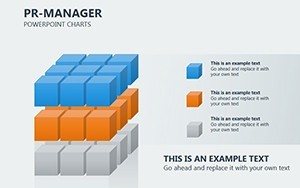
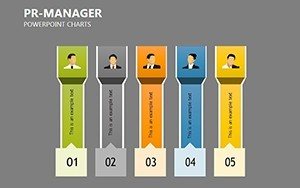
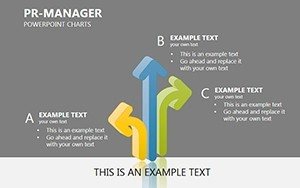
- Dynamic Bar Graphs: Ideal for timeline comparisons, like tracking sentiment shifts pre- and post-campaign. Input your data, and watch bars rise (or pivot) to tell the tale of your strategic wins.
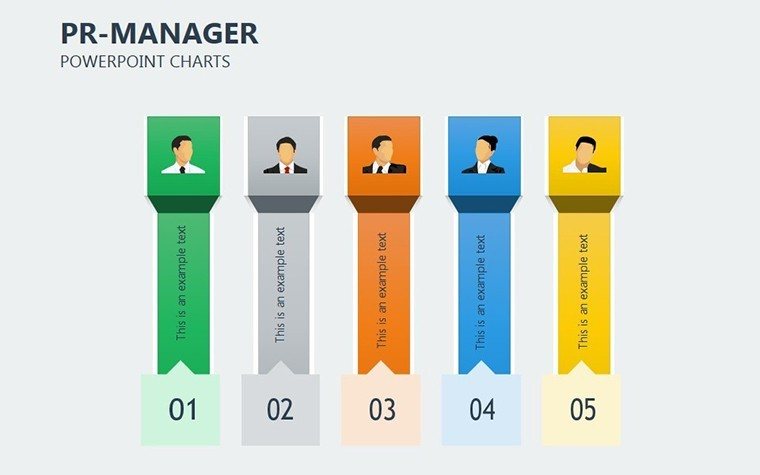
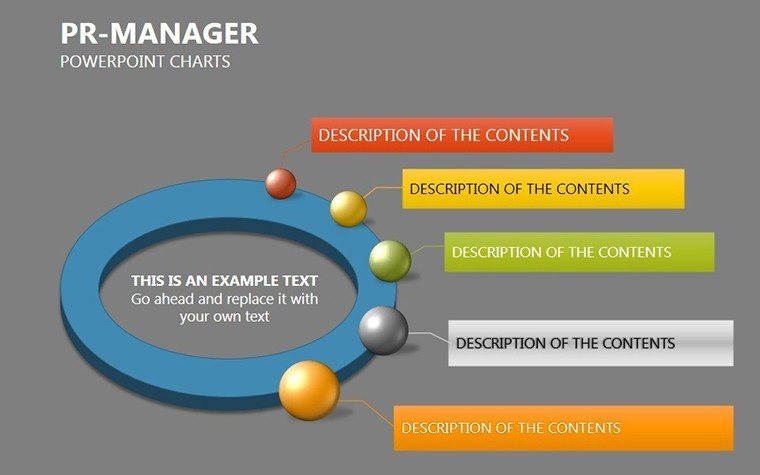
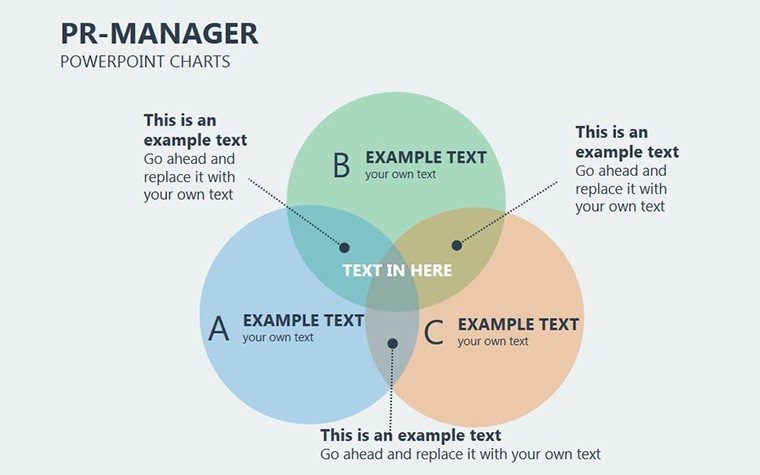
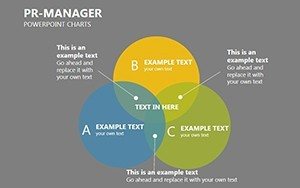
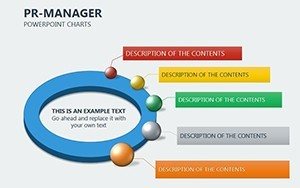
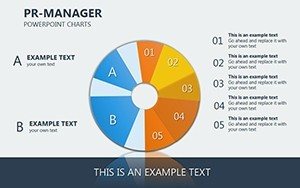
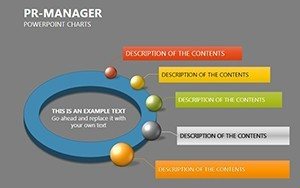
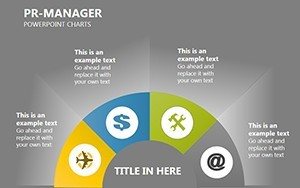
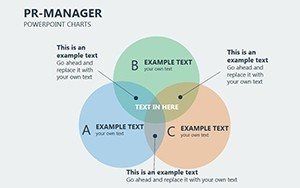
- Insightful Pie Charts: Break down stakeholder engagement by segment - media, influencers, or community - revealing slices of influence that guide future outreach.
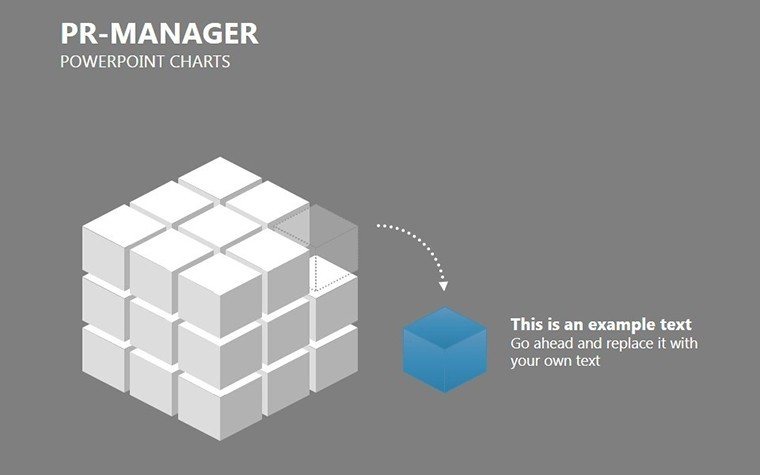
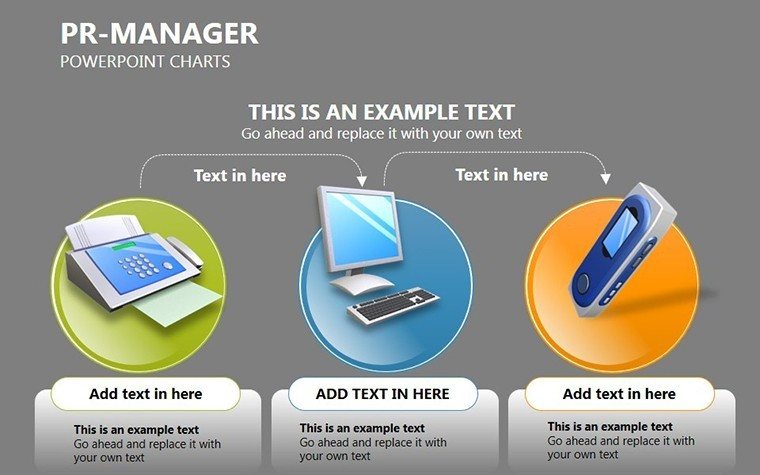
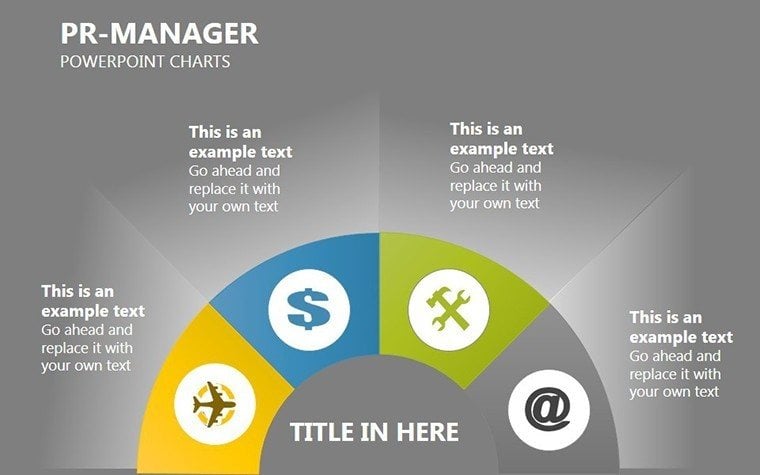
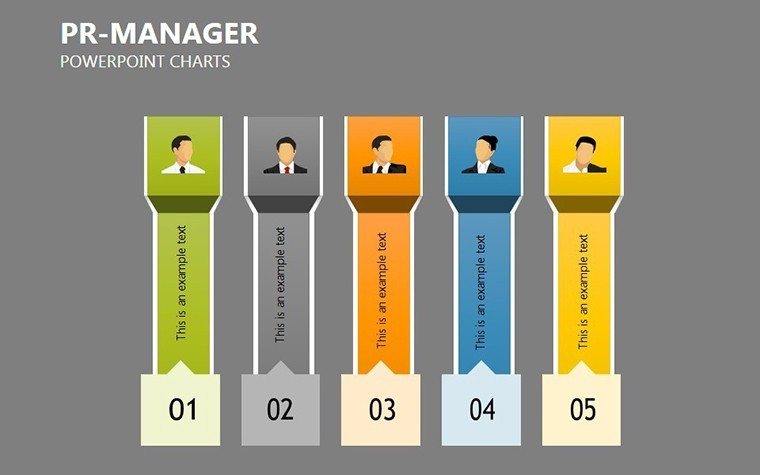
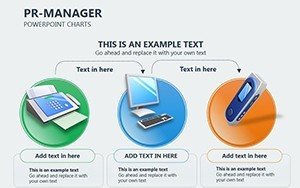
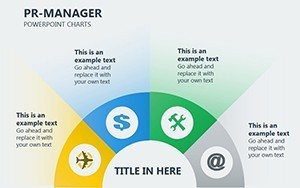
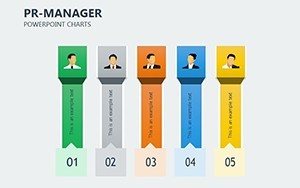
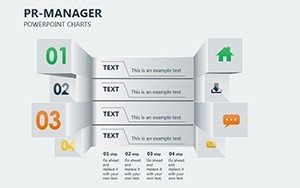
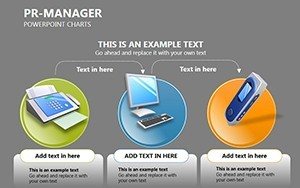
- Themed Icons & Layouts: From megaphone motifs for amplification metrics to handshake symbols for partnership impacts, these add a layer of thematic relevance that generic templates lack.
Beyond basics, integrate animations for subtle reveals - fade in data points to build suspense during pitches. Compatible with PowerPoint's latest versions, it even supports hyperlinks for embedding live social media feeds, keeping your presentation as current as your news cycle.
Real-World Applications: From Pitch Decks to Performance Reviews
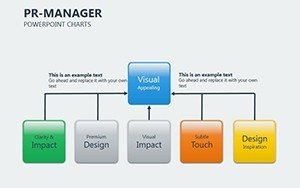
Picture this: You're prepping a proposal for a high-stakes client acquisition. Our template shines here, with slides dedicated to SWOT analyses visualized through stacked bars that highlight PR opportunities amid threats. Or consider quarterly reports - use the pie chart variants to apportion budget spends, justifying reallocations with crystal-clear visuals that preempt questions.
For educators in PR courses or workshop leaders, these charts demystify analytics; a simple bar graph can illustrate the AIDA model in action, from awareness spikes to action conversions. And for solo consultants? Streamline client deliverables with pre-formatted sections that plug-and-play your bespoke insights. We've seen teams at boutique firms like Peppercomm leverage similar setups to secure multimillion-dollar retainers, proving that well-visualized data isn't just informative - it's persuasive.
- Step 1: Import Your Data – Copy-paste from Excel into our smart placeholders; auto-formatting handles the rest.
- Step 2: Customize Visually – Adjust hues via theme colors for instant brand sync, or experiment with gradients for a modern edge.
- Step 3: Animate & Refine – Add entrance effects to charts, ensuring your narrative unfolds like a well-scripted press event.
- Step 4: Export & Share – Seamless PDF or PPTX output, ready for virtual meetings or printed handouts.
This workflow isn't theory - it's battle-tested, reducing prep time by up to 70% according to design pros who've ditched scratch builds.
Why This Template Outshines Basic PowerPoint Tools
Stock PowerPoint charts? They're functional, sure, but about as exciting as a boilerplate press release. Our PR template elevates with purpose-built elements: responsive layouts that hold up on any screen size, from laptop pitches to jumbotron keynotes. Plus, LSI-rich integrations like "media relations dashboards" and "crisis communication timelines" ensure your slides aren't just seen - they're searched and shared.
Compare the two: Basic tools demand manual alignment and color matching, often resulting in misaligned axes or clashing palettes. Here, smart guides and preset themes handle the heavy lifting, freeing you for strategic tweaks. And for accessibility? Built-in alt text prompts and high-contrast options align with WCAG standards, making your presentations inclusive and professional.
Pro Tips for PR Powerhouse Presentations
To maximize impact, layer in storytelling arcs - start with a broad pie chart overview, zoom into bar details for proof points, then close with a forward-looking hybrid chart blending past wins and projected reach. Pair with subtle humor: "Our coverage pie is sweeter than last quarter's - fewer sour notes!" This blend of data and wit keeps audiences hooked.
Integrate with tools like Google Analytics exports or Meltwater reports for real-time flair. For AIA-level polish (think PR's equivalent in structured excellence), ensure every chart cites sources via footnotes, building trust slide by slide.
As a PR veteran with over a decade shaping narratives for global brands, I've witnessed how visuals like these bridge the gap between numbers and buy-in. Don't settle for slides that inform - craft ones that inspire action.
Ready to Amplify Your PR Game? Download Today
Why wait for the next deadline crunch? Secure your PR PowerPoint Charts Template now and start scripting successes that resonate. With instant access and unlimited edits, it's the investment that pays dividends in closed deals and rave reviews. Elevate your pitches - download now and let your data do the talking.
Frequently Asked Questions
How editable are the charts in this PR PowerPoint template?
All 24 slides are 100% editable, from data inputs to visual styles, ensuring seamless adaptation to your PR needs.
Is this template compatible with Google Slides?
Yes, it works perfectly in Google Slides, maintaining all animations and layouts for collaborative editing.
Can I use these charts for client-facing reports?
Absolutely - branded and professional, they're ideal for proposals, with easy export to PDF for polished handouts.
What file formats are included?
Download in .PPTX for PowerPoint, with JPG previews for quick shares.
Does it include icons specific to PR?
Yes, featuring media, social, and strategy icons to enhance relevance.
How does this help with stakeholder presentations?
By visualizing ROI and impacts clearly, it builds compelling cases that drive approvals and funding.