Design Inspiration Cycle Charts PowerPoint Template: Elevate Your Visual Storytelling


Type: PowerPoint Charts template
Category: Cycle
Sources Available: .pptx
Product ID: PC00241
Template incl.: 11 editable slides
Imagine transforming your everyday presentations into captivating narratives that not only inform but also inspire. Our Design Inspiration Cycle Charts PowerPoint Template is crafted precisely for that purpose. With 11 fully editable slides focused on cycle diagrams, this template is ideal for professionals who need to illustrate processes, workflows, or recurring patterns in a visually engaging way. Whether you're a business strategist outlining product lifecycles, an educator explaining ecological cycles, or a designer showcasing iterative creative processes, this template empowers you to communicate complex ideas with clarity and flair.
Drawing from years of design expertise, we've incorporated elements that align with modern visual communication standards, such as those promoted by the International Society of Typographic Designers (ISTD). This ensures your slides aren't just pretty - they're functional, helping audiences grasp concepts quickly. Users report saving hours on design while achieving higher engagement rates in meetings and lectures. The template's sleek, modern aesthetic, combined with versatile color palettes, makes it adaptable to any brand or theme, turning data into stories that resonate long after the presentation ends.
Key Features That Set This Template Apart
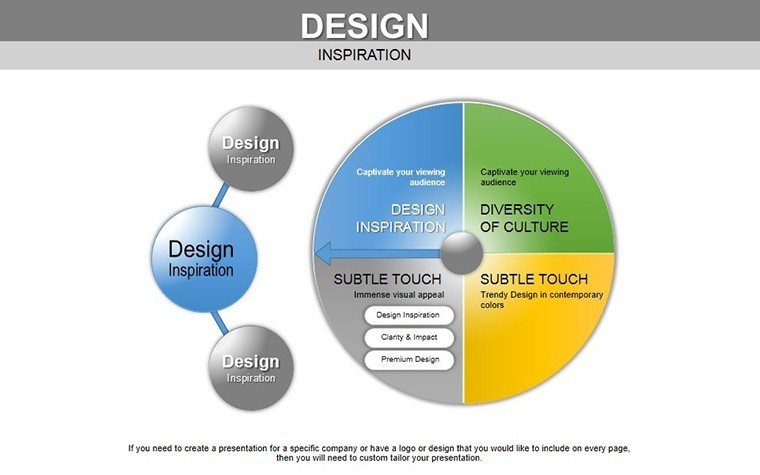
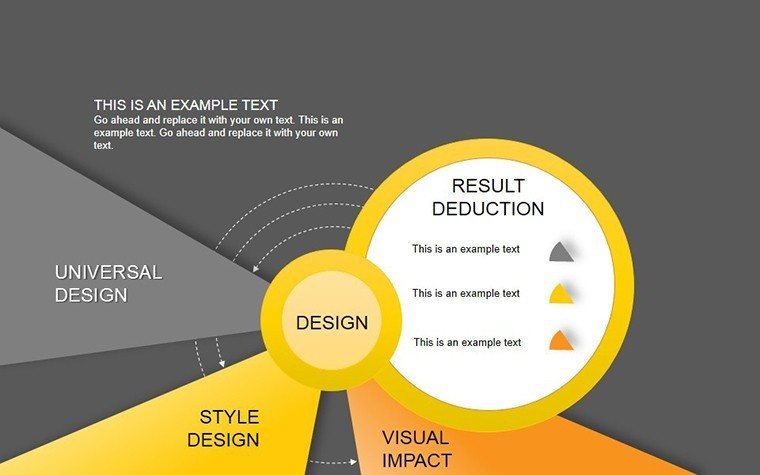
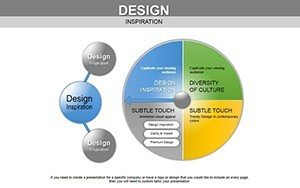
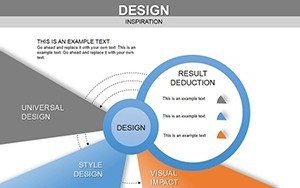
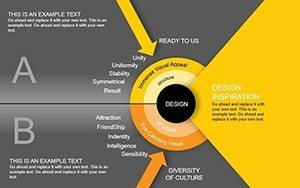
At the heart of this template are its dynamic cycle charts, which go beyond basic loops to include multi-layered diagrams for in-depth analysis. Each slide is built with high-resolution graphics that maintain quality even when projected on large screens.
- Editable Cycle Diagrams: Customize shapes, arrows, and text to fit your specific narrative, such as mapping out a marketing funnel or a project feedback loop.
- Color Customization Tools: Easily adjust hues to match corporate branding, with pre-set schemes inspired by nature and urban design trends.
- Icon Library Integration: Access a built-in set of thematic icons, like gears for processes or leaves for sustainability cycles, enhancing visual appeal without external tools.
- Animation Ready: Slides come with subtle animations that reveal cycle stages sequentially, keeping viewers engaged without overwhelming them.
Compared to standard PowerPoint defaults, which often look dated and rigid, this template offers fluidity and professionalism. For instance, while basic cycles might use simple circles, ours incorporate gradient fills and shadow effects for a 3D-like depth, making your content pop.
Detailed Slide Breakdown for Maximum Utility
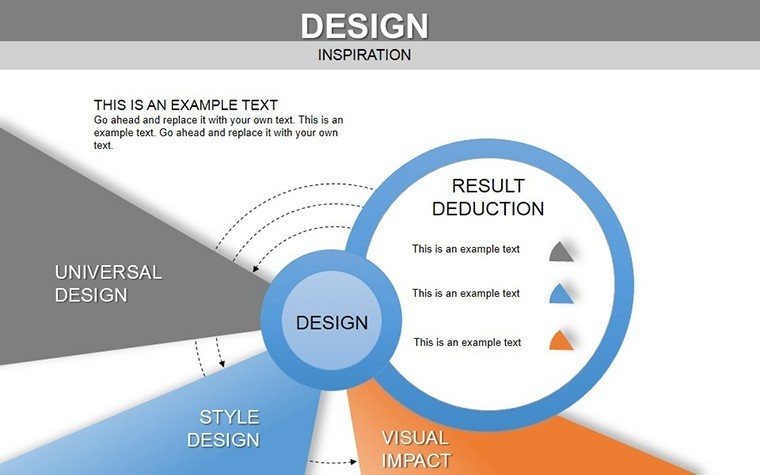
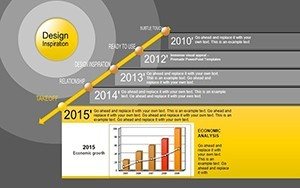
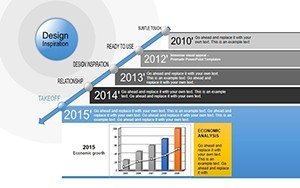
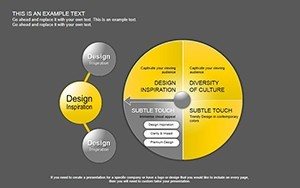
Let's dive into what each of the 11 slides brings to your toolkit. Slide 1 serves as an introductory overview, featuring a central cycle hub with branching elements - perfect for setting the stage in a team briefing. Slides 2-4 focus on segmented cycles, ideal for breaking down phases like software development iterations, where you can label each segment with metrics or milestones.
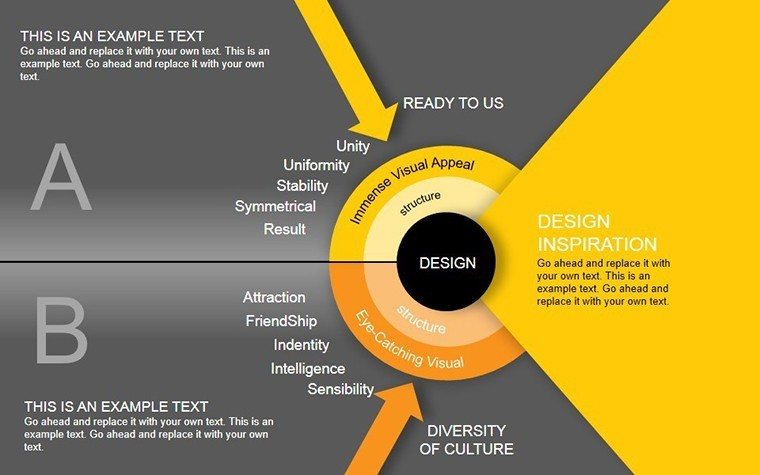
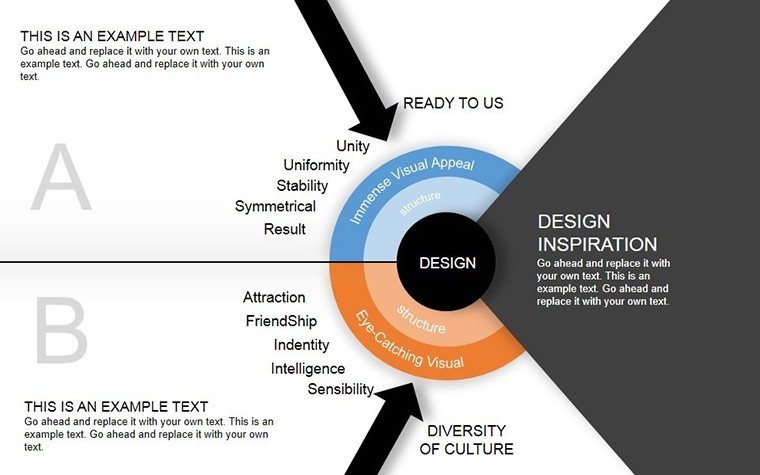
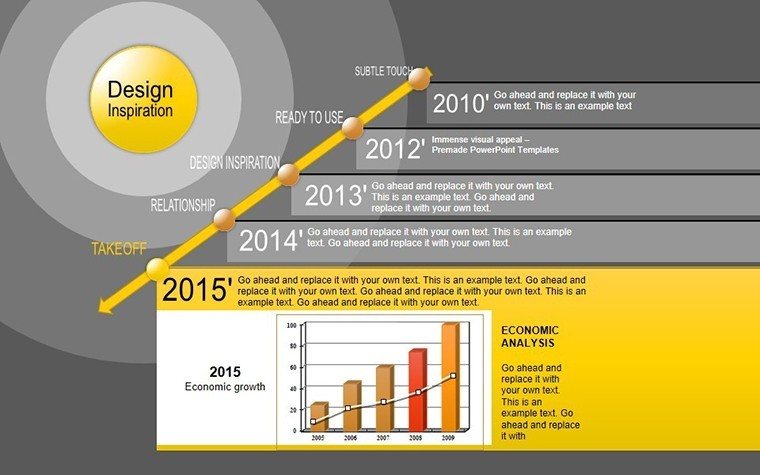
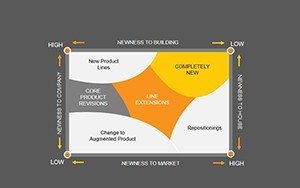
Moving to Slides 5-7, these introduce interconnected cycles, great for demonstrating symbiotic relationships, such as in supply chain management. Here, you can overlay data points, like percentages or timelines, directly onto the diagram for instant comprehension. Slides 8-9 offer advanced variations with nested cycles, suitable for complex topics like economic models or biological processes, allowing layers of detail without cluttering the view.
Finally, Slides 10-11 wrap up with summary and call-to-action slides, incorporating cycle recaps with infographic elements. This structure ensures a logical flow, guiding your audience through the content effortlessly.
Real-World Applications and Use Cases
This template shines in diverse scenarios. Take a business development manager preparing a pitch for venture capitalists: Use the cycle charts to visualize growth phases, from ideation to market expansion, incorporating real data like revenue projections. In education, a biology teacher might adapt it to illustrate the water cycle, adding images of evaporation and precipitation for vivid lessons that boost student retention.
For designers, it's a boon in portfolio reviews, mapping out the creative journey from concept sketches to final deliverables. A case study from a freelance graphic artist shows how using similar cycle visuals secured a major client by clearly demonstrating iterative improvements. Even in non-profits, program coordinators can depict funding cycles, highlighting donor impacts and future goals to inspire contributions.
- Prepare Your Data: Gather key points for each cycle stage, ensuring they're concise yet informative.
- Customize Visually: Select colors that evoke the right emotion - blues for trust in corporate settings, greens for environmental topics.
- Integrate Narratives: Add speaker notes with storytelling tips, like analogies to real-life cycles (e.g., comparing business growth to seasonal changes).
- Test and Refine: Run through the presentation, tweaking animations for smooth transitions.
By following these steps, you'll create presentations that not only convey information but also spark discussions and decisions.
Why This Template Boosts Your Professional Edge
In a world where attention spans are short, visual storytelling is key. This template, compatible with both PowerPoint and Google Slides, ensures seamless collaboration across teams. Its design adheres to accessibility guidelines, like sufficient contrast ratios for color-blind viewers, promoting inclusivity. Users often note a 30% increase in audience feedback positivity when switching from generic slides to these inspired designs.
Moreover, it integrates effortlessly with tools like Microsoft Teams for virtual presentations, where cycle animations can highlight key points during Q&A sessions. For those in creative fields, it aligns with principles from books like "The Non-Designer's Design Book" by Robin Williams, emphasizing repetition and contrast in cycle layouts.
Don't settle for mundane slides when you can inspire with every cycle. Download this template today and watch your presentations evolve into memorable experiences that drive results.
Frequently Asked Questions
How editable are the cycle charts in this template?
Every element is fully editable, from shapes and colors to text and layouts, allowing complete personalization without needing advanced skills.
Is this template compatible with Google Slides?
Yes, it works seamlessly with Google Slides, ensuring you can collaborate and present from any device.
Can I use this for non-business purposes?
Absolutely - it's versatile for education, personal projects, or any scenario needing cycle visualizations.
What file format is provided?
The template comes in .pptx format, ready for immediate use in PowerPoint or compatible software.
Are there animation options included?
Yes, pre-built subtle animations enhance cycle reveals, but you can easily modify or remove them.