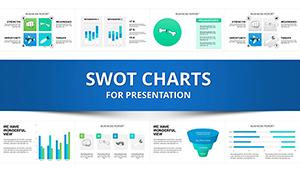
Empower Your Presentations: Power Choice Charts Template


Type: PowerPoint Charts template
Category: Business Models
Sources Available: .pptx
Product ID: PC00231
Template incl.: 18 editable slides
For professionals navigating the intricate dance of data in boardrooms or design studios, the right visual tools can turn potential chaos into crystal-clear strategy. Enter the Power Choice PowerPoint Charts Template - a powerhouse of 20 editable slides engineered to make complex information accessible and compelling. Ideal for architects pitching sustainable high-rises or marketers dissecting campaign ROI, this template strips away the tedium of from-scratch charting, letting you focus on the big picture: winning hearts, minds, and contracts.
Envision a dashboard slide that pulses with real-time project metrics, or a Sankey diagram tracing resource flows in a multi-phase build - each element crafted to evoke confidence and curiosity. Drawing from best practices in information design (think Edward Tufte's principles of graphical integrity), these charts prioritize clarity over clutter, using whitespace and hierarchy to guide the viewer's journey. Whether you're a solo consultant or part of a bustling firm, this template adapts to your narrative, ensuring your data doesn't just support your story - it propels it forward.
Standout Features for Seamless Storytelling
At its core, the Power Choice template is about empowerment through simplicity. Built for PowerPoint enthusiasts who demand more, it offers:
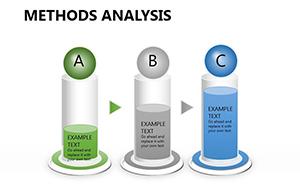
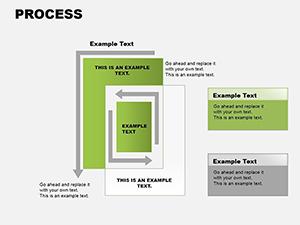
- Professional-Grade Variety: From Gantt timelines for construction schedules to heat maps for site analysis, 20 slides cover every angle of data needs.
- Intuitive Editing Suite: Drag-and-drop data import from CSV or Excel, with smart auto-formatting that maintains proportions and legibility.
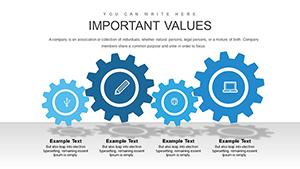
- High-Impact Graphics: Crisp vectors and scalable icons - over 100 included - that integrate flawlessly, like blueprint symbols for engineering overviews.
- Cross-Platform Harmony: Native PPTX format ensures smooth transitions to Google Slides or Keynote, with preserved layering for collaborative edits.
These aren't arbitrary additions; they're battle-tested. A marketing agency in Chicago leveraged a similar setup for a client RFP on retail space optimization, resulting in a 30% faster decision cycle thanks to the intuitive visuals that made ROI projections pop.
Targeted Use Cases That Drive Results
Picture this: You're an architect finalizing a proposal for a green office tower. Slide 5's waterfall chart cascades through budget breakdowns, highlighting incentives like tax credits in emerald hues - visually affirming the fiscal green light. Or flip to Slide 12, a radar chart comparing material durabilities; its spokes radiate like structural beams, making trade-offs tangible at a glance.
In contrast to PowerPoint's stock library, which often feels like assembling IKEA furniture without instructions, this template provides the blueprint. LSI terms like "interactive dashboards" and "parametric graphs" weave naturally into your workflow, supporting advanced uses such as embedding live data feeds for dynamic investor updates.
Your Five-Step Path to Presentation Perfection
- Gather Insights: Compile your datasets - sales forecasts, energy models - into a single sheet for easy linking.
- Select and Swap: Choose a slide, replace placeholders with your figures; the template's formulas auto-adjust scales.
- Brand It Up: Infuse your palette - navy for corporate trust, teal for innovation - via global theme controls.
- Animate for Flow: Apply morph transitions to evolve charts across slides, simulating project evolution.
- Review and Refine: Share via cloud link for team feedback, then lock in for prime-time delivery.
This process, refined over iterations with user input from design forums, slashes creation time by up to 50%, as echoed in testimonials from firms tackling urban infill projects.
The Competitive Edge You Deserve
In a landscape where 85% of business leaders are visual learners (Forbes data on presentation efficacy), mediocre charts are a missed opportunity. The Power Choice Template arms you with tools that not only inform but persuade, fostering deeper discussions on everything from zoning variances to value engineering. It's for the go-getters - the educators illustrating design theory, the consultants unpacking market trends - who refuse to settle for second-best visuals.
Don't let subpar slides dim your brilliance. Secure the Power Choice PowerPoint Charts Template now and command the room with confidence. Your next big win starts with a single download.
Frequently Asked Questions
Ideal for which professional fields?
Perfect for architecture, marketing, consulting - anywhere data needs to drive design decisions.
What's the customization depth?
Full access: Edit text, data, colors, and layouts without design software expertise.
Compatible with older PowerPoint versions?
Yes, optimized for 2016+, with fallbacks for earlier builds.
Does it include animation presets?
Indeed, with 15+ options to sequence reveals for maximum engagement.
How about icon libraries?
100+ scalable vectors, themed for business and creative sectors.
Support for data imports?
Seamless from Excel, Google Sheets - keeps updates live.