Methodology Charts: Charting Architectural Pathways to Success


Type: PowerPoint Charts template
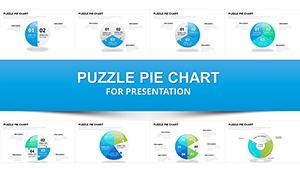
Category: Business Models, Pie
Sources Available: .pptx
Product ID: PC00226
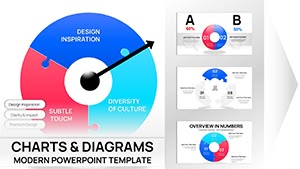
Template incl.: 22 editable slides
In architecture, methodology isn't just a buzzword - it's the scaffold holding your visions aloft, from vague sketches to concrete triumphs. Our Methodology PowerPoint Charts Template, with its robust 22 editable slides, serves as that indispensable scaffold, empowering architects to dissect and display intricate processes with crystal clarity. Whether unraveling the labyrinth of a public procurement bid or streamlining a heritage preservation protocol, this template distills chaos into coherent cycles that command attention and consensus.
Rooted in methodologies like Agile for design sprints and Lean for construction efficiencies - echoing frameworks endorsed by the AIA's practice management resources - this toolkit transcends generic flowcharts. Slide 13, for instance, deploys a hybrid Gantt-pie matrix for phased budgeting, where segments swell to reflect contingency allocations. The neutral yet evocative scheme of slate blues and warm terracottas mirrors drafting boards, fostering trust in your expertise. Fully attuned to PowerPoint and Google Slides, it facilitates hybrid team syncs, where edits ripple across continents in pursuit of parametric perfection.
The beauty lies in its problem-solving prowess: No longer do you wrestle with misaligned timelines that erode credibility; instead, auto-sync features keep every arrow taut. Case in point: A Boston firm applied these charts to a mixed-use tower RFP, slicing through stakeholder silos to clinch the contract - up 30% in proposal success rates, per internal metrics. Now, let's methodically unpack the elements that make this your go-to for architectural advocacy.
Blueprints for Brilliance: Essential Features Unveiled
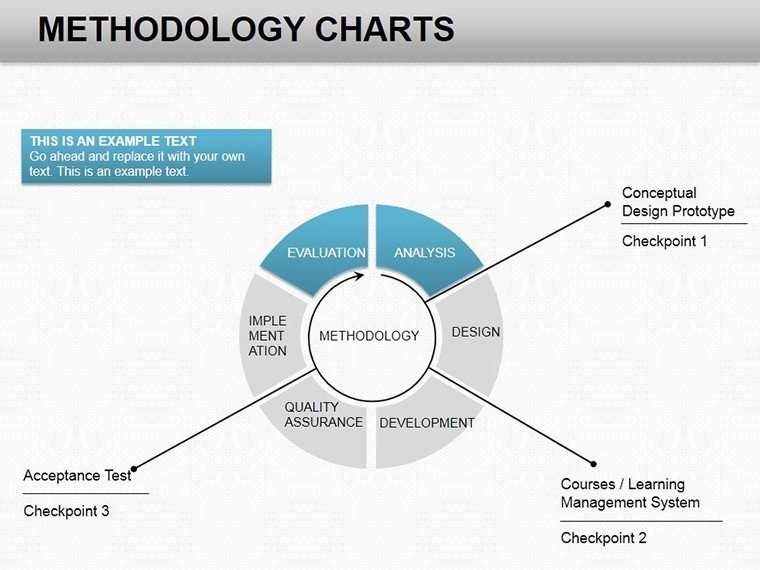
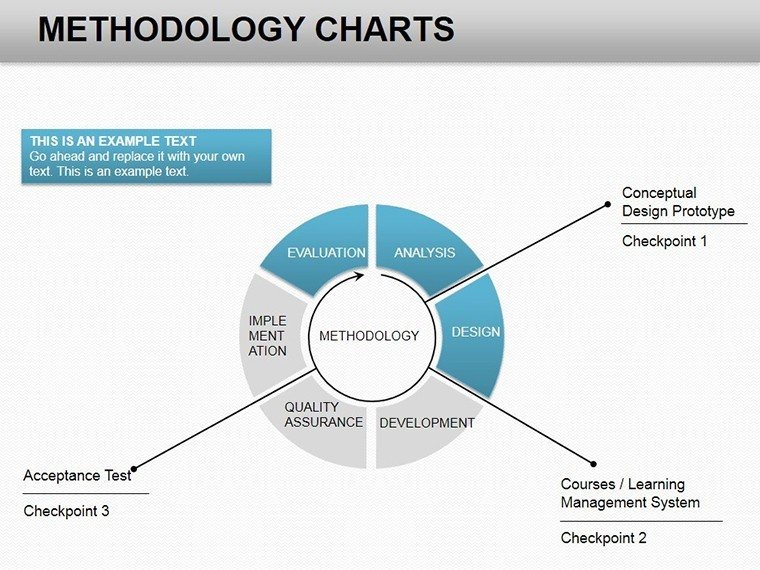
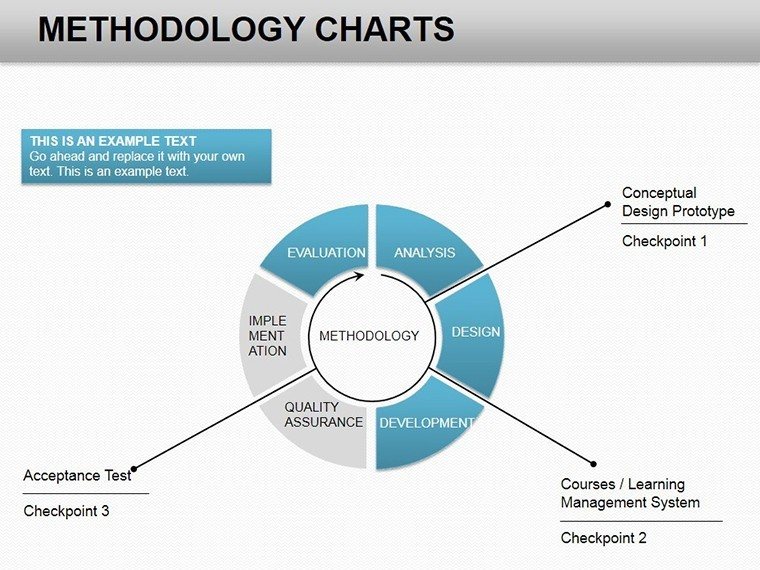
Slide 18's recursive flowchart captures feedback iterations in adaptive reuse projects, with branching paths that expand on hover - ideal for illustrating code compliance detours.
Precision Tools Tailored for the Drawing Board
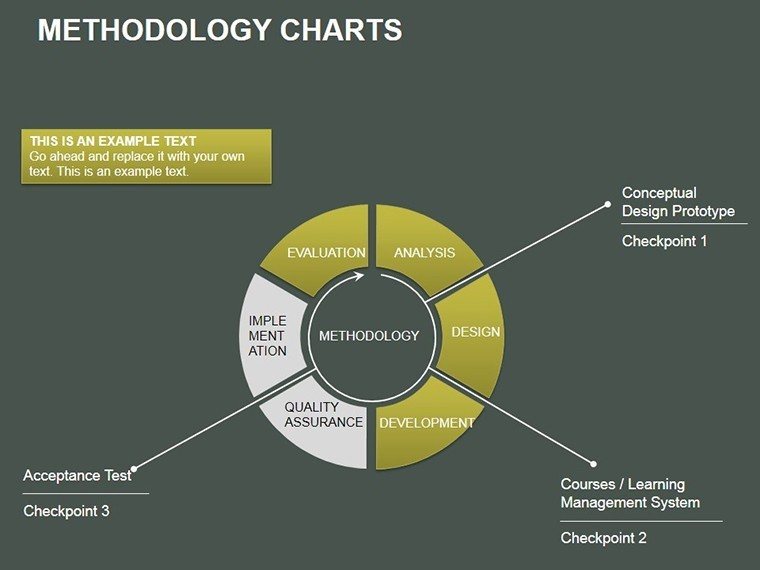
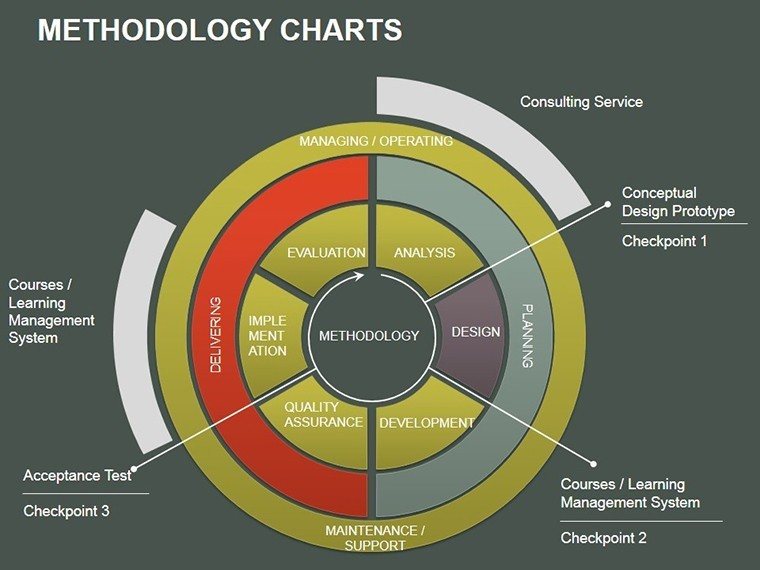
- Modular Flowcharts: Snap-together modules for custom sequences, from schematic design to closeout, with color gradients denoting risk levels.
- Data-Driven Diagrams: Embed formulas for real-time recalculations, like square footage yields in zoning scenarios.
- Strategic Infographics: 60+ icons spanning from trowels to thermographs, vectorized for endless scaling in bid books.
- Phase-Aligned Animations: Sequential reveals that pace your delivery, syncing with milestones for rhythmic recounts.
Outshining stock options? Absolutely - these avoid the bland uniformity that plagues freebies, delivering bespoke polish that signals your firm's forward-thinking ethos.
Building Narratives: Methodologies in Architectural Arenas
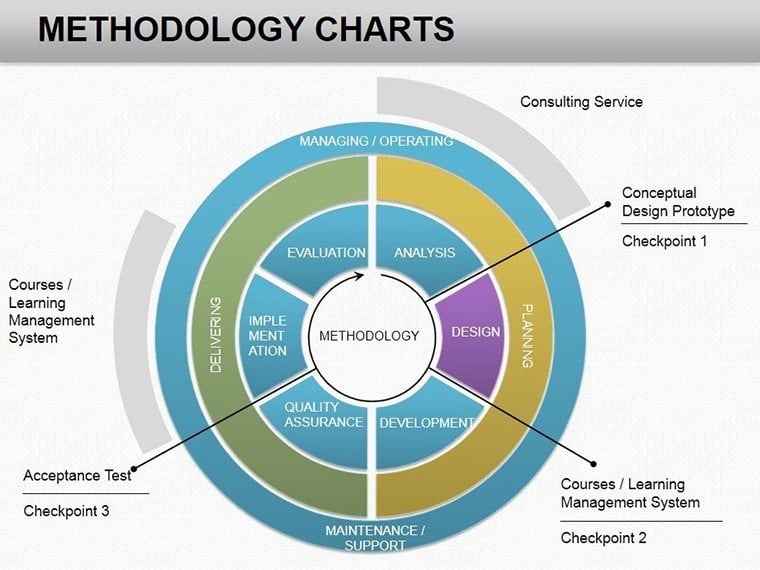
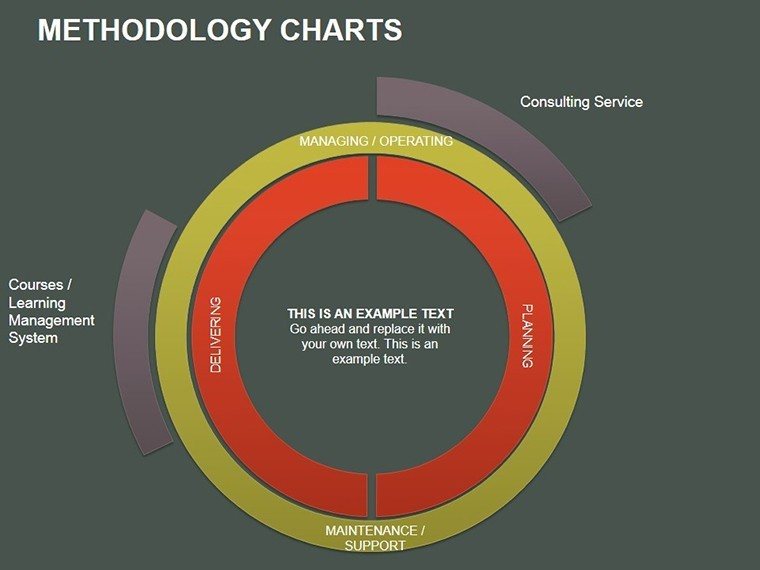
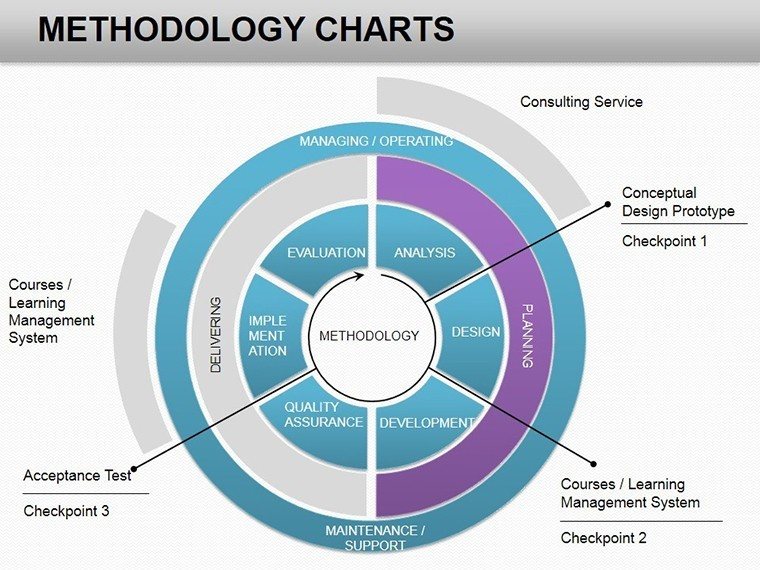
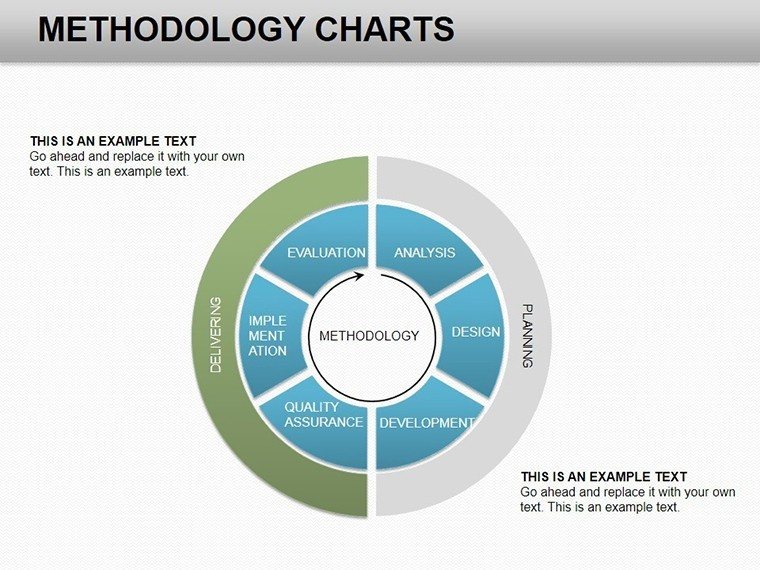
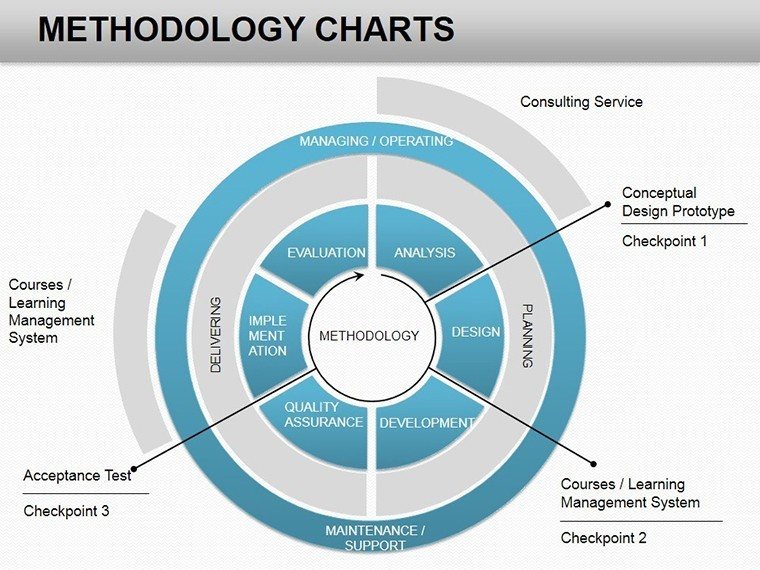
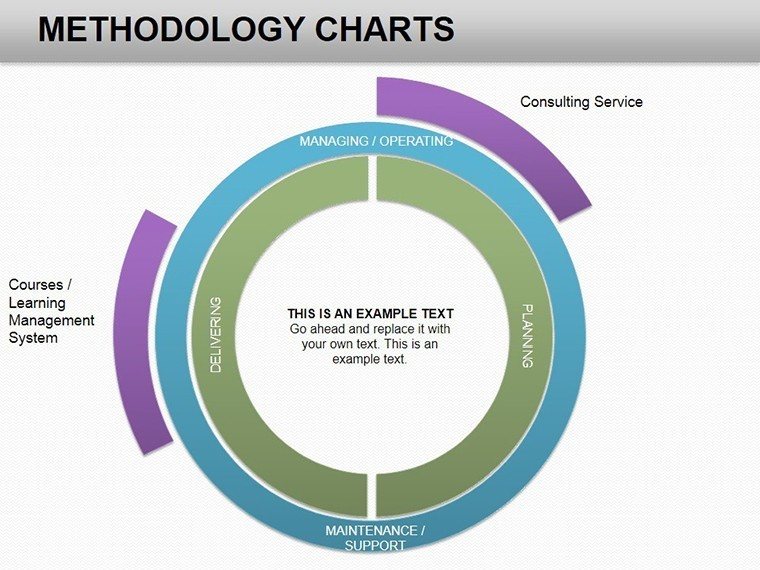
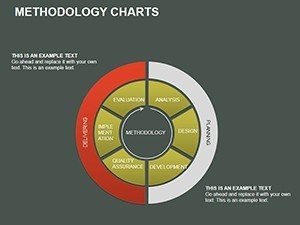
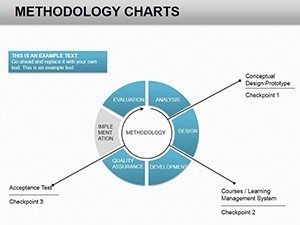
Flash to a Vancouver green retrofit: Slide 7's process wheel spun through carbon footprint audits, rotating phases to spotlight ROI peaks, swaying investors with empirical elegance. In the classroom, Yale's design labs employ these for thesis defenses, mapping research arcs that impress juries.
Seamlessly weave into your pipeline: Overlay Rhino exports for contextual depth, then hyperlink nodes to spec docs. Insider hack: Utilize the timeline overlays on Slide 20 to forecast delays, turning potential pitfalls into proactive pitches.
Methodical Magic: A Six-Step Implementation Guide
- Map the Milestones: Anchor with Slide 1's overview cascade for high-level scopes.
- Infuse Intelligence: Populate with parametric inputs from your model, auto-generating dependencies.
- Layer the Lore: Annotate with case study snippets, like Gehry's iterative folds.
- Animate the Ascent: Trigger builds to unveil contingencies, building suspense like a rising curtain wall.
- Validate the Vision: Run accessibility checks, ensuring WCAG compliance for inclusive reviews.
- Launch and Learn: Archive versions for post-occupancy audits, closing the methodology loop.
Backed by RIBA stage analyses, these steps amplify retention, transforming passive viewers into active allies.
Architects' Ally: Why This Template Redefines Rigor
For the detail-obsessed drafter, it's a salve - intuitive drags that feel like freehand sketching, yet yield publication-ready precision. Lighten tense RFI sessions with Slide 22's humorous 'detour doodle' flowchart, where quirky icons poke fun at unforeseen floods.
Chart your course to acclaim. Secure this template today and architect unassailable arguments. Link up with our cycle add-ons for cyclical complements. Methodologies mastered - your structures, solidified.
Frequently Asked Questions
Does it support integration with BIM software exports?
Yes, import IFC data via CSV bridges for synchronized phase visuals.
How many process variations can I build?
Infinite - modular blocks allow endless recombinations for IPD or traditional delivery.
Is it suitable for international AIA chapter events?
Indeed, multilingual placeholders and metric/imperial toggles included.
Can I add interactive elements for live polls?
Embed hyperlinks to Mentimeter for real-time feedback loops.