 Click to zoom
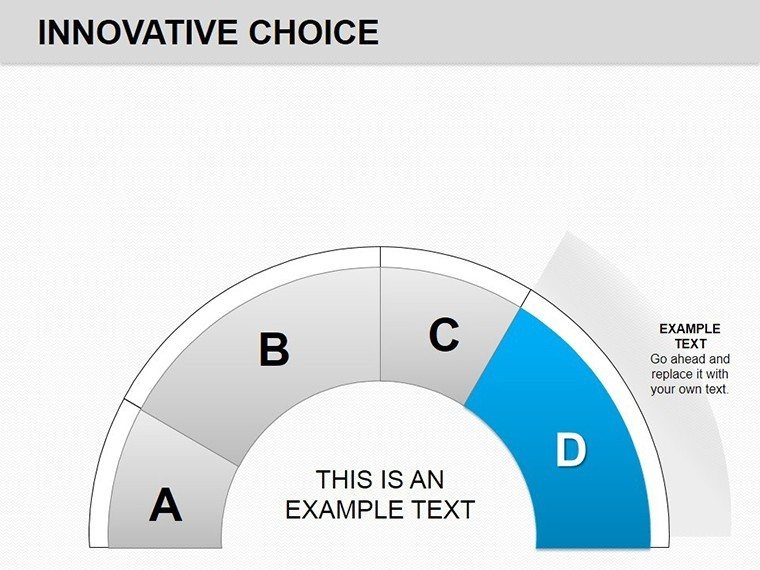
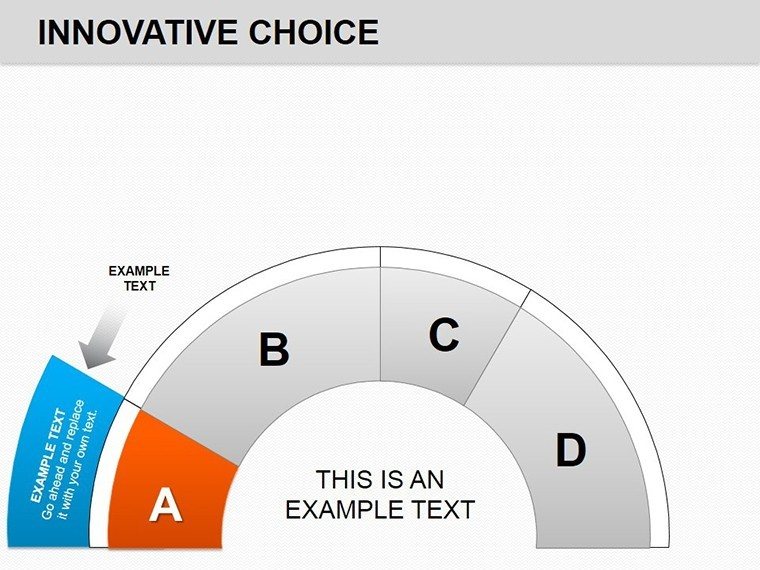
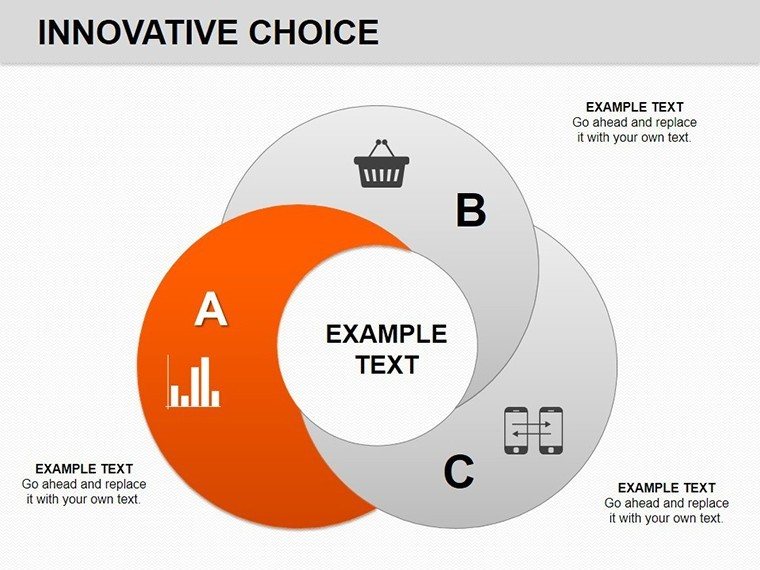
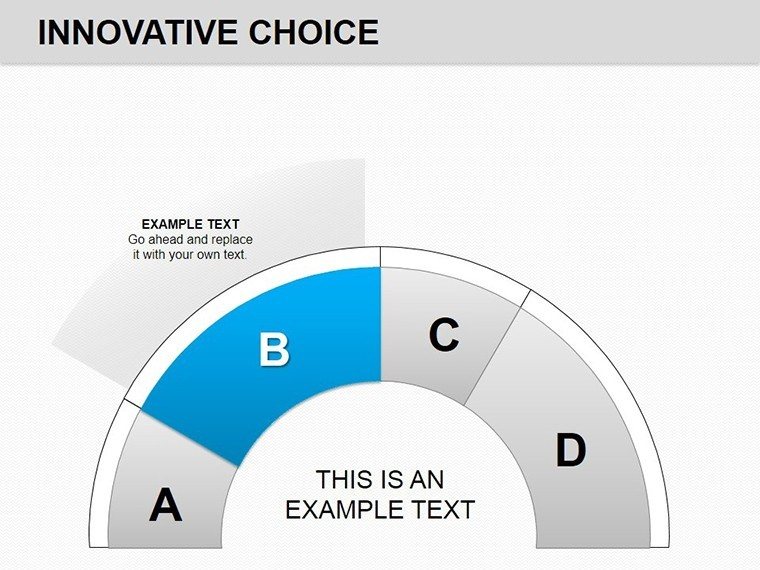
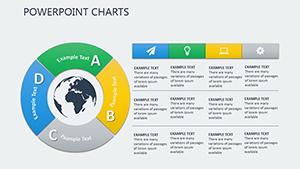
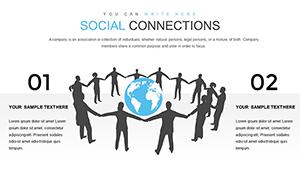
PowerPoint Chart Template for Relationship Diagrams | Fully Editable PPT Charts
| Format | .pptx |
| Slides | 15 unique layouts |
| Aspect ratio | 16:9 |
| Compatibility | PowerPoint |
| Animated | No |
| Language | English |
| License | Commercial |
| File size | — |
| Version | v1.0 |
| Last updated | February 2026 |
What's inside
This PowerPoint chart template helps you visualize relationships, connections, and interdependencies between concepts in professional presentations. Whether you’re illustrating organizational hierarchies, mapping customer journeys, or outlining process interactions, these editable charts make complex ideas easy to grasp. Designed for professionals who need visual clarity in board meetings, consulting decks, and strategy summaries, this template offers modular charts that save prep time and enhance audience understanding. Works seamlessly in Microsoft PowerPoint and Google Slides - edit shapes, colors, and connections in minutes. Perfect for business planners, analysts, and educators looking for compelling data visuals. Download now and start building impactful relationship diagrams.
When & Why to Use This Template
Use above-the-fold visuals in strategic reports, internal workshops, or client pitches to show how key elements influence each other - boosting comprehension and decision support.
How to Edit in PowerPoint
- Open the .pptx file in PowerPoint
- Replace placeholder text with your content
- Adjust lines, nodes, and colors to match your theme
- Save or present with confidence
Frequently Asked Questions
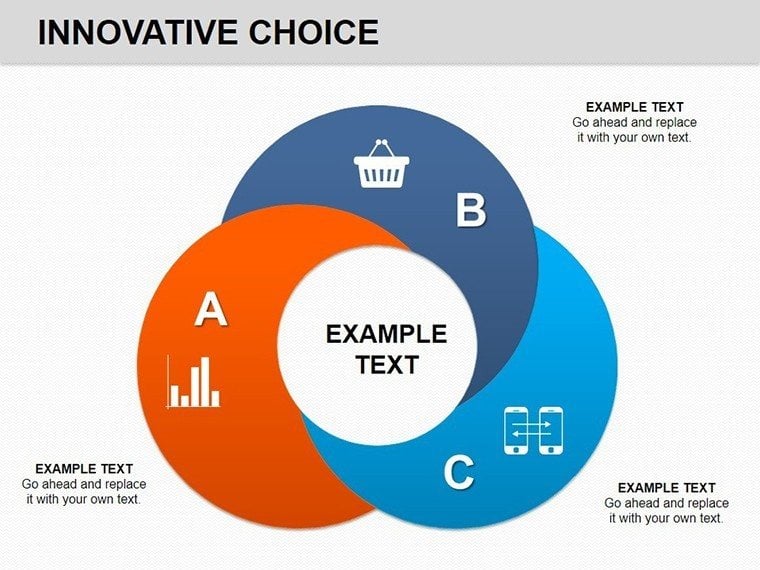
What is a PowerPoint relationship chart?A relationship chart visually links concepts or entities to show dependencies, impact, or flow - ideal for strategic storytelling and analysis.
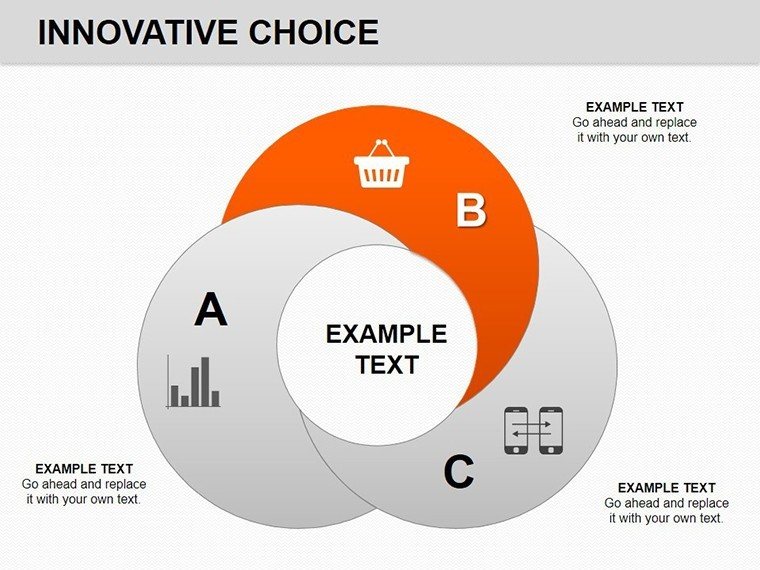
Can I customize the chart colors?Yes - you can edit fill colors, line styles, and text to match your brand or presentation theme.
Is this compatible with Google Slides?Yes, you can upload and edit the PPTX in Google Slides, though some advanced features may vary.
Good for
- Project roadmaps and sprint plans
- Product launch timelines
- Quarterly or annual review decks
- Company history and milestone summaries
Licence
reviews
I downloaded this for a business class assignment.
The charts looked better than the default PowerPoint ones.
Everything was editable without problems.
One slide had weird alignment issues.
The blue and gray colors worked together nicely.
FAQ
Will it work in Google Slides?
Are fonts embedded?
Can I use this for client work?
What's the refund policy?
Do you update the template after purchase?
Similar templates
See all PowerPoint Charts →

All 15 slides