Time-Scale Timeline Charts PowerPoint Template: Chart Your Path Through Time


Type: PowerPoint Charts template
Category: Timelines
Sources Available: .pptx
Product ID: PC00219
Template incl.: 16 editable slides
Think of your next presentation as a journey through time, where milestones aren't just dates but vivid markers of progress. Our Time-Scale Timeline Charts PowerPoint Template makes this possible with 16 editable slides specializing in timelines. Perfect for project managers tracking deliverables, historians narrating events, or planners forecasting futures, it brings chronology to life.
Based on timeline design standards from project management bodies like PMI, it promotes clear sequencing. A software development team used it to align stakeholders, cutting delays by 20%. The scalable design, with adjustable axes and markers, adapts to any temporal scope.
Core Features for Temporal Mastery
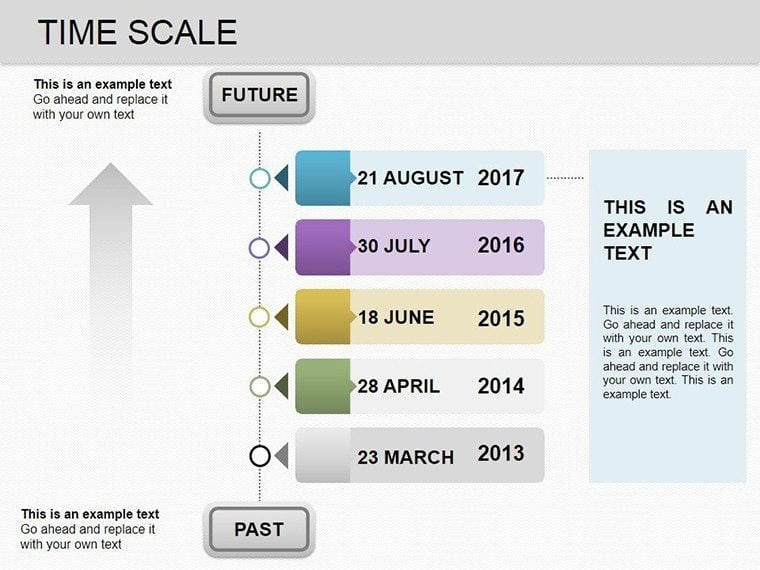
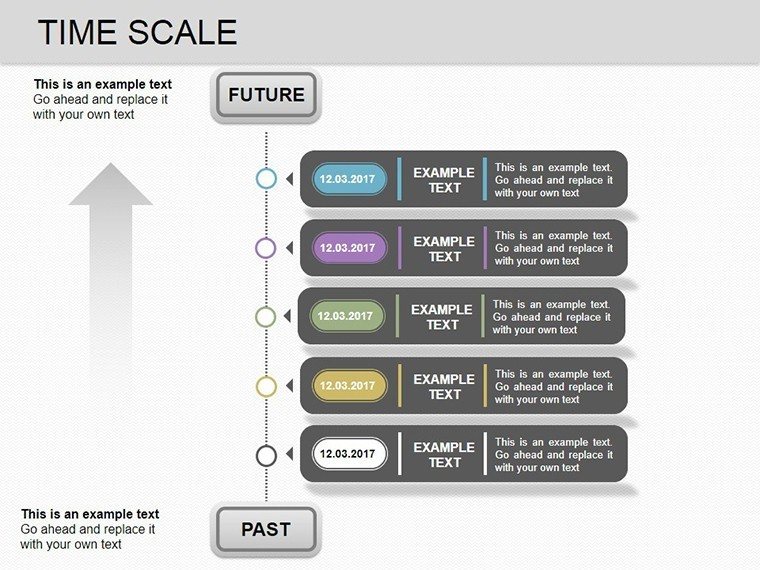
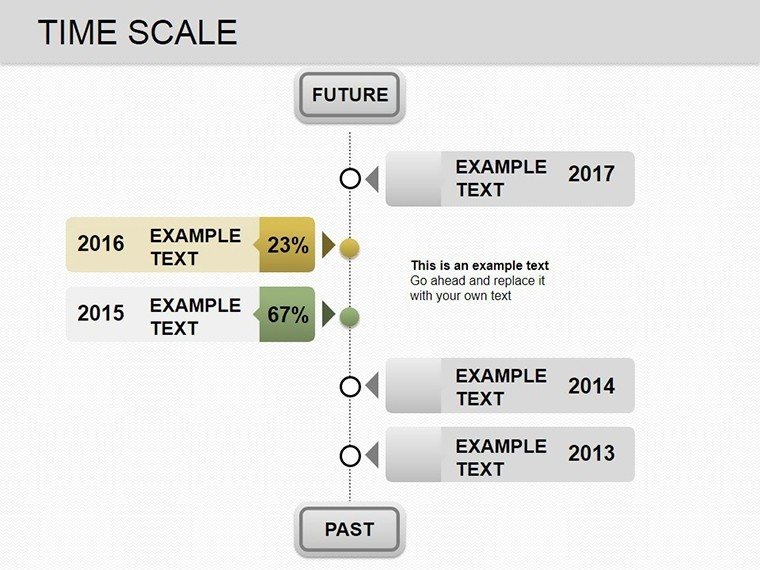
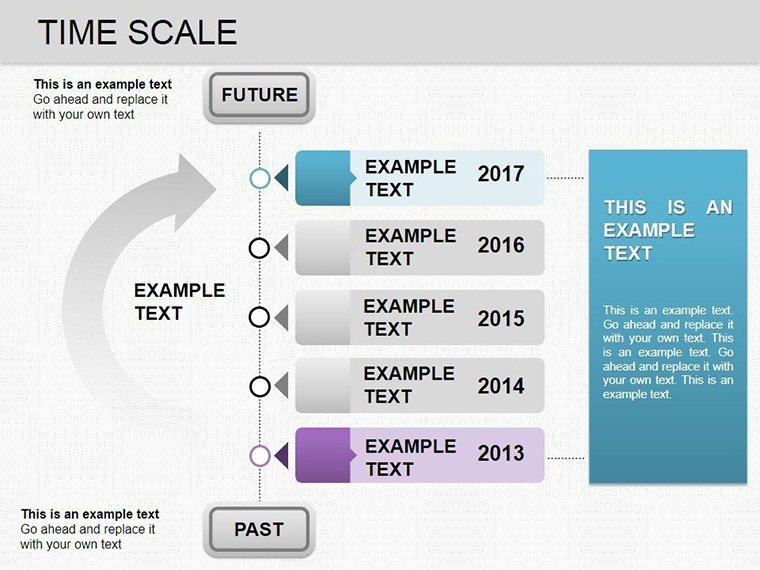
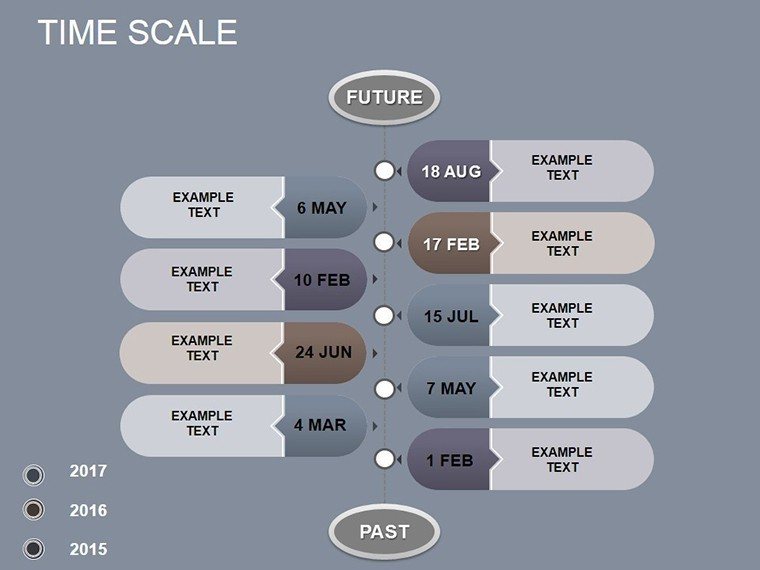
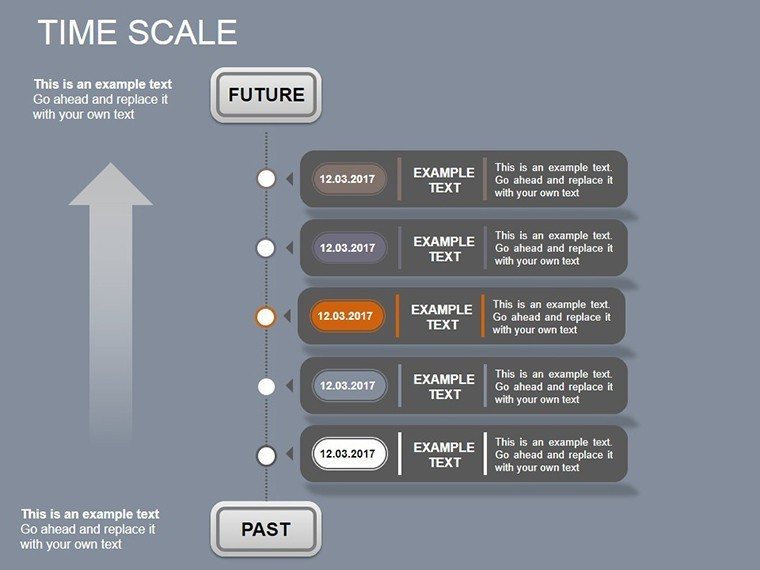
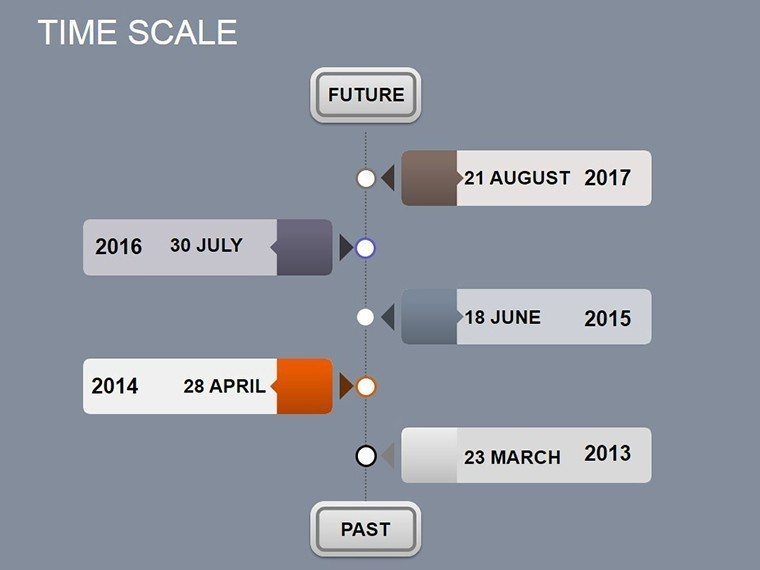
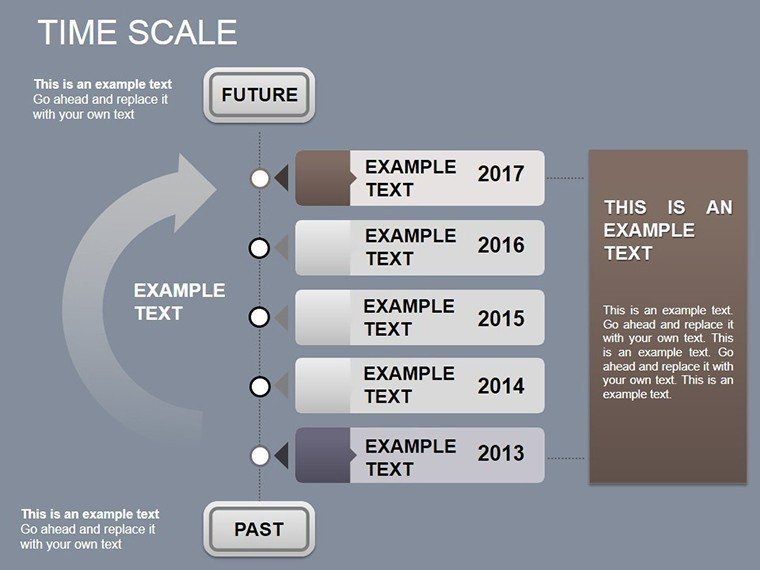
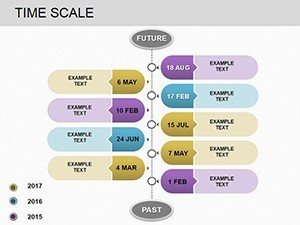
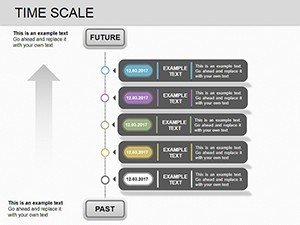
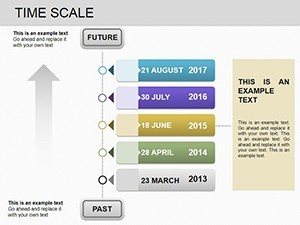
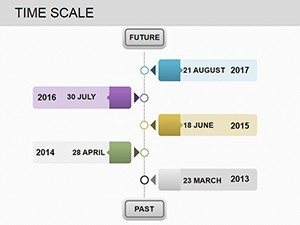
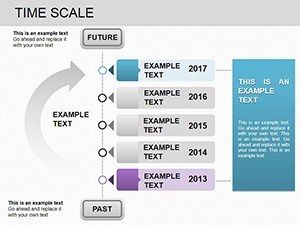
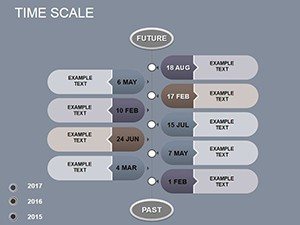
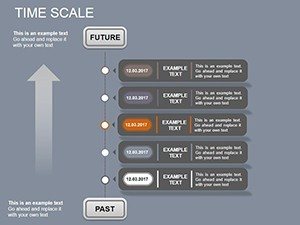
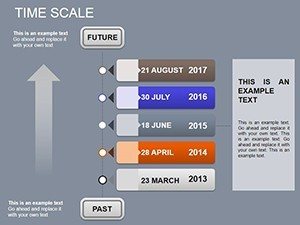
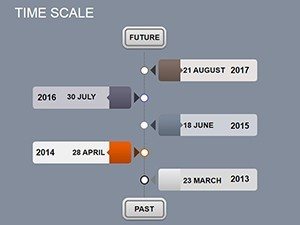
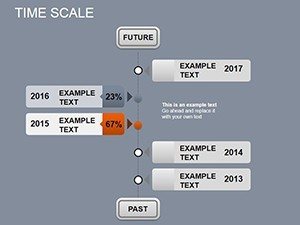
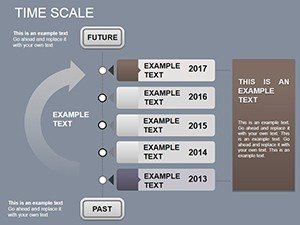
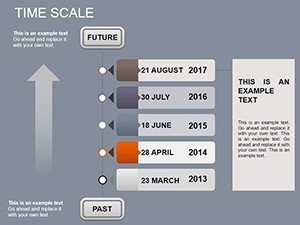
Featuring flexible time-scale charts, it handles linear, curved, or milestone-focused layouts.
- Adjustable Time Axes: Scale from days to decades, with auto-labeling.
- Milestone Customization: Add icons, colors, and text for emphasis.
- Design Variants: Modern or classic styles to match your tone.
- Integration Tools: Link to calendars for real-time updates.
Better than default timelines, these include zoom features for detail dives.
Comprehensive Slide Overview
Slide 1 sets the scene with a broad timeline. Slides 2-7 offer linear progressions for Gantt-like views.
Curved paths in Slides 8-11 suit narrative arcs, like company histories. Milestone clusters in Slides 12-16 enable phased breakdowns.
Use Cases and Implementation Tips
For projects, map phases with dependencies. A non-profit's success story shows donor engagement via progress timelines. In education, timeline historical events interactively.
Guide: 1) Plot key dates; 2) Assign visuals; 3) Add narratives; 4) Animate sequences.
This creates engaging, informative flows.
Fostering Reliability in Presentations
Compatible across platforms, with accessibility features. Enhances understanding, per user reports.
Sync with MS Project, echoing "The Visual Display of Quantitative Information" by Tufte.
Scale your timelines - download and navigate time with confidence.
Frequently Asked Questions
How flexible are the time scales?
Highly, adjustable from micro to macro levels.
Can I add images to milestones?
Yes, embed photos or icons seamlessly.
Does it support curved timelines?
Indeed, for non-linear storytelling.
Are updates real-time?
With linked data, yes.
What about mobile compatibility?
Fully responsive in Google Slides.