Revolutionize Data Display with Panel Chart Collections


Type: PowerPoint Charts template
Category: Tables
Sources Available: .pptx
Product ID: PC00210
Template incl.: 14 editable slides
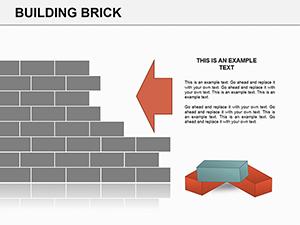
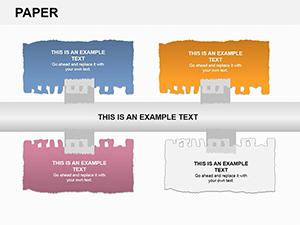
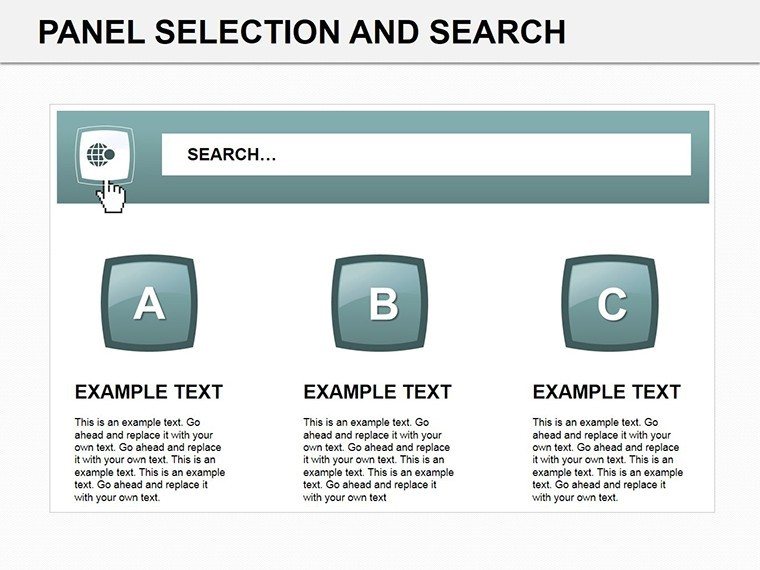
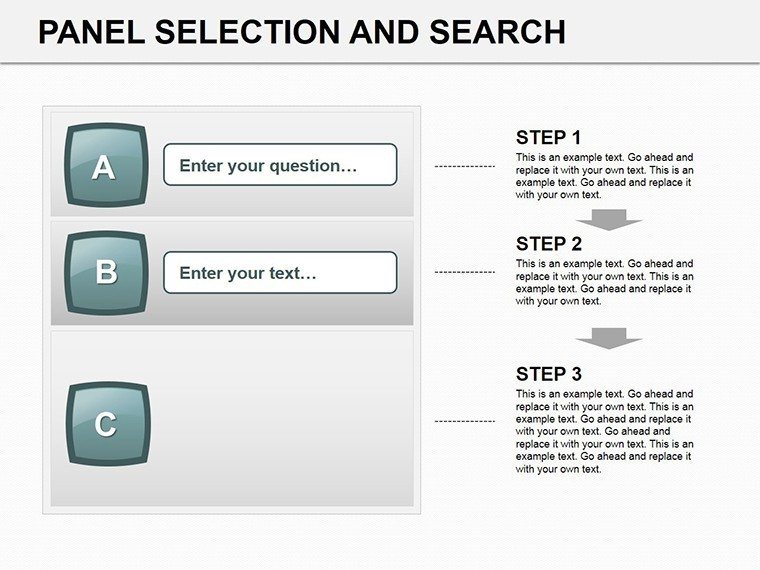
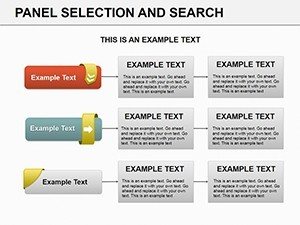
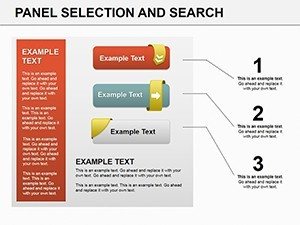
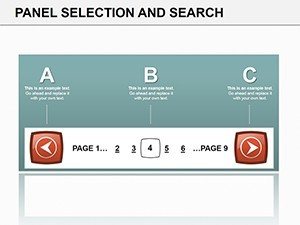
Ever struggled to fit multifaceted data into a single slide without overwhelming your audience? Our Panel Search PowerPoint Charts Template Collection changes the game, providing 14 versatile, editable slides that blend various chart types into cohesive panels. From bar graphs tracking construction budgets to Gantt charts outlining architectural timelines, this collection empowers architects, marketers, and teachers to present information with flair and precision. Designed for those who demand more than basic visuals, it turns raw data into persuasive stories that stick.
In architecture, where projects involve layers of planning, these panels allow you to juxtapose timelines with resource allocations, adhering to standards like those from the American Institute of Architects. Benefits abound: quicker audience comprehension, branded consistency, and the ability to highlight trends at a glance. Whether pitching a sustainable building design or teaching urban planning concepts, you'll find the tools to make your points pop.
Standout Features for Professional Polish
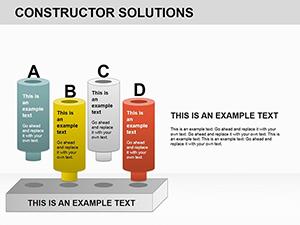
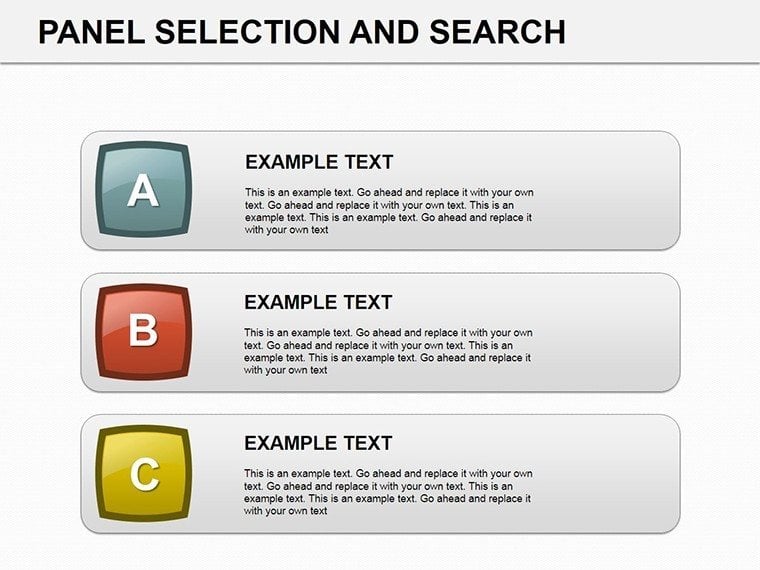
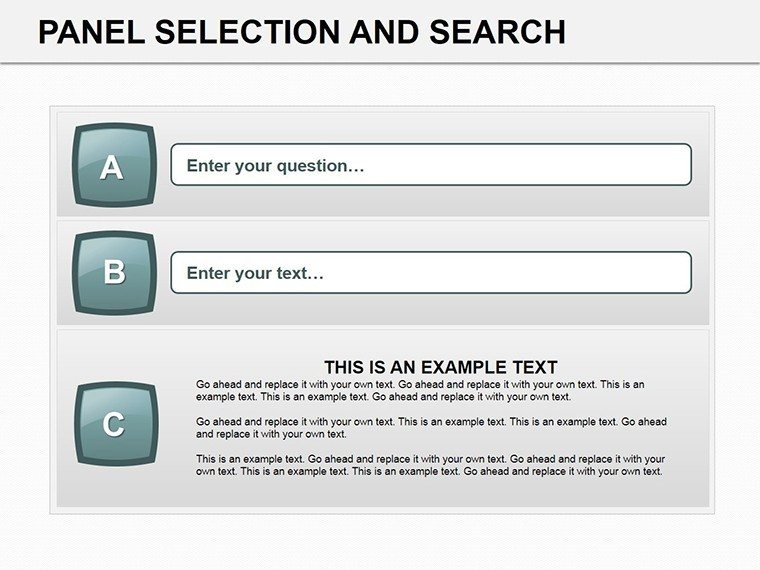
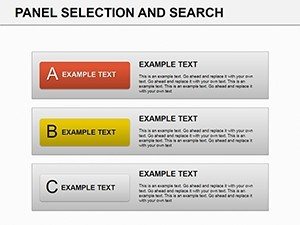
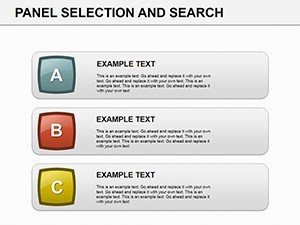
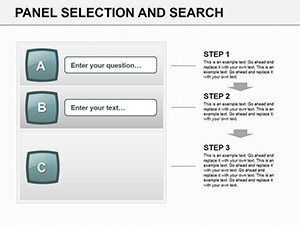
Each slide in this 14-piece set is crafted for adaptability, featuring a mix of chart styles that cater to diverse needs. Editable legends, axes, and data points mean you can input specifics like project phases or material costs without hassle.
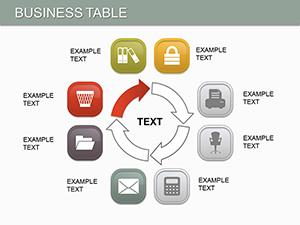
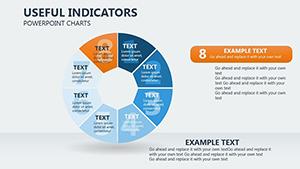
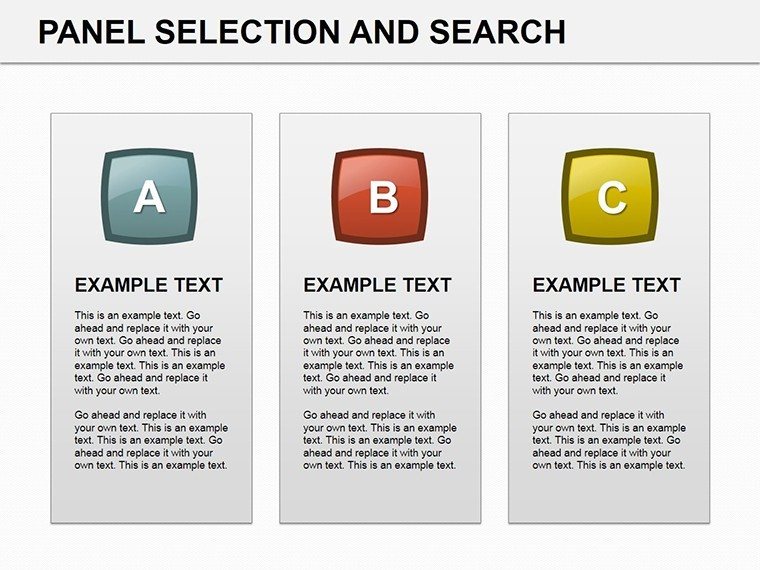
- Multi-Chart Panels: Combine line charts for trends with pies for breakdowns in one view.
- Gantt Integration: Perfect for architecture, showing build schedules alongside milestones.
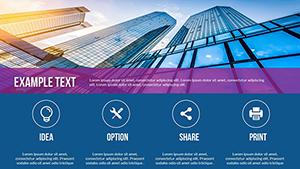
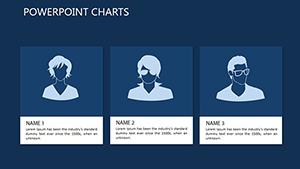
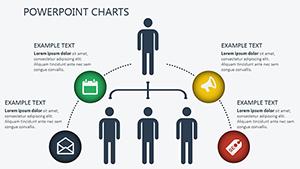
- Org Chart Elements: Embed team structures within broader data displays.
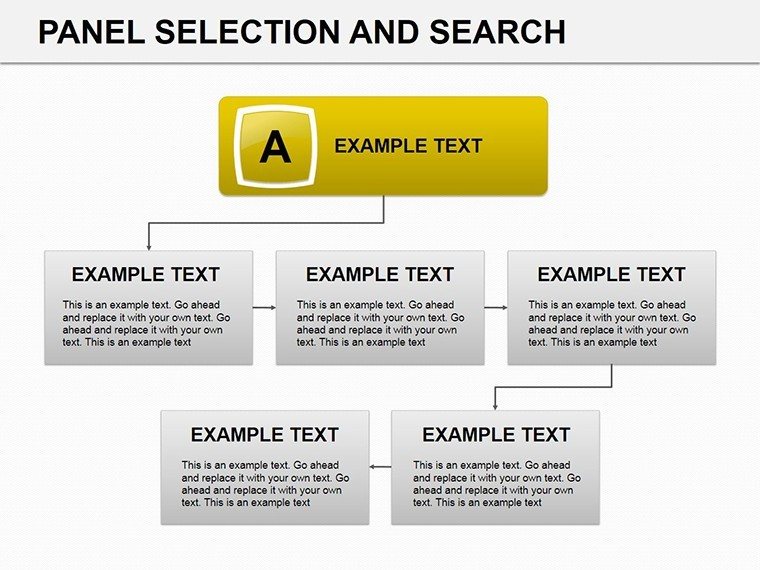
- Flowchart Options: Map processes like design approvals seamlessly.
These aren't generic; they're inspired by real-world demands, ensuring compatibility with PowerPoint's latest features for smooth animations and transitions.
Tailored Use Cases That Drive Results
Envision an architectural firm using these panels to present a mixed-use development: One slide merges a Gantt for construction phases with a bar chart for cost distributions, impressing clients with integrated insights. A real-world example from a LEED-certified project demonstrates how such visuals accelerated approvals by clarifying complexities.
Educators might employ them to teach design principles, contrasting historical vs. modern architectures through comparative panels. For business, marketers can showcase customer journeys alongside sales data, fostering data-driven decisions. Each application addresses common pitfalls like disjointed slides, offering a unified view that enhances persuasion.
Guided Customization Process
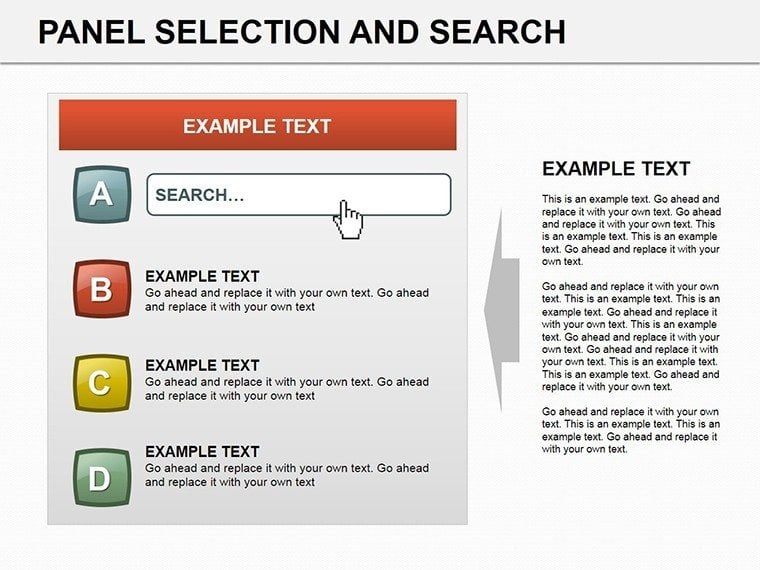
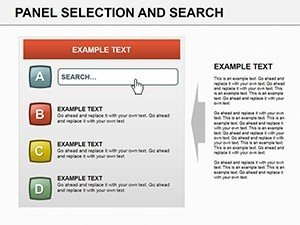
- Browse and Select: Choose from the library based on your panel needs.
- Input Data: Populate with specifics, like architectural metrics.
- Style to Brand: Adjust colors and fonts for AIA-style professionalism.
- Present with Confidence: Add notes or hyperlinks for interactive sessions.
Versus stock PowerPoint, this collection provides pre-synced panels, cutting design time significantly while boosting visual coherence.
Architectural Edge in Visual Storytelling
For architects, these charts are a secret weapon in RFP responses, illustrating site analyses beside budget forecasts. Draw from icons like I.M. Pei, whose projects could be paneled to show evolution over time. Lighten the mood: No more charts that look like a puzzle missing pieces - ours fit perfectly, every time.
Incorporate tips like using negative space for emphasis or data labels for clarity, drawn from expert design practices to build your presentation's authority.
Proven Tips for Panel Mastery
Maximize by aligning panels with your story arc: Introduce data, analyze, conclude. Ensure accessibility with high-contrast colors. For virtual meets, optimize for screen sharing. These insights, from marketing analysts, underscore trustworthiness in every slide.
Transform your panels now - download and dazzle your next audience.
Frequently Asked Questions
What chart types are included?
Bar, pie, line, Gantt, org, and flowcharts in panel formats.
Can I edit for architectural projects?
Yes, customize for timelines and structures easily.
Is it Google Slides friendly?
Absolutely, .pptx uploads without issues.
How many slides per download?
14 fully editable ones.
Any built-in themes?
Tailor to your brand with flexible options.