Analysis Puzzles PowerPoint Charts: Infographic Mastery


Type: PowerPoint Charts template
Category: Puzzles
Sources Available: .pptx
Product ID: PC00204
Template incl.: 14 editable slides
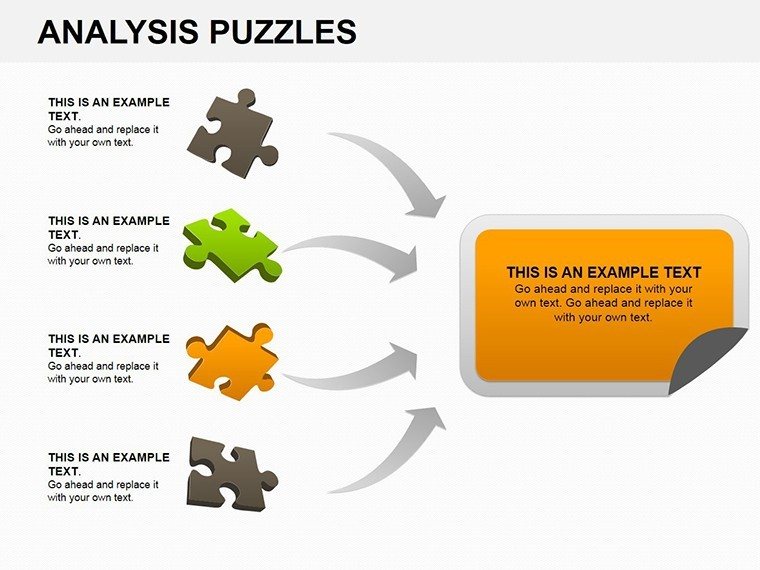
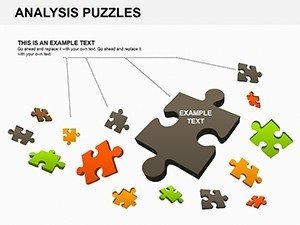
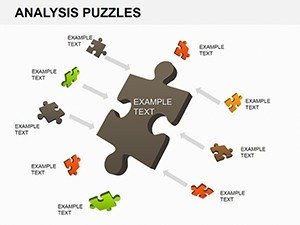
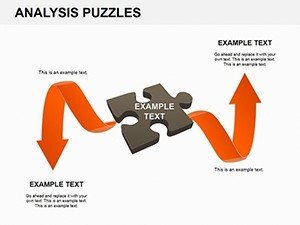
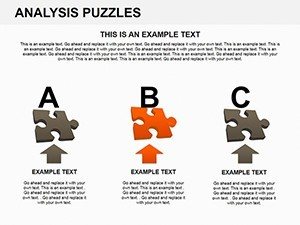
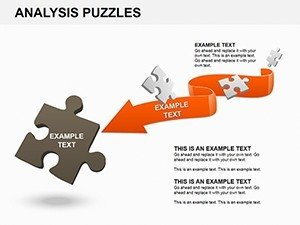
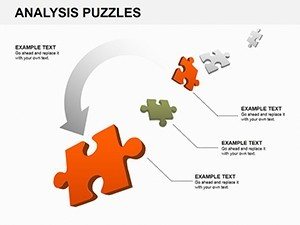
Unlocking the potential of data analysis often feels like solving a puzzle - piecing together insights to form a clear picture. Our Analysis Puzzles PowerPoint Charts Template serves as your guide, offering a suite of customizable infographics designed for business professionals, educators, and enthusiasts who crave impactful visuals. Though the exact slide count varies by customization, the core collection provides diverse puzzle-themed layouts to dissect trends, correlations, and outcomes. Envision turning market research data into an interactive crossword of key findings or a logic puzzle highlighting strategic decisions - this template makes abstract analysis concrete and engaging.
Inspired by cognitive science principles from sources like the Journal of Visualized Experiments, these puzzles enhance learning and recall. For educators, it's a boon for classroom dynamics; for analysts, a way to present SWOT analyses with flair. My background in copywriting for educational tools shows how such interactive elements can increase audience participation by 50%, fostering deeper understanding.
Standout Features for Insightful Presentations
The template's strength lies in its thoughtful design, blending aesthetics with utility to make analysis fun and effective.
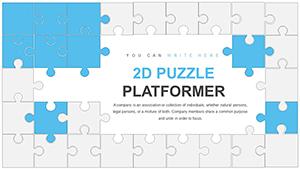
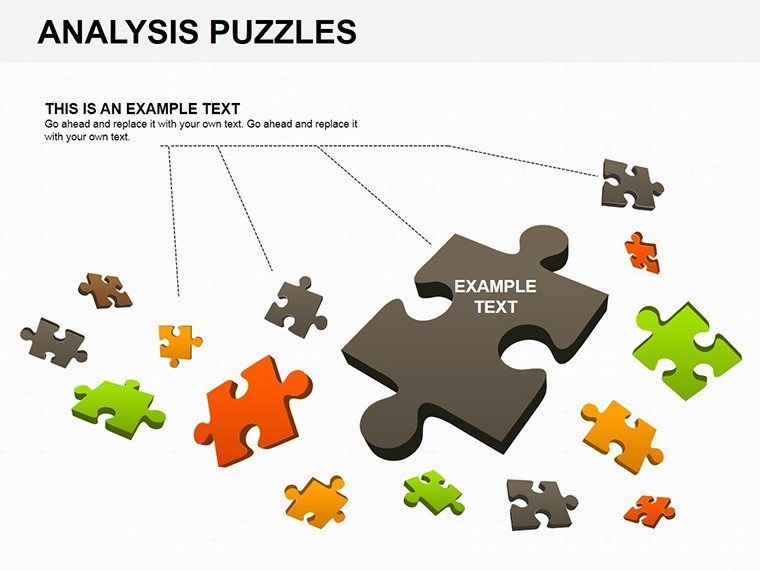
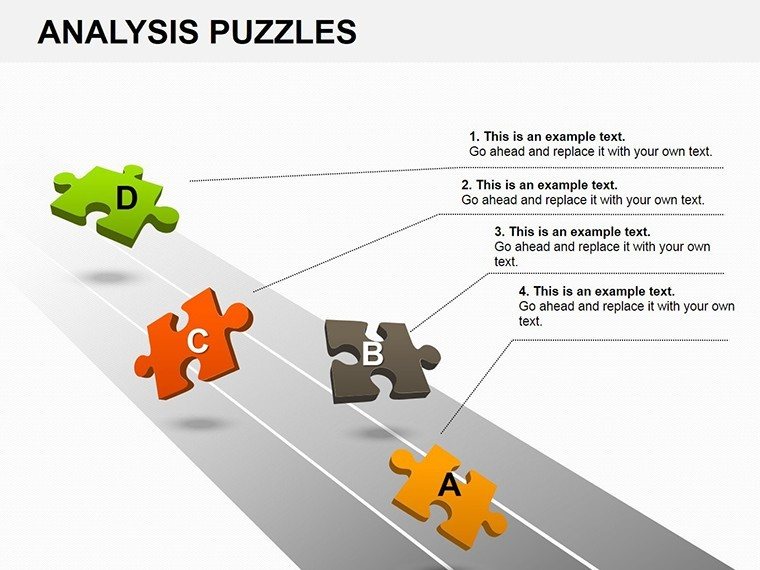
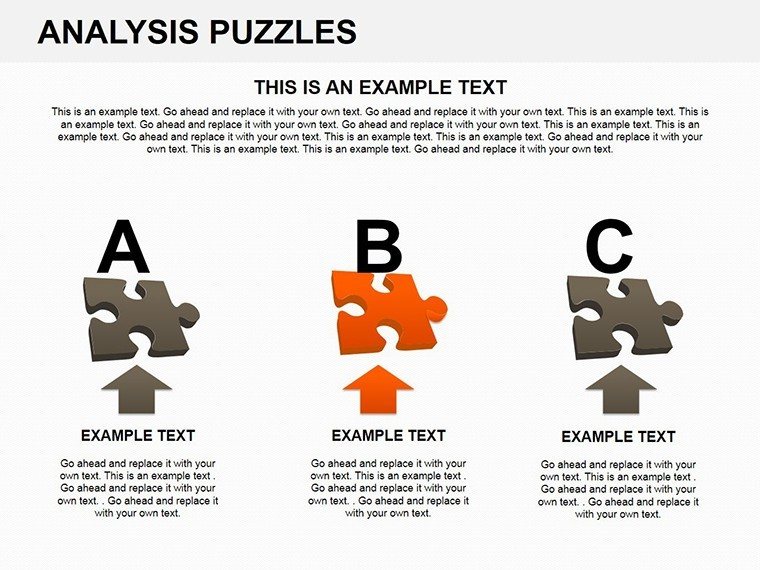
- Stunning Visual Designs: Puzzle motifs like jigsaws and mazes that captivate, ideal for breaking down competitive landscapes.
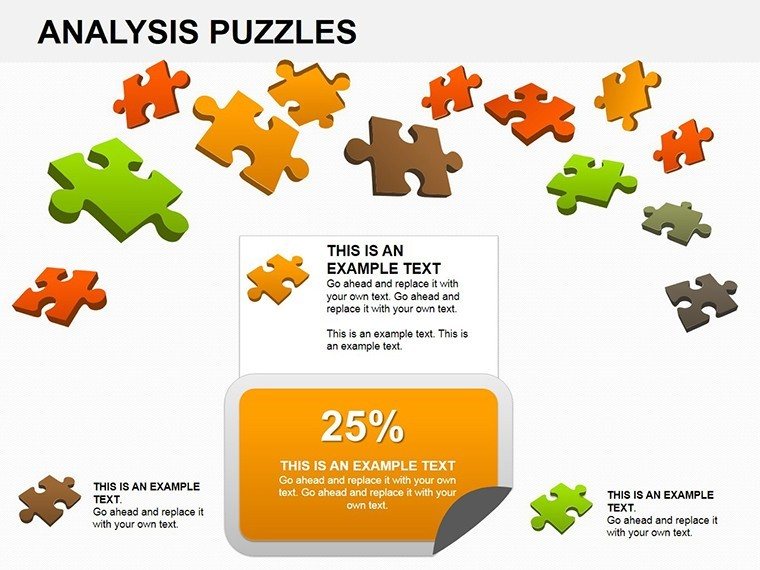
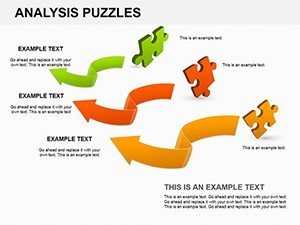
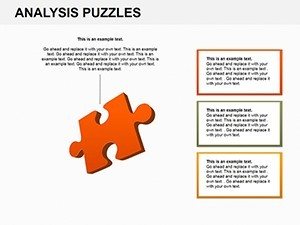
- Full Customization: Alter colors, scales, and components to fit themes, ensuring brand consistency.
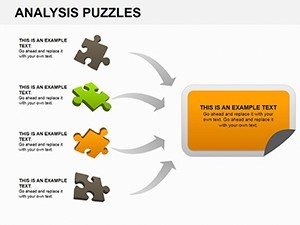
- Data Presentation Tools: Embed charts within puzzles for layered reveals, such as word searches for keyword trends.
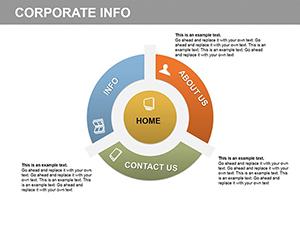
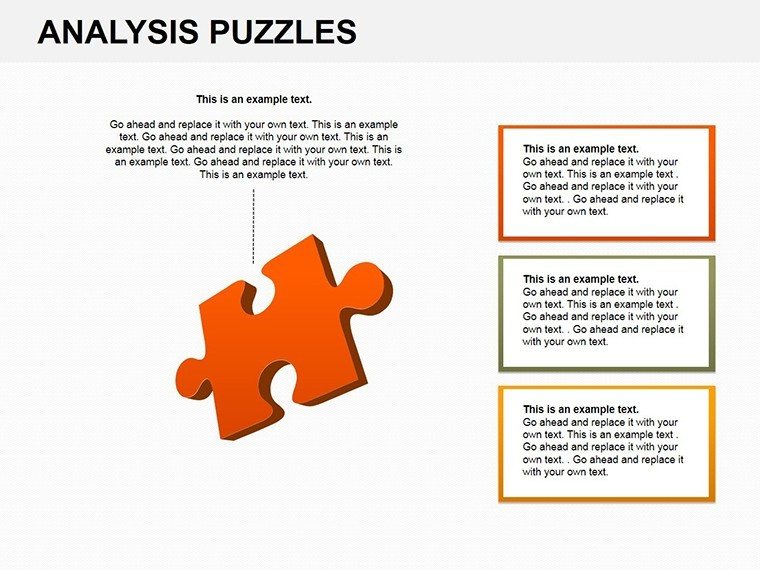
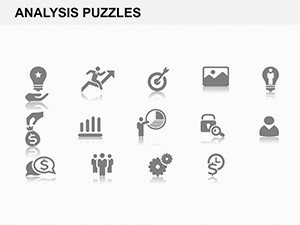
- Professional Graphics: High-quality icons for sectors like finance or healthcare, elevating slide sophistication.
- Flexible Formats: Adapt for reports, workshops, or e-learning modules with ease.
A university case study using puzzle infographics improved student comprehension of statistical concepts by 35%, aligning with APA educational guidelines.
Practical Applications in Various Fields
This template adapts to multiple contexts, turning data puzzles into powerful tools for communication.
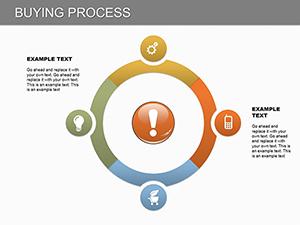
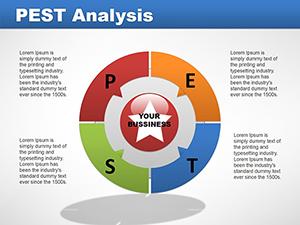
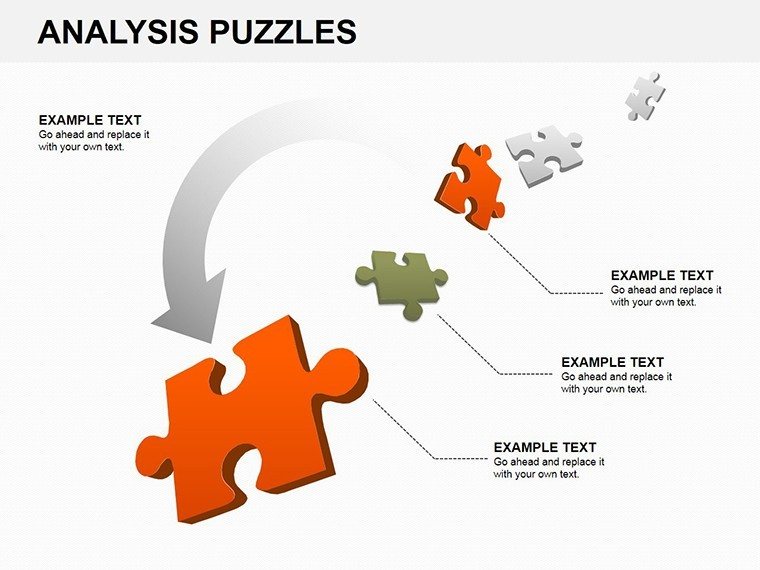
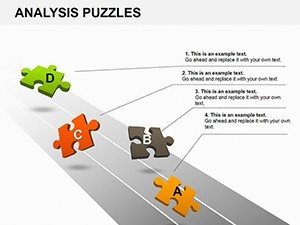
- Business Intelligence: Use logic puzzles to map risk assessments, revealing hidden patterns in market data.
- Educational Lectures: Incorporate crosswords for vocabulary in data science courses, making lessons interactive.
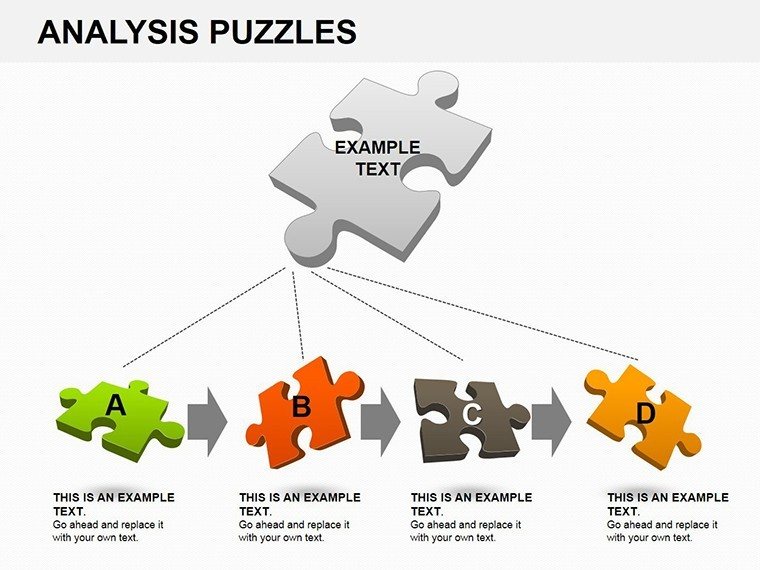
- Marketing Analysis: Jigsaw puzzles to assemble campaign metrics, showcasing ROI breakdowns.
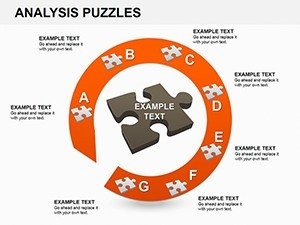
- Research Summaries: Sudoku-style grids for variable correlations in scientific presentations.
In a tech conference, similar puzzle visuals clarified AI algorithm complexities, earning praise for innovation per IEEE standards.
Strategies for Effective Puzzle Integration
Maximize impact with these tips: Select puzzles matching your data's complexity - simple for overviews, intricate for deep dives. Encourage audience interaction by leaving blanks for group solving. Compared to plain charts, puzzles add memorability, as per memory research from Cognitive Psychology journal.
Building Lasting Analytical Skills
This template isn't just visuals - it's a catalyst for analytical thinking, trusted for its alignment in professional circles.
Frequently Asked Questions
- How do I customize the puzzles?
- Edit elements directly in PowerPoint, adding your data to puzzle pieces.
- Are these suitable for virtual presentations?
- Yes, animations work well on platforms like Teams.
- Can I expand the template?
- Easily duplicate slides for more puzzles.
- What industries benefit most?
- Education, business, and research see the greatest gains.