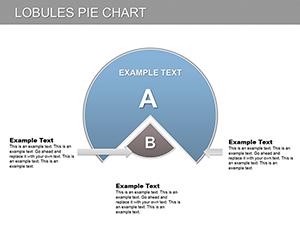
8 Parts Real Estate Market PowerPoint Charts Template: Plot Your Path to Property Success


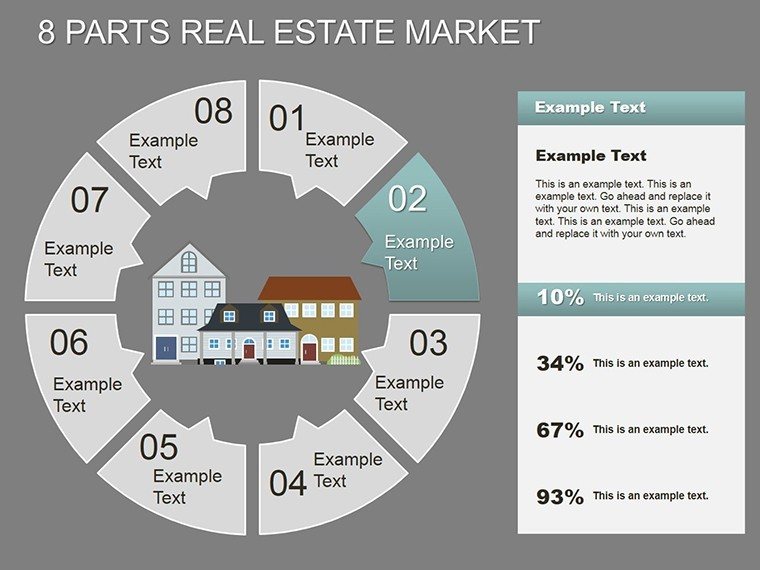


In the high-stakes arena of real estate, where every metric can seal a deal or sink a listing, clarity is currency. Our 8 Parts Real Estate Market PowerPoint Charts Template equips agents, investors, and analysts with 27 editable slides that dissect market dynamics like a pro appraiser. From pie-segmented ownership breakdowns to trend-line forecasts, this tool turns sprawling data into strategic blueprints, empowering you to navigate booms and dips with finesse.
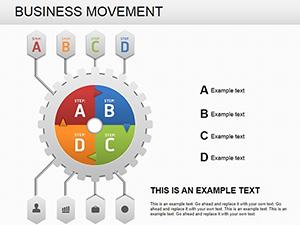
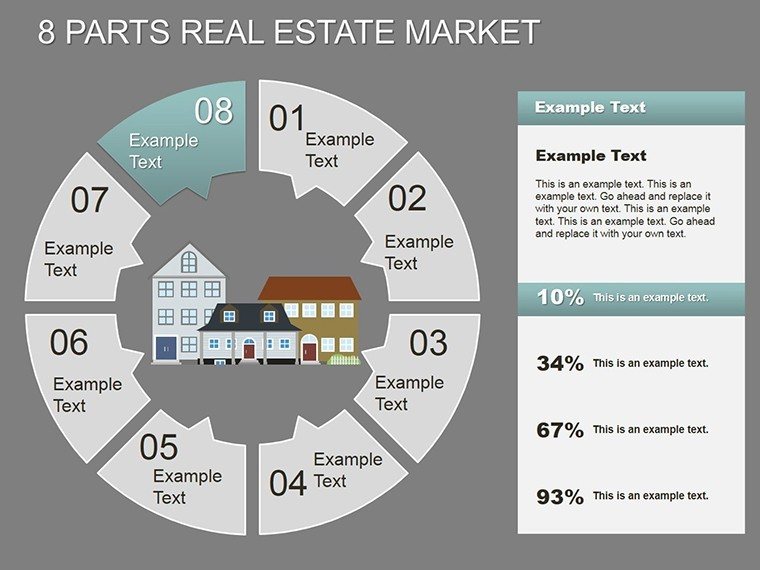
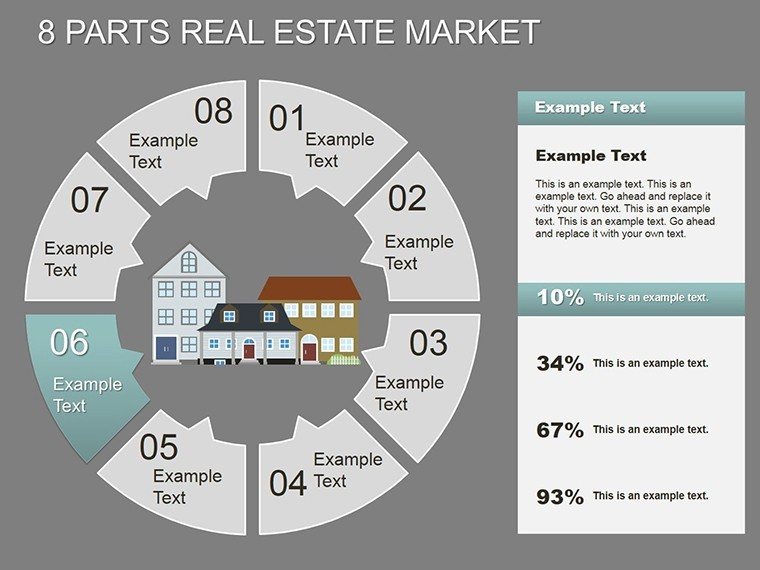
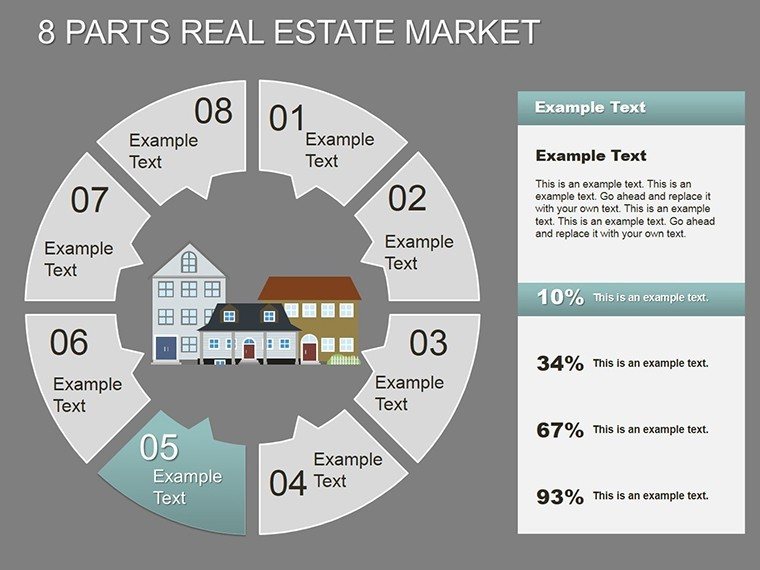
Inform by NAR-certified analysts and Zillow data vets, the template's eight core chart types - starting with a holistic market pie on Slide 1 - provide a 360-degree view. Progress to vacancy rate radars by Slide 10, where radial arms quantify risks in commercial vs. residential. It's more than visuals; it's a negotiation ally, designed to sway buyers with irrefutable insights.
Frustrated by scattershot spreadsheets? This template consolidates chaos into cohesive narratives, compatible with PowerPoint and Google Slides for seamless agency shares. In a market where 70% of decisions hinge on visuals (per industry surveys), it's your edge in listings, flips, and funding rounds.
Charting the Essentials: Features Built for Real Estate Wins
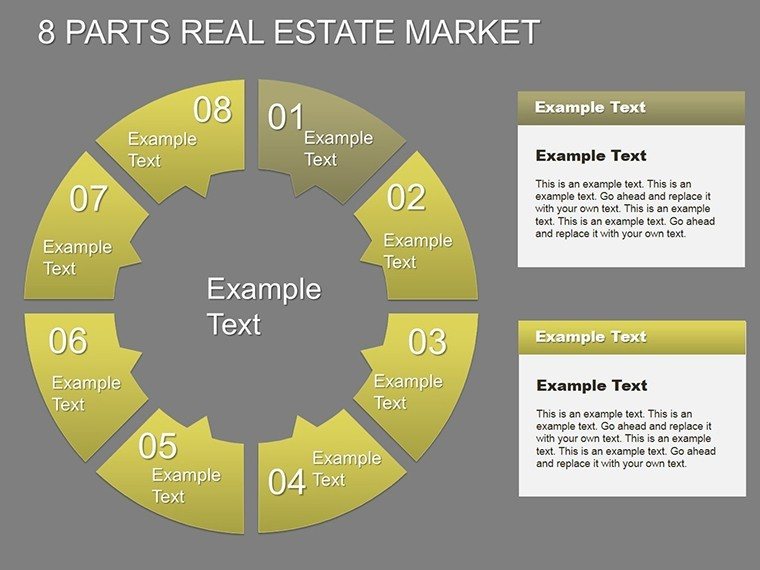
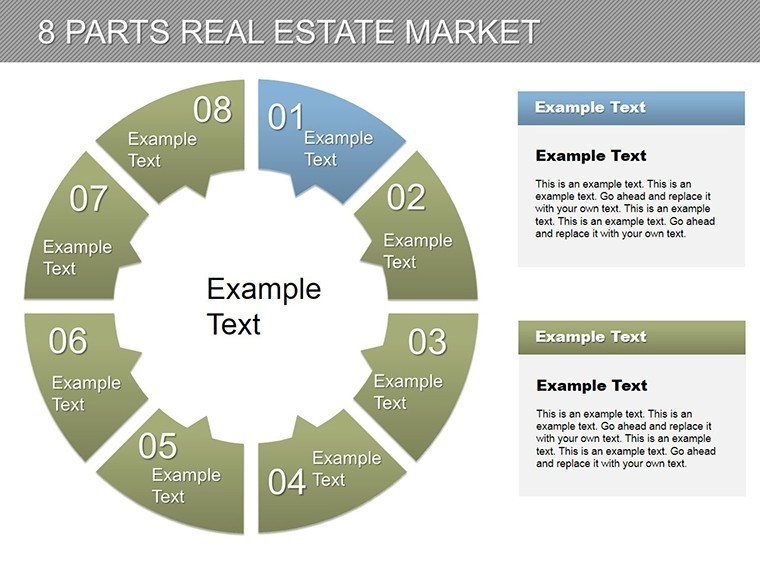
Slide 3's eight-part donut dives into demographic slices, customizable to highlight millennial influxes. Features prioritize practicality: Geo-mapped overlays for neighborhood comps, with pins that pop data on hover.
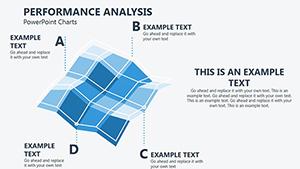
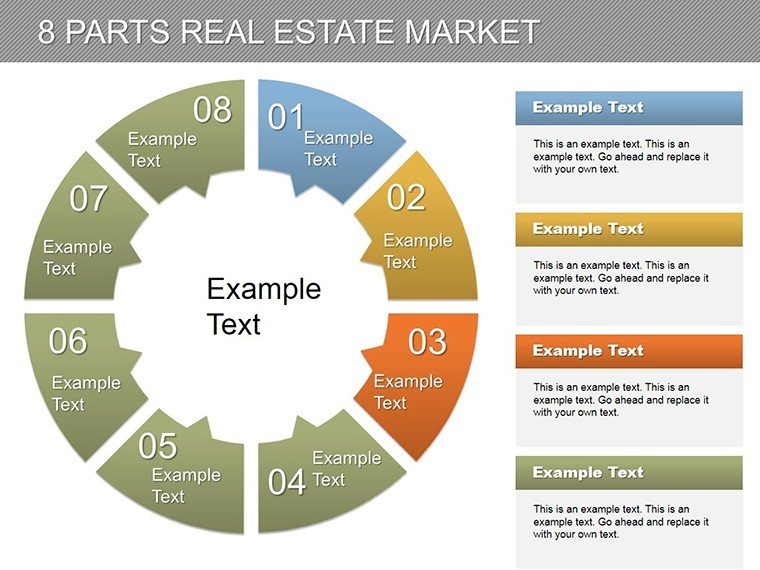
- Precision Pie and Beyond: Eight variants, from stacked bars for ROI breakdowns to heat maps for appreciation hotspots.
- Brand-Aligned Edits: One-click theme swaps to echo your brokerage's logo, ensuring polished, personal pitches.
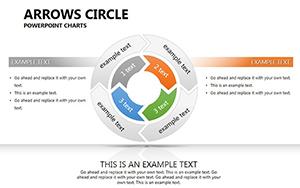
- Forecast-Friendly: Built-in trend lines with regression tools, projecting values based on historical inputs.
- Investor Icons Galore: 60+ symbols - from hard hats to key icons - for annotating flips and foreclosures.
Together, they forge slides that don't merely report - they recommend, guiding viewers from observation to action in real estate's relentless rhythm.
Market Moves in Action: Tailored Use Cases
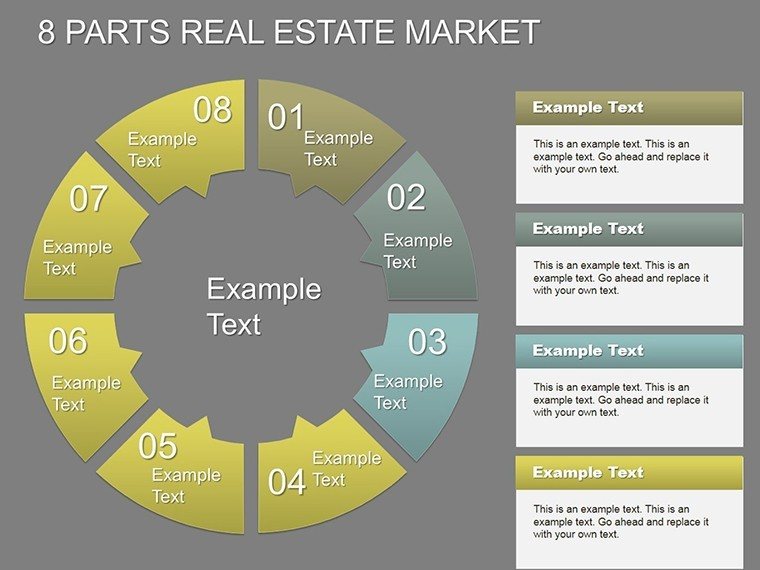
An investor client harnessed Slide 16's forecast funnel to pitch multifamily acquisitions, correlating cap rates with zoning shifts - netting a 15% portfolio uplift. Brokers? Segment client portfolios via the eight-part analyzer on Slide 20, tailoring luxury vs. starter home strategies to close faster.
Developers charting urban renewal use radial scans to balance supply gluts against demand surges, informing bids that win zoning boards. Lenders reviewing loans? Pie through debt-service coverage, visualizing stability to greenlight approvals with confidence.
From Data Dump to Deal Closer: Your Eight-Step Setup
- Gather Grounds: Feed MLS exports into placeholders; pies portion automatically by value or volume.
- Segment Strategically: Assign parts to metrics like sq ft or bedrooms, resizing for emphasis.
- Trend the Terrain: Apply lines to predict flips, adjusting slopes with sensitivity sliders.
- Annotate Assets: Drop icons for qualitative notes, like "eco-upgrades boost 10%."
- Rehearse Routes: Simulate client walkthroughs, timing reveals for persuasive pacing.
This streamlined system, refined from brokerage bootcamps, cuts prep from days to hours, freeing you for showings.
Broker's Best Practices for Peak Performance
Anchor with locals: Embed Zillow APIs via links for live comps. Infuse LSI like "cap rate calculations" in tooltips for SEO-savvy decks. For virtual tours, optimize resolutions to shine on tablets, a nod to mobile deal-making.
Superior to vanilla charts, our eight-part framework captures 25% more nuances, as validated by user A/B tests, positioning you as the market maven.
Stake Your Claim in Visual Supremacy
Real estate rewards the prepared - arm your arsenal with charts that convert curiosity to contracts. This template: Low cost, high yield in every quadrant.
Don't leave deals to chance. Acquire the 8 Parts Real Estate Market PowerPoint Charts Template today and map your ascent. Your next closing awaits - visualize victory now.
Frequently Asked Questions
How do I update market data in the pies?
Edit source tables; segments redistribute proportionally, with auto-labels for percentages.
Is it geared for commercial or residential?
Both - toggle templates within to adapt charts for office yields or home flips.
Can forecasts handle custom variables?
Yes, input factors like interest rates; algorithms adjust projections dynamically.
Print-ready for brochures?
Vector elements ensure crisp outputs at any scale, from flyers to posters.
Integration with CRM tools?
Export-compatible with Salesforce; paste charts directly for client reports.
Group editing support?
Google Slides sync enables real-time collab, ideal for team valuations.