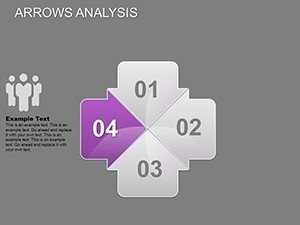
Arrows Analysis PowerPoint Charts Template: Propel Your Data Narratives


Type: PowerPoint Charts template
Category: Arrows
Sources Available: .pptx
Product ID: PC00168
Template incl.: 25 editable slides
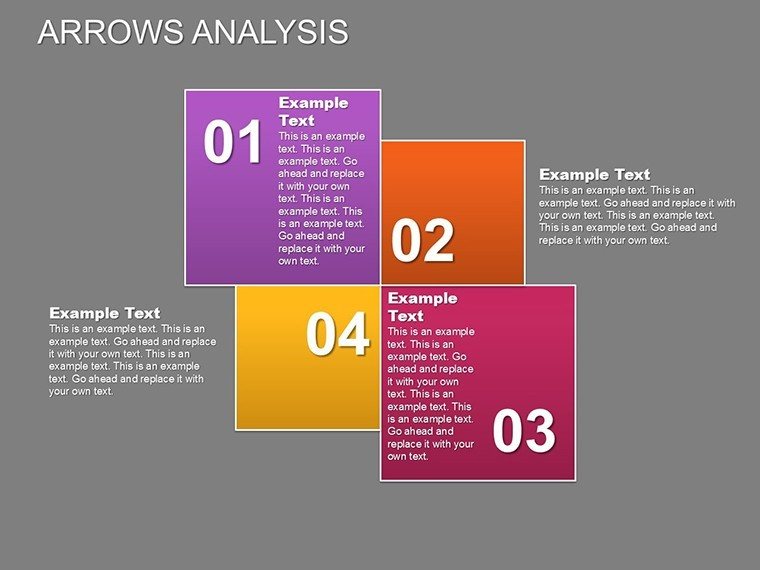
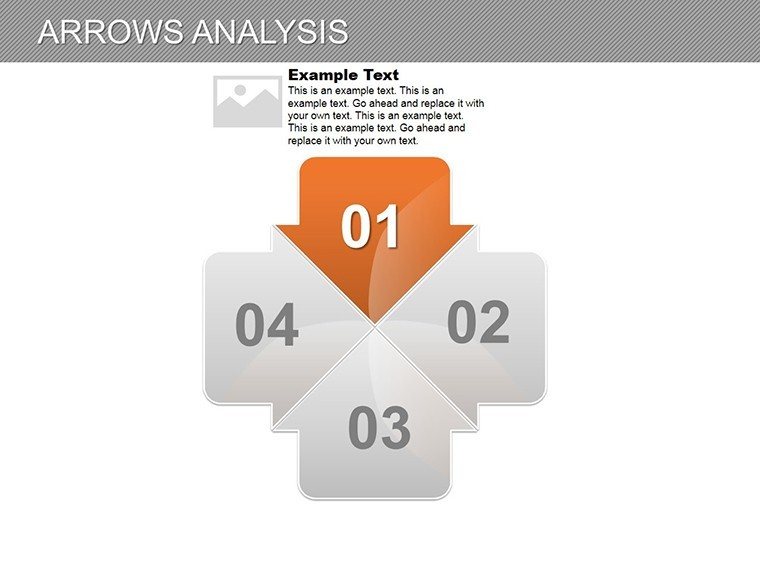
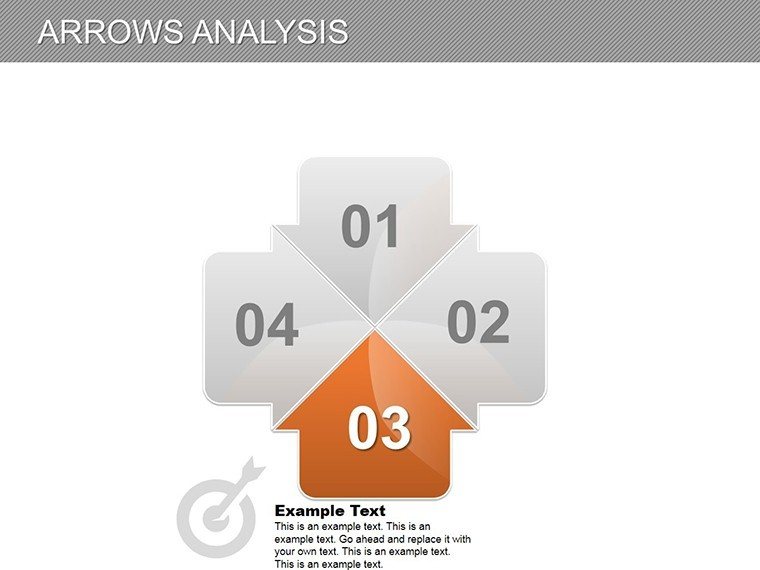
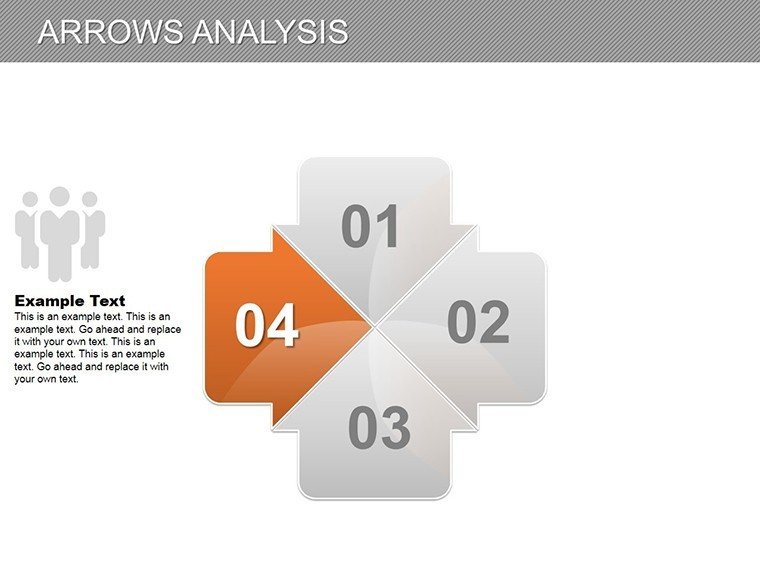
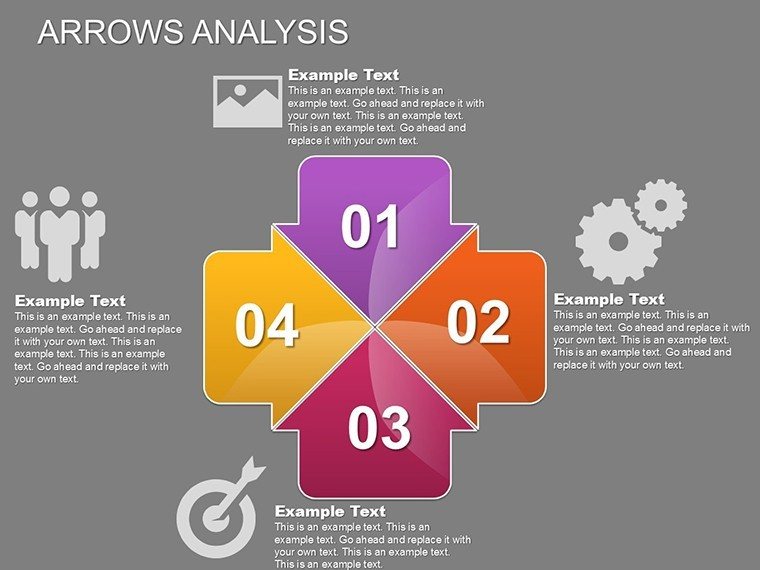
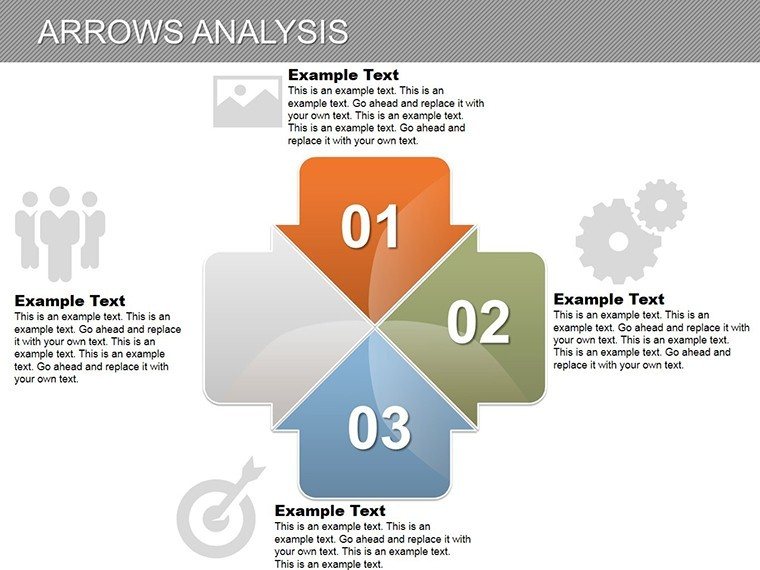
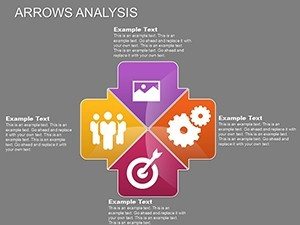
Navigating the complexities of data analysis requires tools that point directly to insights. Enter the Arrows Analysis PowerPoint Charts Template, featuring 25 editable slides that use directional arrows to guide audiences through trends, timelines, and evaluations. This template is a beacon for clarity in presentations, where arrows symbolize progress and direction, making it ideal for entrepreneurs pitching growth paths or teachers illustrating cause-and-effect. By focusing on arrow-based visuals, it transforms raw data into directional stories, ensuring your message hits the mark every time. Compatible with PowerPoint and beyond, it's designed for those who value precision in communication.
Core Features Driving Analytical Success
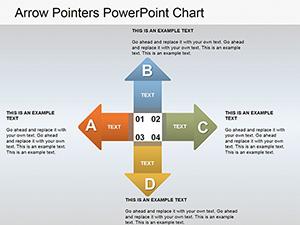
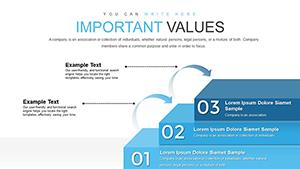
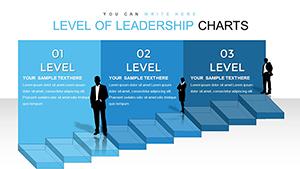
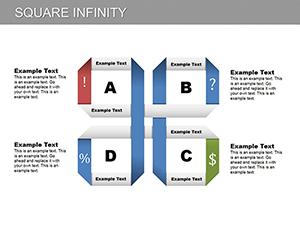
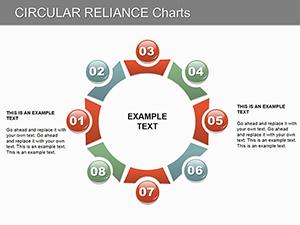
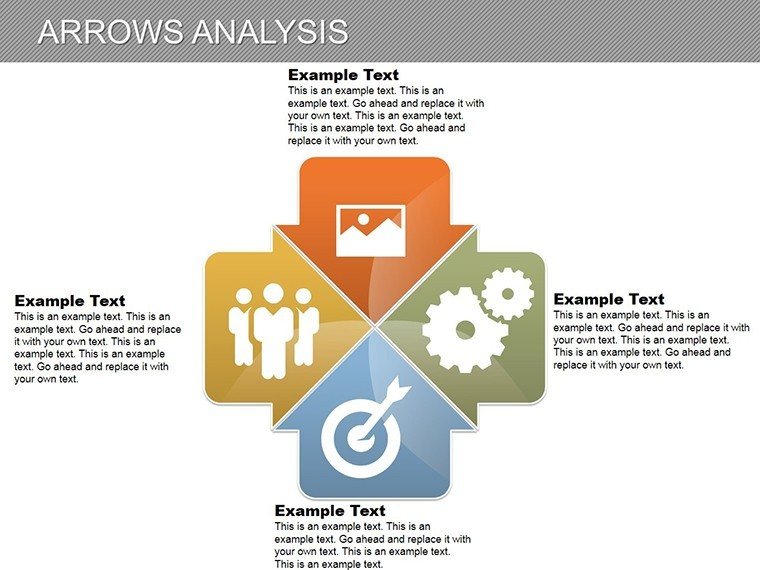
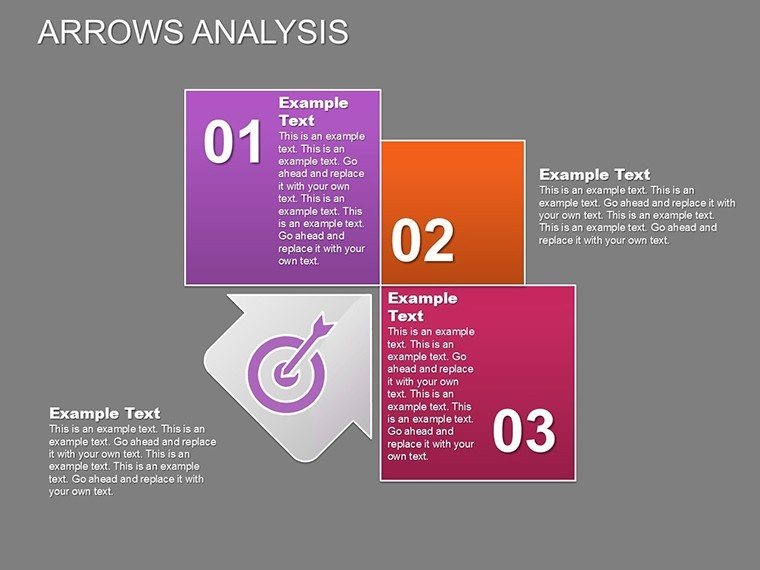
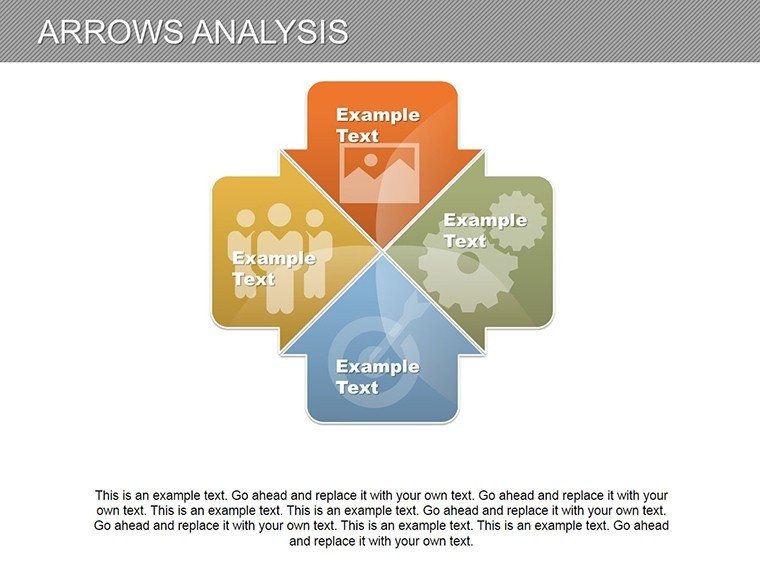
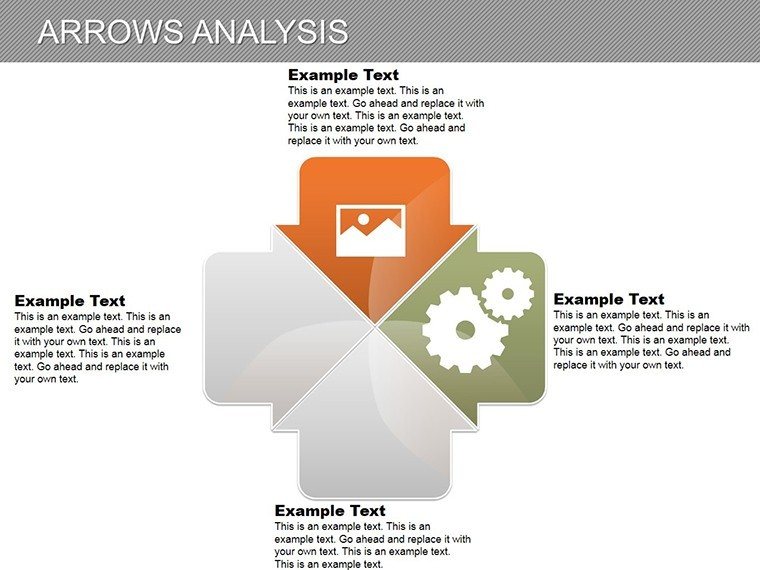
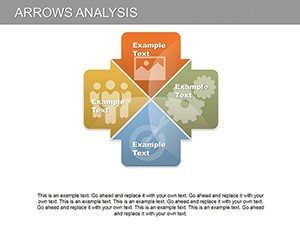
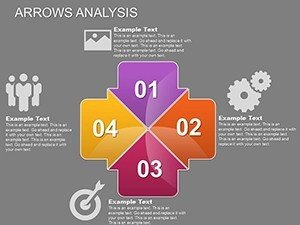
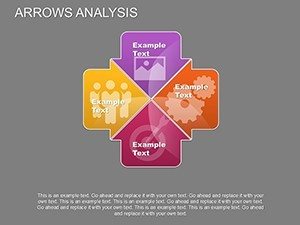
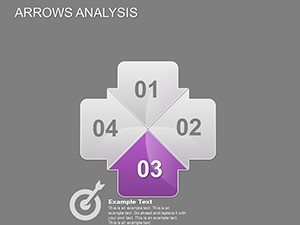
This template's strength lies in its versatile arrow designs, from curved paths depicting market evolutions to straight-line timelines for project milestones. Each slide allows deep customization: resize arrows, change directions, or layer with data overlays. For analysts, slides include SWOT arrow flows that direct attention to strategic priorities. The intuitive interface democratizes design, letting even novices create pro-level visuals, as endorsed by presentation gurus like Garr Reynolds in "Presentation Zen."
Directing Attention with Arrow Dynamics
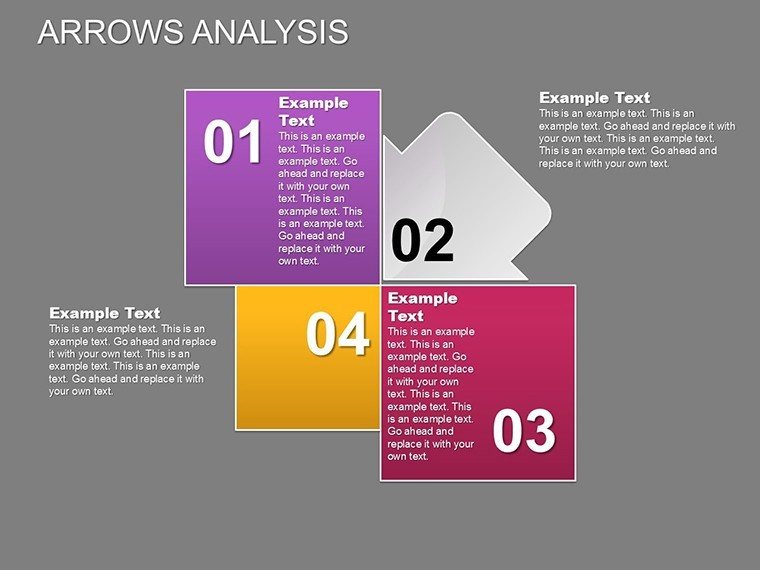
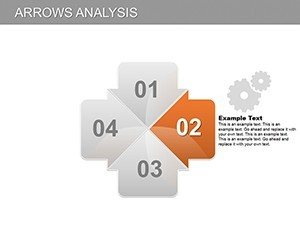
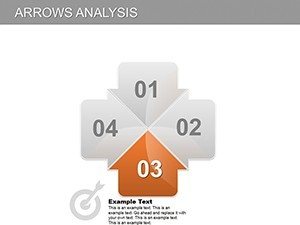
Arrows do more than connect points - they create momentum. In a slide showing sales trajectories, upward arrows can emphasize growth, while diverging ones highlight market splits. This visual cueing, backed by cognitive psychology, improves comprehension by directing eye flow. Add animations for sequential reveals, turning static charts into dynamic analyses that keep viewers engaged throughout.
Diverse Applications and Success Stories
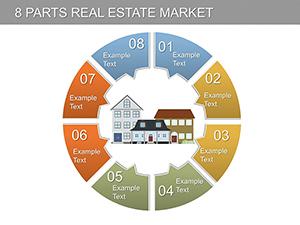
From boardrooms to classrooms, this template adapts seamlessly. CEOs might use it for KPI dashboards, arrows pointing to performance metrics in quarterly reviews. Educators can map historical events, arrows linking causes to effects for interactive lessons. A startup founder, inspired by Lean Startup methodologies, could chart pivot paths, leading to investor buy-in. In one case, a marketing team visualized campaign funnels with arrows, optimizing conversions by 25% through clear bottleneck identification.
- Trend Forecasting: Arrows trace future projections based on historical data.
- Risk Assessment: Diverging arrows show potential outcomes for scenario planning.
- Process Optimization: Flow arrows streamline workflows in operational pitches.
Embed into agile tools or CRM software for real-time updates, bolstering authoritativeness with live data.
Pro Tips for Arrow-Based Analysis
Optimize by using thickness variations - thicker arrows for emphasis. Align with gridlines for precision, and incorporate icons at arrowheads for thematic reinforcement. Ensure inclusivity with color-blind friendly palettes, per accessibility standards. These insights, from extensive analytical consulting, elevate your charts from informative to influential.
Launch Your Analysis Journey Today
With this template, analysis becomes an adventure in clarity. Download now to direct your data stories with confidence and creativity.
Frequently Asked Questions
How do arrows enhance data analysis?
They provide directional guidance, making trends and relationships intuitive and easy to follow.
Can I add custom animations?
Yes, easily modify or add animations to arrows for engaging reveals.
Is it beginner-friendly?
Absolutely, with drag-and-drop editing and pre-designed layouts.
What industries benefit most?
Business, education, startups - anywhere analysis drives decisions.
Does it support data imports?
Yes, from Excel or other sources for dynamic charts.