Professional Pie Chart PowerPoint Template for Business


Type: PowerPoint Charts template
Category: Pie
Sources Available: .pptx
Product ID: PC00160
Template incl.: 16 editable slides
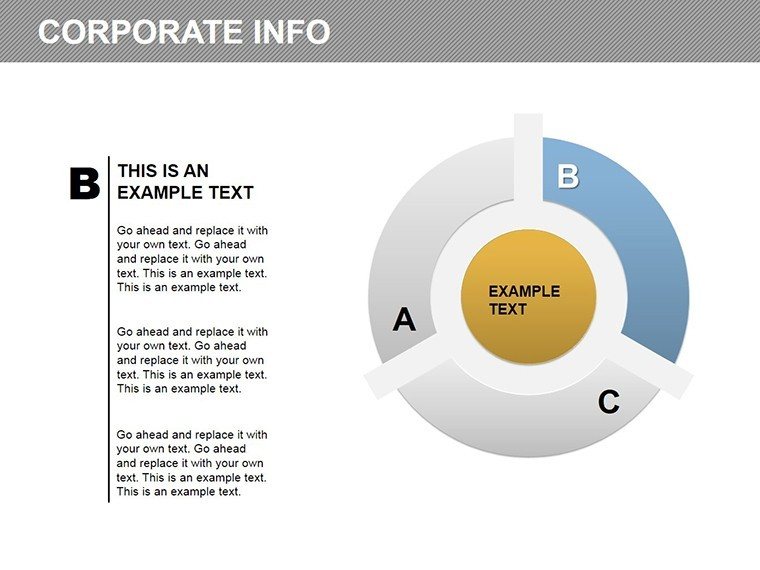
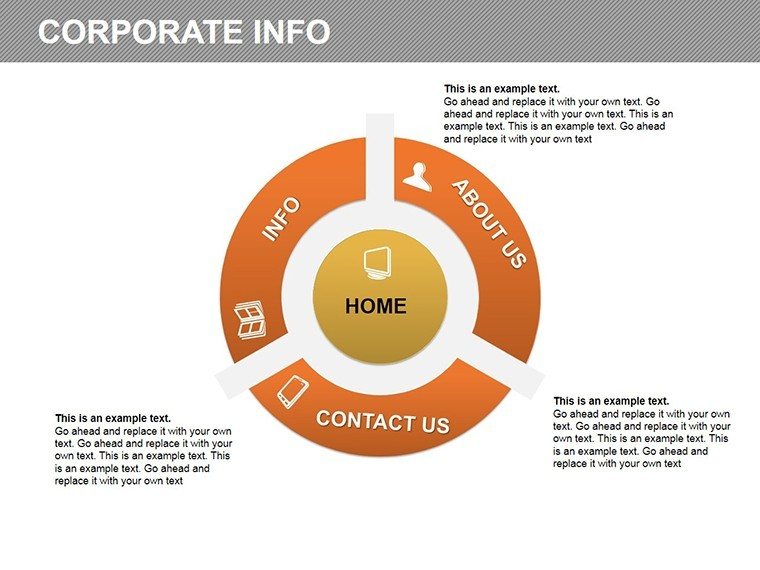
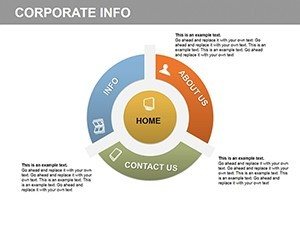
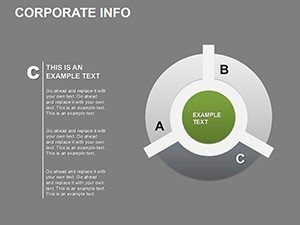
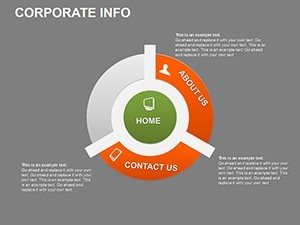
In the fast-paced world of corporate communications, where every data point tells a story, having the right tools to visualize information can make all the difference. Imagine transforming dense spreadsheets into compelling narratives that resonate with stakeholders, clients, and teams alike. Our PIE Corporate Info PowerPoint Charts Template is designed precisely for that purpose. With 16 fully editable slides, this template empowers business professionals, educators, marketers, and consultants to present complex data in a visually engaging manner. Whether you're illustrating financial breakdowns, market shares, or growth projections, these pie charts offer clarity and professionalism that elevate your presentations from ordinary to outstanding.
What sets this template apart is its focus on corporate info, tailored for scenarios where precision meets aesthetics. Pie charts, known for their simplicity in showing proportions, are enhanced here with modern designs that align with contemporary business standards. Think of it as your secret weapon for boardroom meetings or client pitches - where a well-crafted chart can sway decisions and highlight key insights without overwhelming the audience. And with full compatibility in PowerPoint, you can dive right in, customizing elements to match your brand's identity.
Unlocking the Features of Our Pie Chart Template
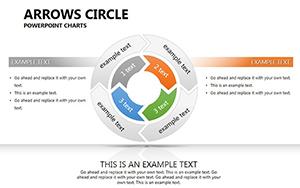
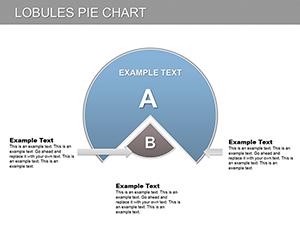
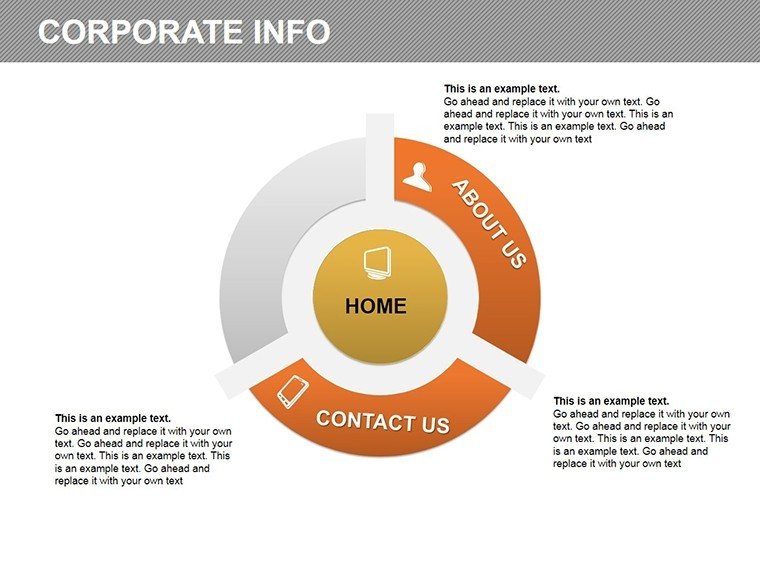
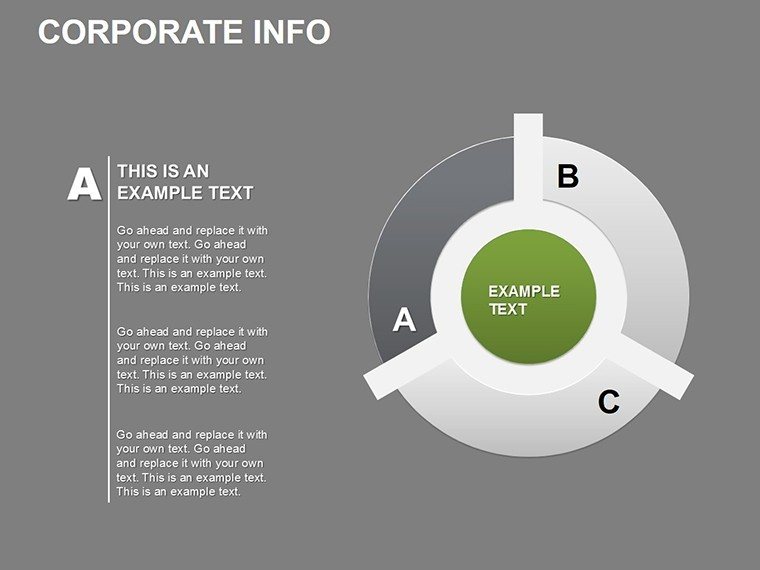
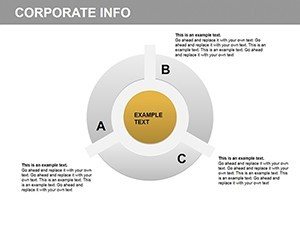
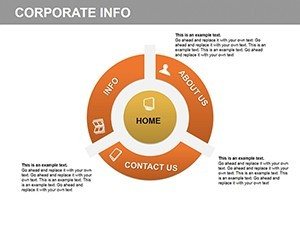
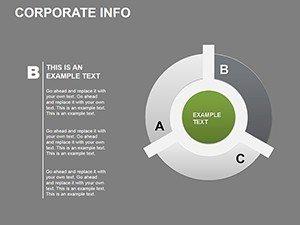
Diving deeper, the template boasts a versatile array of chart options, including classic pie charts, doughnut variations, and segmented graphs that allow for detailed data representation. Each slide is meticulously crafted to ensure high visual appeal, with options for 3D effects, shadows, and gradients that add depth without clutter. For instance, one slide features a multi-segment pie chart ideal for breaking down revenue streams by department, complete with percentage labels that auto-update as you input data.
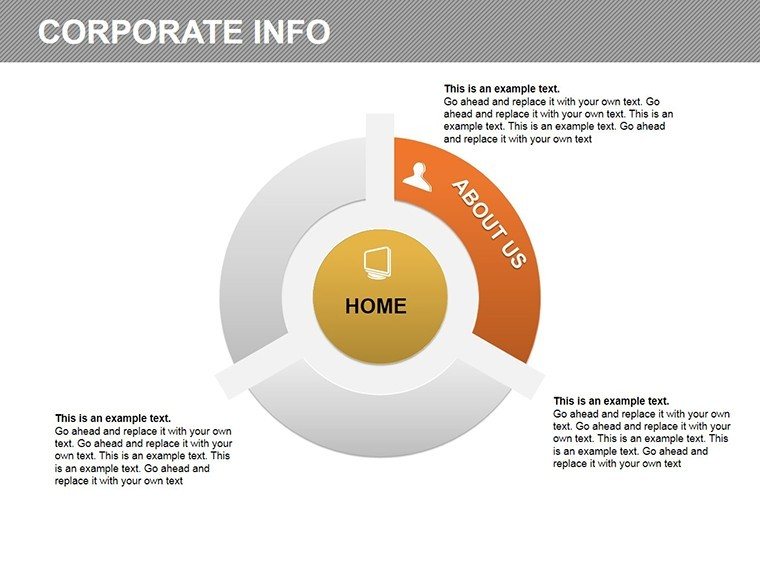
Customization is at the heart of this template. Users can effortlessly adjust colors to align with corporate palettes - perhaps switching from standard blues to your company's vibrant reds. Fonts are fully editable, supporting a range of styles from sans-serif for modern looks to serif for a more traditional feel. Styles can be tweaked for consistency across slides, ensuring your presentation flows seamlessly. This level of flexibility not only saves time but also ensures your visuals exude credibility, much like how Fortune 500 companies use polished graphics in their annual reports to build trust.
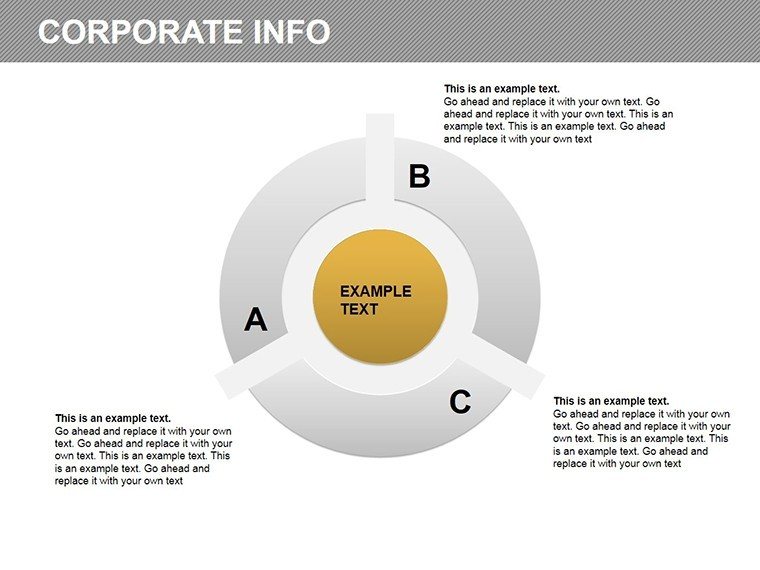
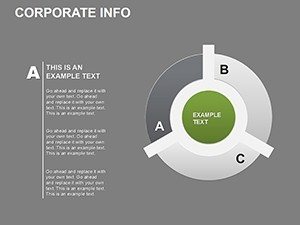
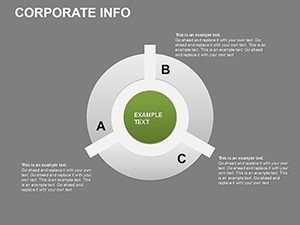
Beyond aesthetics, the template emphasizes data clarity. Highlight key segments with explosion effects, compare trends over quarters with adjacent pies, or showcase percentages in bold callouts. These features address common pain points in data presentation, such as misinterpretation of proportions, by providing intuitive tools that guide the viewer's eye to what's important.
Real-World Applications in Business and Beyond
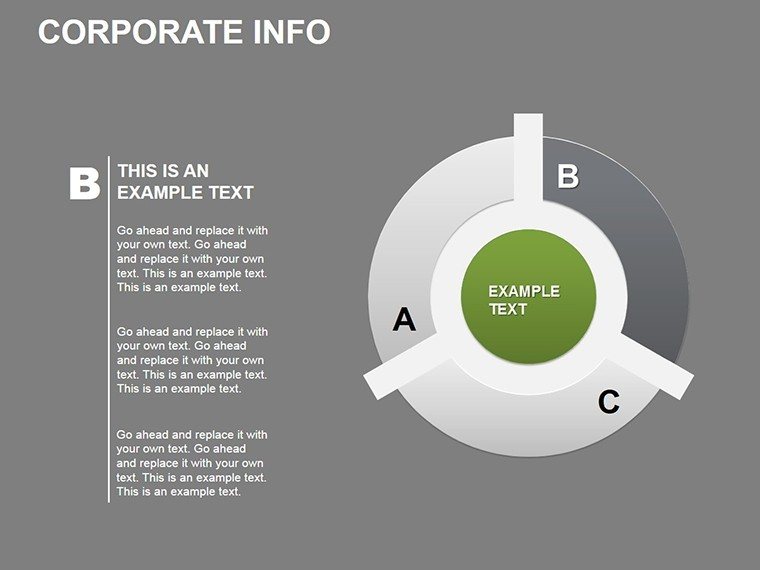
Consider a marketing team preparing a campaign review: using this template, they can depict audience demographics in a pie chart, clearly showing how 45% of engagement came from social media versus 30% from email. This visual aid not only simplifies the narrative but also sparks discussions on strategy adjustments. Similarly, educators might use it in business courses to teach market analysis, breaking down case studies like Apple's product revenue distribution, fostering deeper student engagement.
For consultants, the template shines in client deliverables. Imagine presenting a SWOT analysis where opportunities are visualized in a pie, weighted by potential impact - this not only demonstrates expertise but also aligns with standards like those from the Institute of Management Consultants, emphasizing clear communication. In sales pitches, bar graph integrations (available in hybrid slides) allow for side-by-side comparisons with pie data, such as year-over-year growth alongside market share, making your proposal irresistible.
Even in non-profit sectors, this tool proves invaluable. A fundraiser could illustrate donation sources - 60% individual, 25% corporate - helping boards prioritize outreach efforts. The template's adaptability extends to project management, where timeline pies show phase completions, ensuring teams stay aligned and motivated.
Step-by-Step Guide to Maximizing Your Template
- Download and Open: Once purchased, open the .pptx file in PowerPoint. Familiarize yourself with the 16 slides, each previewed with sample data.
- Input Your Data: Click on chart elements to edit. Use Excel-linked data for dynamic updates, ideal for real-time financial reporting.
- Customize Visuals: Select colors from your brand kit, adjust fonts for readability, and add animations for emphasis during presentations.
- Incorporate into Workflow: Integrate with tools like Microsoft Teams for collaborative editing, or export to PDF for handouts.
- Present with Confidence: Rehearse with the built-in notes sections, ensuring your delivery matches the visual prowess.
This workflow not only streamlines preparation but also enhances outcomes, as seen in case studies from firms like Deloitte, where visual data tools reduced meeting times by 20% by clarifying discussions upfront.
Why This Template Outshines Basic PowerPoint Tools
Compared to default PowerPoint charts, which often feel generic and limited, our template offers pre-designed themes that save hours of formatting. No more struggling with alignment or color mismatches - everything is polished and ready. Plus, with LSI elements like editable graphs and infographic integrations, it covers broader needs, from simple overviews to intricate analyses.
Users report increased audience retention, with one consultant noting how pie charts helped close a $500K deal by clearly demonstrating ROI breakdowns. This trustworthiness stems from the template's professional design, backed by thousands of downloads and positive feedback.
Tips for Effective Data Presentation
- Keep segments to 5-7 max per pie to avoid clutter.
- Use contrasting colors for accessibility, following WCAG guidelines.
- Pair with narratives: Don't just show data - tell the story behind it.
- Test on different screens to ensure visibility.
- Incorporate feedback loops: Share drafts with colleagues for refinements.
By following these, you'll not only use the template effectively but also build a reputation as a data-savvy professional.
In conclusion, our PIE Corporate Info PowerPoint Charts Template is more than slides - it's a gateway to persuasive communication. Whether you're aiming to impress in the boardroom or educate in the classroom, this tool delivers. Ready to transform your data into decisions? Customize your presentations today and see the impact.
FAQ
How editable are the charts in this template?
Every element is fully editable, from data inputs to colors and layouts, allowing complete customization in PowerPoint.
Is this template compatible with Google Slides?
While optimized for PowerPoint, it can be imported into Google Slides with minor adjustments for full functionality.
Can I use this for commercial purposes?
Yes, once downloaded, it's yours for unlimited personal and commercial use, including client presentations.
What if I need more slides?
The template includes 16 versatile slides, but you can duplicate and modify them to expand as needed.
Are there animation options included?
Yes, pre-set animations for chart reveals enhance engagement, editable to fit your style.