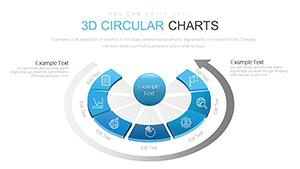
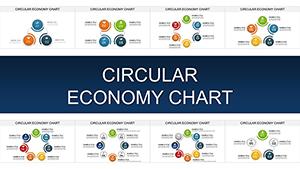
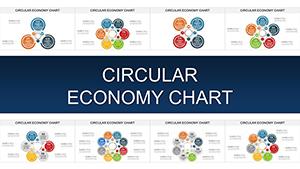
3D Circle Four Sectors PowerPoint Charts Template


Embrace the fusion of form and function with our 3D Circle Four Sectors PowerPoint Charts Template, a volumetric masterpiece for modern presenters. Comprising 18 editable slides, this template reimagines traditional circles as dynamic, four-sectored 3D objects that connect ideas seamlessly. Suited for strategists outlining quarterly plans or educators explaining ecosystem balances, it supplements textual content with visual metaphors that amplify retention. By leveraging perspective and depth, as advocated in design texts like "The Visual Display of Quantitative Information," this tool helps you craft presentations that are not only informative but also artistically compelling, turning routine updates into memorable experiences.
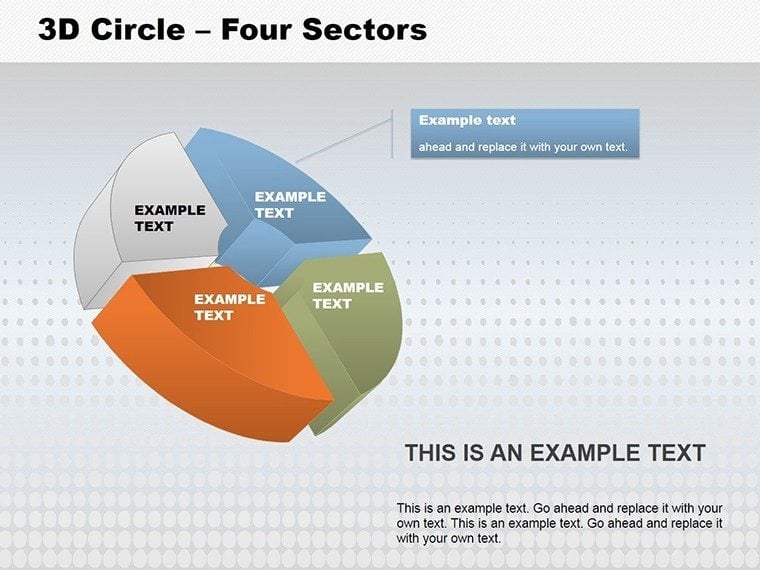
Exploring 3D Circle Dynamics
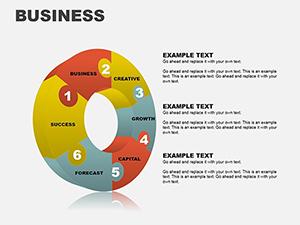
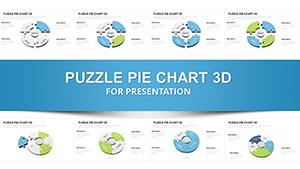
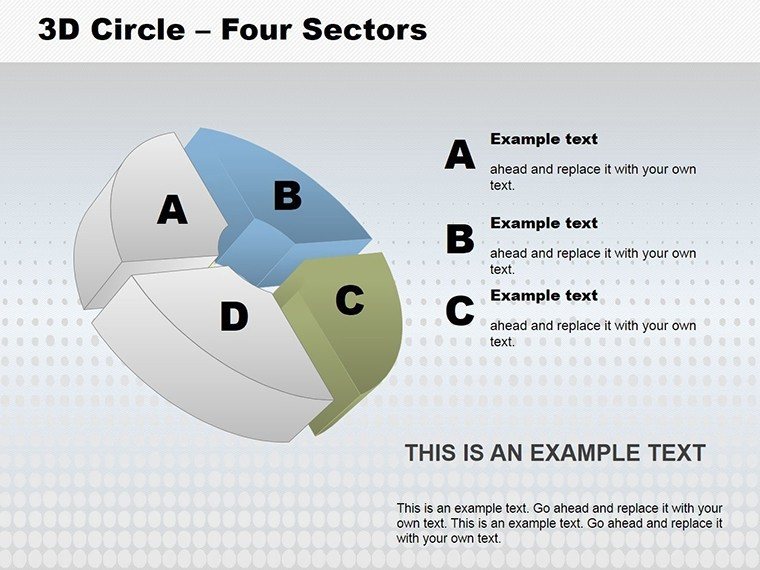
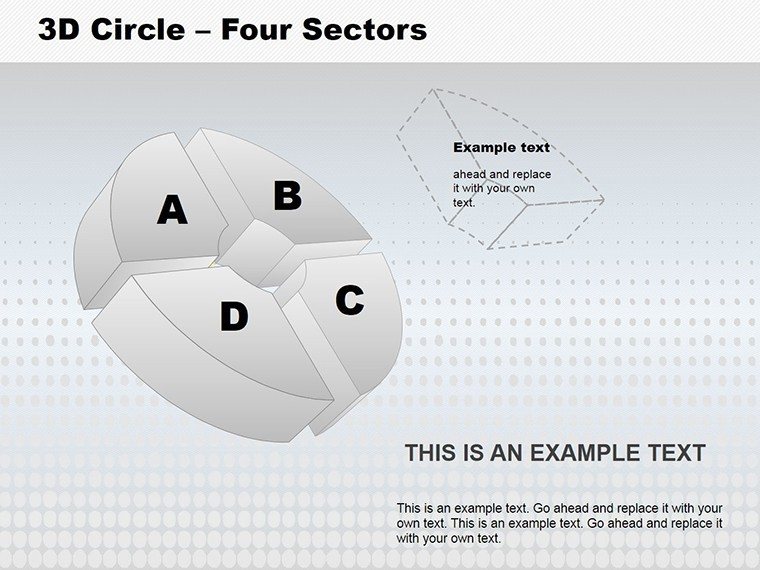
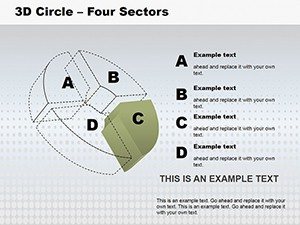
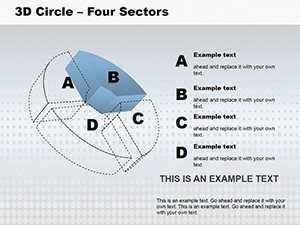
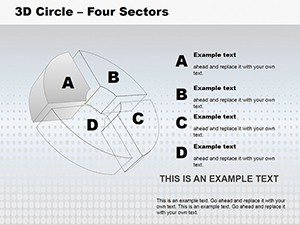
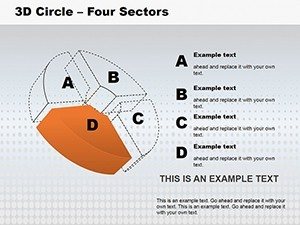
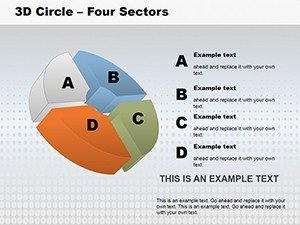
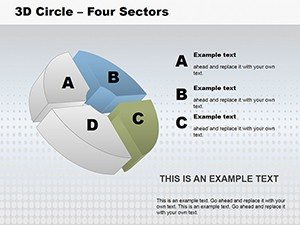
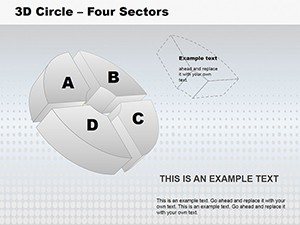
The four-sector circle in 3D offers a fresh take on pie and cycle charts, with sectors that can 'pop' for emphasis. This template's slides vary from unified circles for holistic views to dissected ones for detailed analysis. The volumetric design allows for creative compositions, breaking free from flat constraints to visualize concepts like market quadrants or project quadrants with added dimension.
Core Features Driving Creativity
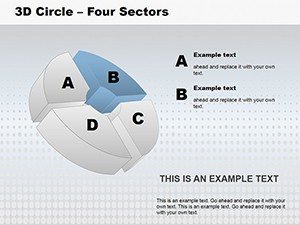
Editability is key: modify sector angles based on data, apply custom palettes, or integrate metaphors like gears for cycles. Compatible across platforms, the high-res graphics ensure quality. Animations enable sector reveals, and the structure supports diverse audiences by adapting to business goals.
- Volumetric Objects: Connected sectors for unified or modular displays.
- Flexible Perspectives: Adjust views for innovative storytelling.
- Metaphor Integration: Use colors and elements for targeted messaging.
- Memorability Boost: Visual aids that enhance information recall.
Use Cases Tailored to Your Needs
Deploy this in action: For business models, sector a circle into product, price, place, promotion - the 4Ps of marketing. In training, depict learning cycles with sectors for plan, do, check, act. A consulting firm case study revealed using 3D circles improved client strategy sessions, leading to 35% faster consensus. These examples illustrate how the template resolves ambiguity in complex topics.
Step-by-Step Customization Process
Begin by downloading, then edit sectors with your data - the chart auto-updates. Customize with themes, add text curves, and link for navigation. Preview to optimize flow, aligning with your narrative.
- Acquire and open the file.
- Input data into sectors.
- Refine visuals and metaphors.
- Add interactivity.
- Rehearse for impact.
Seamless Workflow Enhancement
Blend with tools like MindMeister for idea mapping or use in hybrid meetings. Follow best practices from AIGA for composition, ensuring audience fit. In an urban planning example, 3D sectors visualized zoning, aiding community buy-in. Tips: Employ shadows for depth or patterns for distinction.
Surpassing basic circles, this adds 3D sophistication for standout presentations.
Elevating Beyond Defaults
PowerPoint's standard pies lack depth; our template delivers pre-built 3D for efficiency and polish.
Unleash visual potential - customize your story now.
Frequently Asked Questions
- Can sectors be connected or separated?
- Yes, design allows for both unified and modular setups.
- Is it 3D editable?
- Fully, including perspectives and rotations.
- What categories does it fit?
- Cycle, pie, and 3D charts.
- Suitable for beginners?
- Intuitive interface makes it accessible.
- How to add metaphors?
- Incorporate via colors, icons, and text.
- Slide count?
- 18 versatile editable slides.