Vortex PowerPoint Charts Template - Elevate Your Presentations


Type: PowerPoint Charts template
Category: Cycle
Sources Available: .pptx
Product ID: PC00142
Template incl.: 16 editable slides
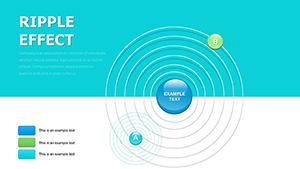
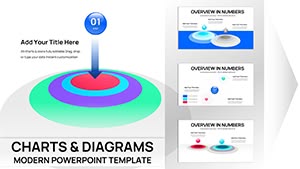
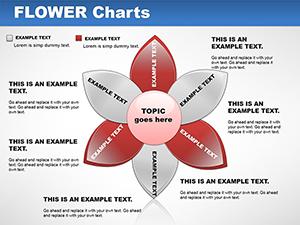
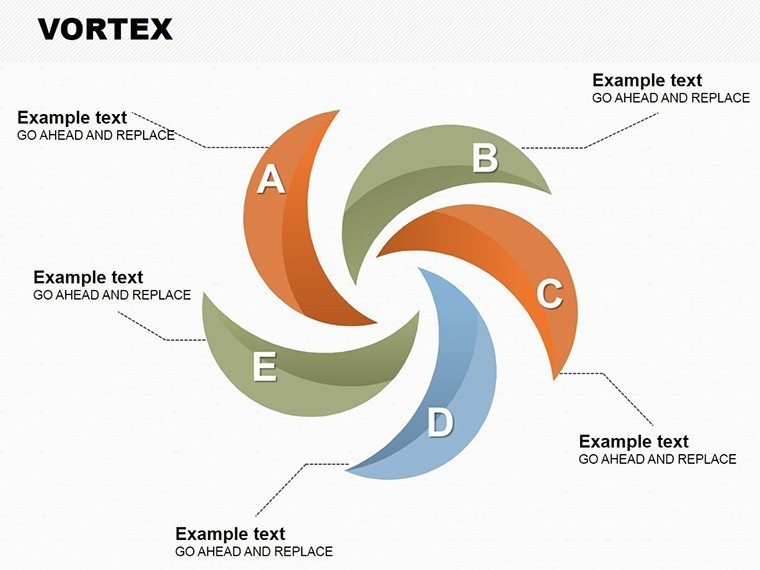
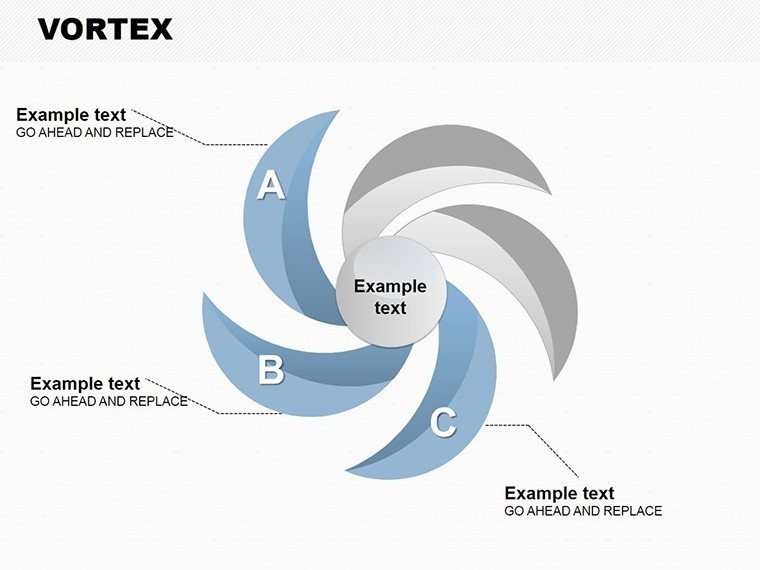
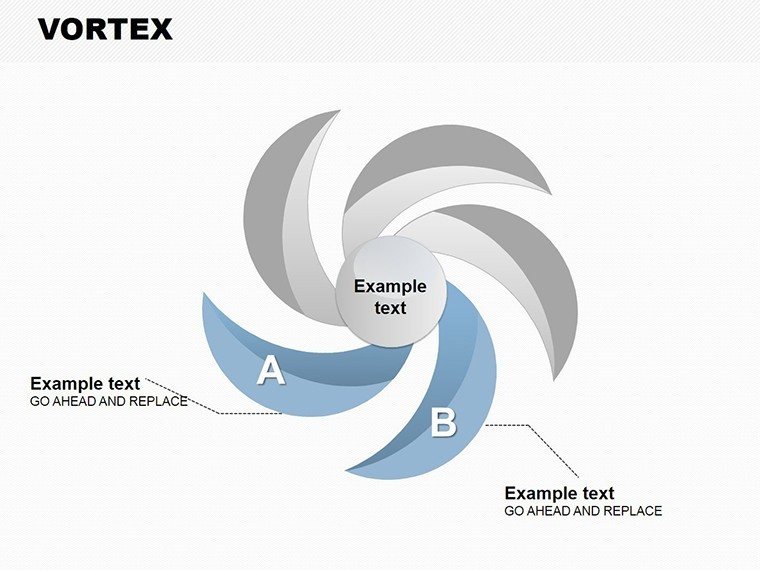
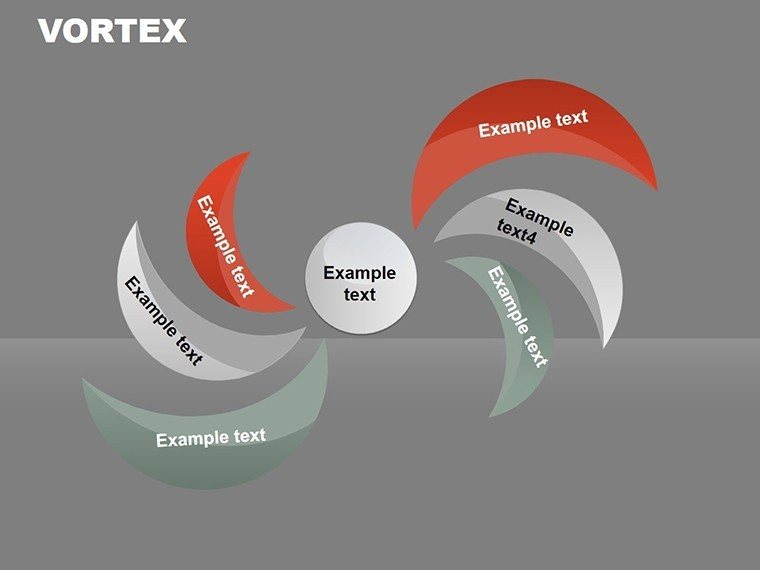
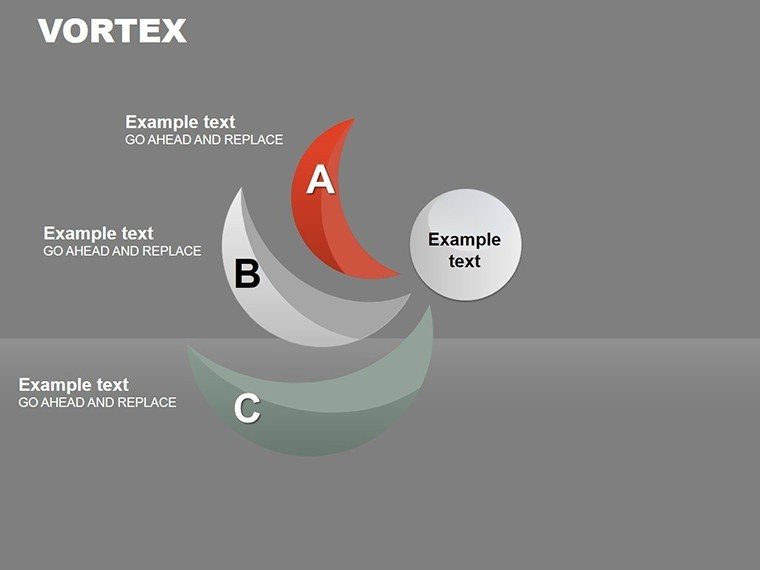
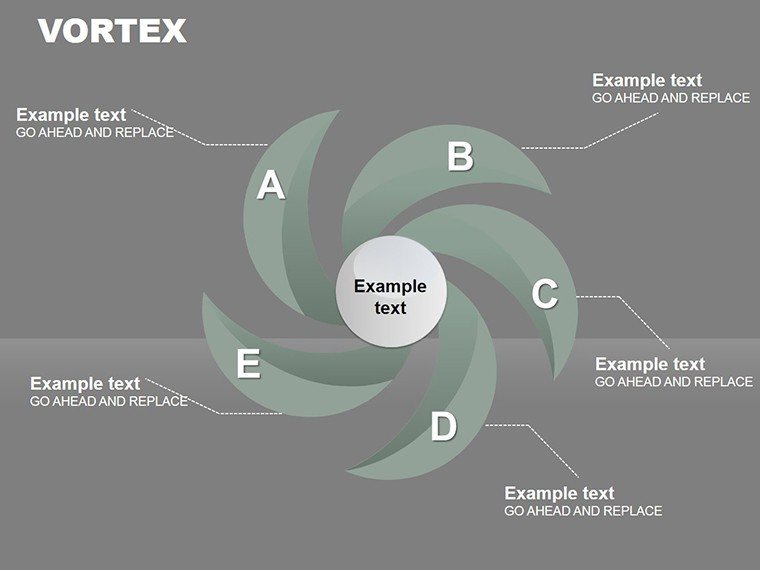
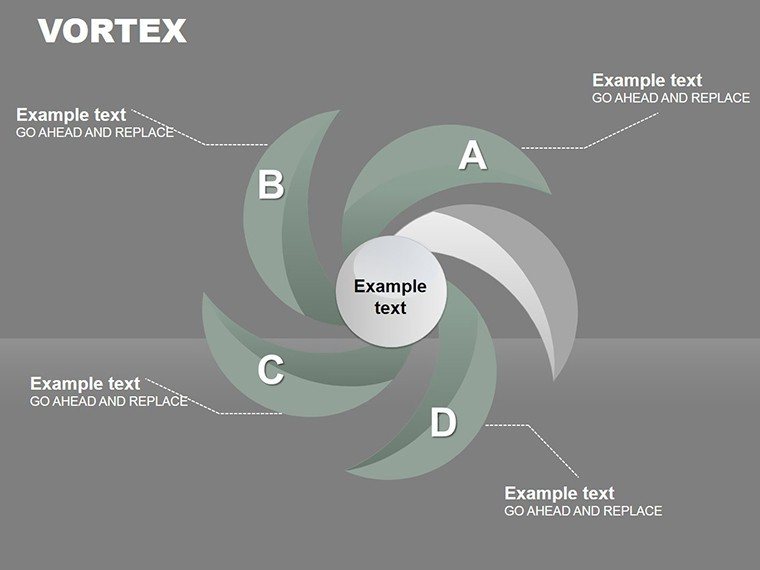
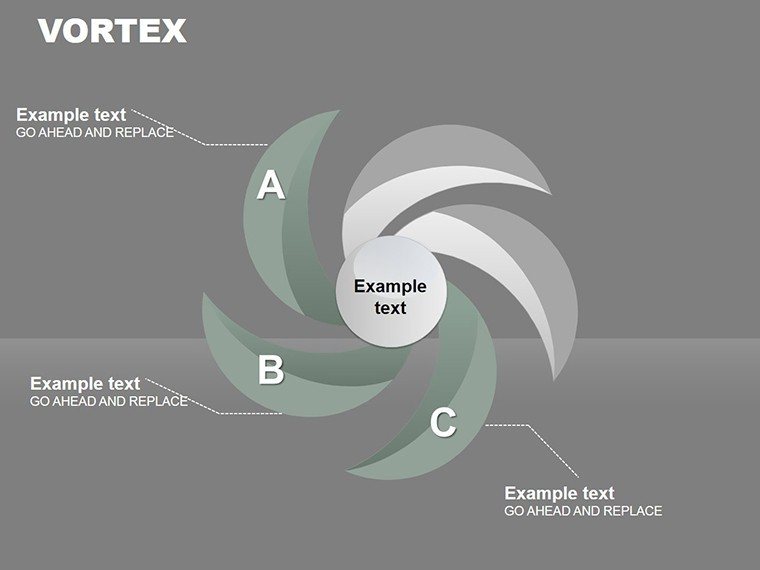
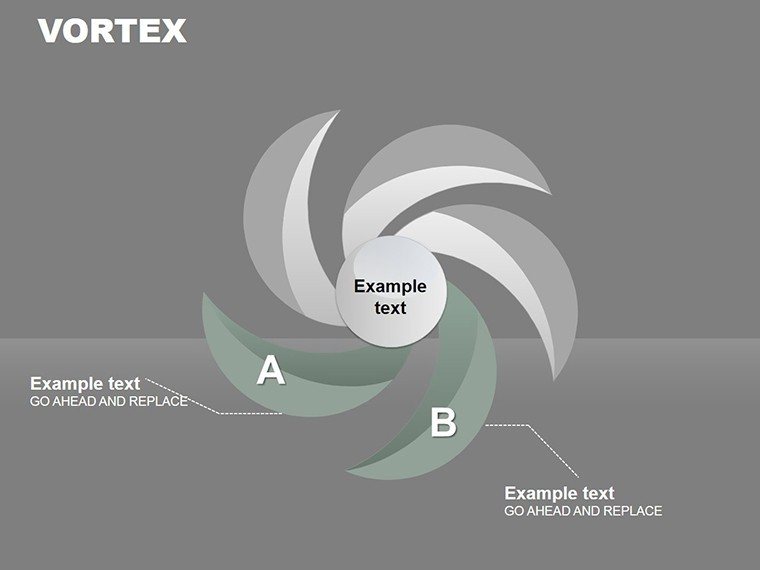
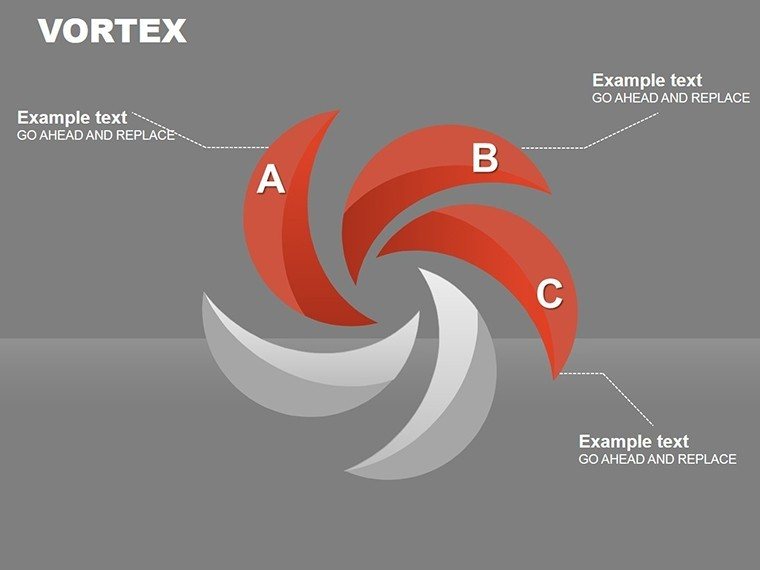
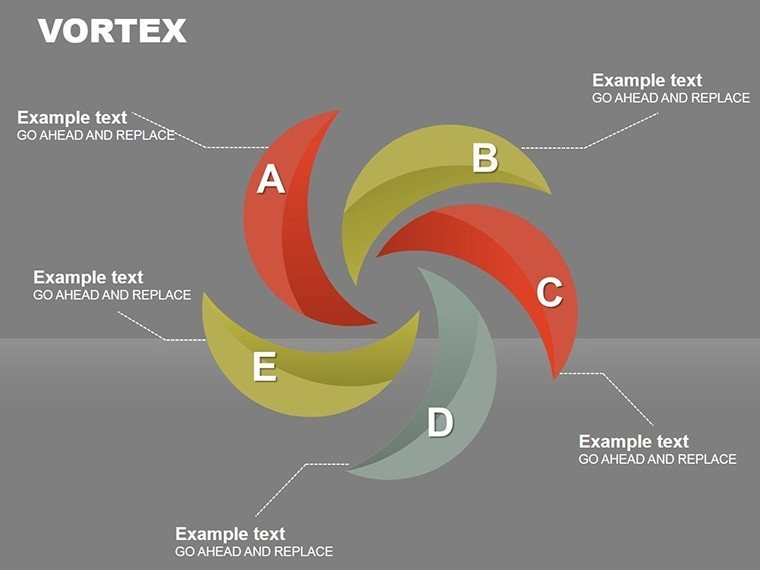
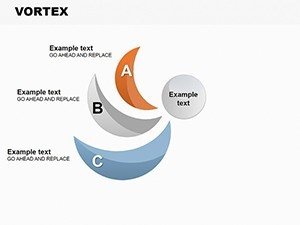
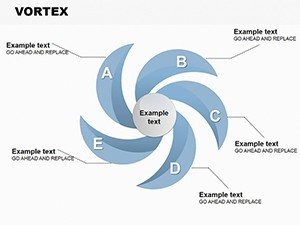
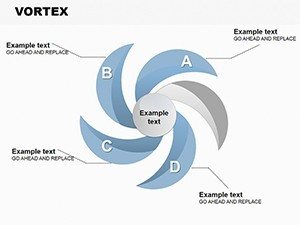
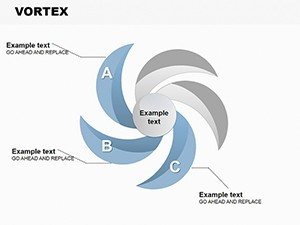
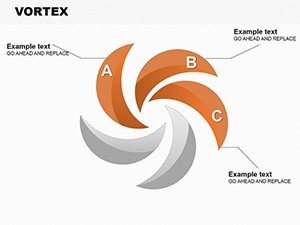
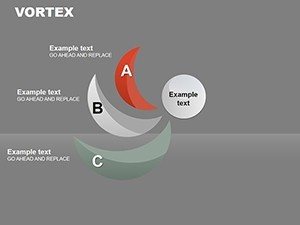
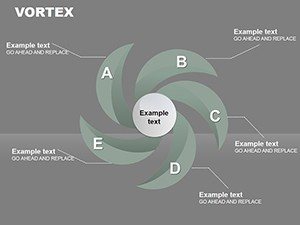
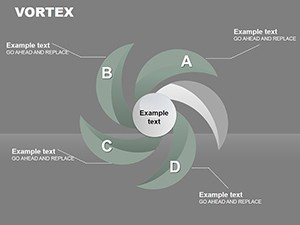
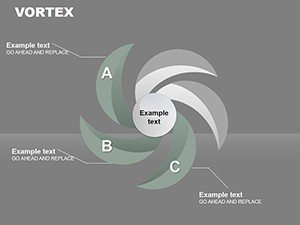
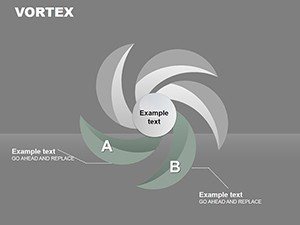
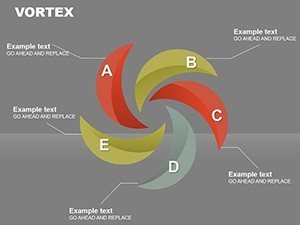
Swirl your audience into a vortex of insightful data with this versatile PowerPoint Charts Template, boasting 16 editable slides designed for cyclical and flow-based visualizations. Tailored for business pros, teachers, and learners, it turns complex processes - like sales cycles or feedback loops - into engaging, easy-to-follow charts. With options for bar, pie, line, and area graphs, plus intuitive customizations, you'll craft presentations that pull viewers in, reinforcing messages with visual force. Compatible with PowerPoint, it's the spin you need for reports, lectures, or pitches that leave a lasting whirl.
The Spin on Cyclical Data Mastery
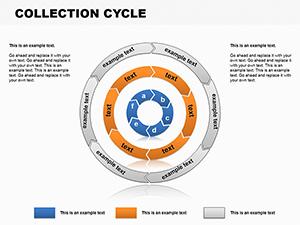
Vortex designs excel at depicting recurring patterns, using spirals or cycles to represent time-based data like daily operations or seasonal trends. This template harnesses that for clear, impactful visuals.
Dynamic Features for Fluid Visuals
- Chart Variety: Bar to area, all editable.
- Easy Tailoring: Match to your data and brand.
- Data Integration: Seamless for compelling stories.
- Intuitive Controls: Edit without hassle.
- High Compatibility: .pptx for versatility.
These support effective techniques like area charts for volume.
Whirling Through Use Cases
From business cycles to educational flows, this template adapts to diverse needs.
Step-by-Step: Visualizing a Feedback Loop
- Pick a cycle slide: For process flows.
- Input stages: Populate with data.
- Customize flow: Add colors and arrows.
- Present with spin: Animate for engagement.
Similar to vortex viz in engineering.
Beyond Basics: Vortex Advantage
Outperforms standard charts with dynamic representations, ideal for complex data.
Tips for Vortex Mastery
- Contextualize: Provide meaningful backgrounds.
- Simplify: Focus on key cycles.
- Use color: For trend highlights.
- Incorporate pros: Like bar for comparisons.
From essential techniques.
Spin Your Success Story
Ready to vortex your data into action? Customize and captivate - download now for presentations that draw in and deliver.
FAQ
What chart types are included?
Bar, pie, line, area, and more for cycles.
Fully customizable?
Yes, resize, recolor, modify easily.
Best for business?
Ideal for reports and pitches.
Slide number?
16 editable slides.
Supports education?
Great for lectures on processes.