Supply Chain Management PowerPoint Charts for Strategic Presentations


Type: PowerPoint Charts template
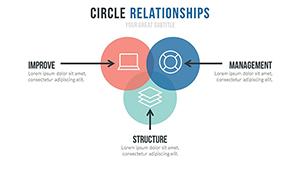
Category: Cycle, Business Models, Pie
Sources Available: .pptx
Product ID: PC00129
Template incl.: 12 editable slides
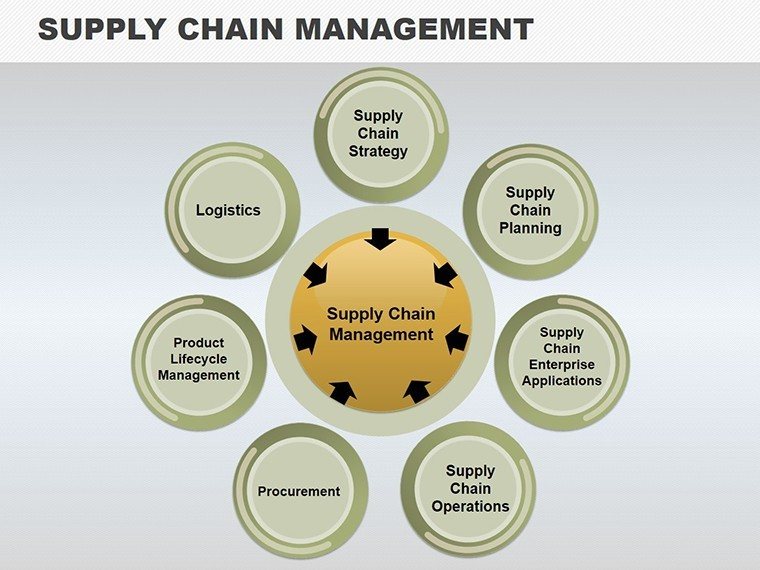
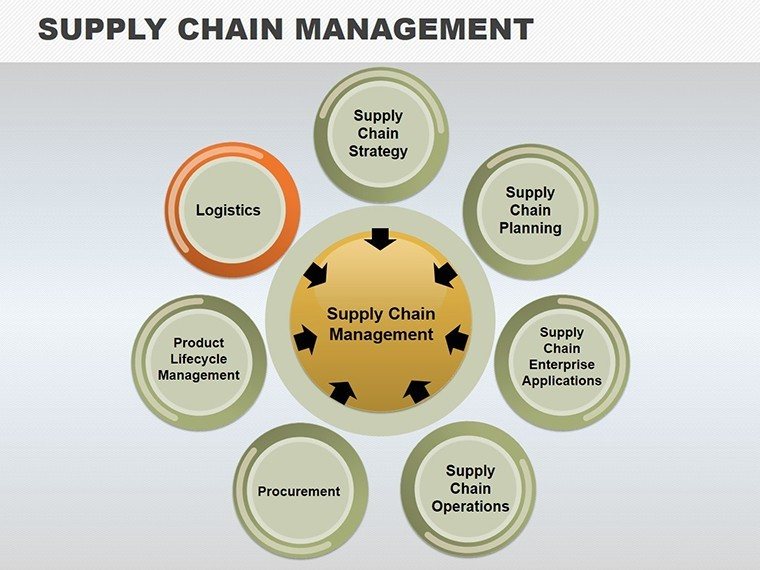
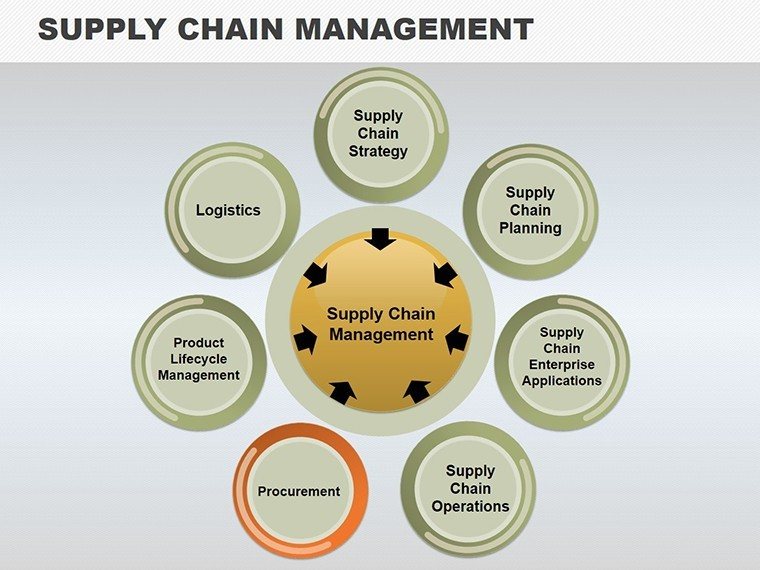
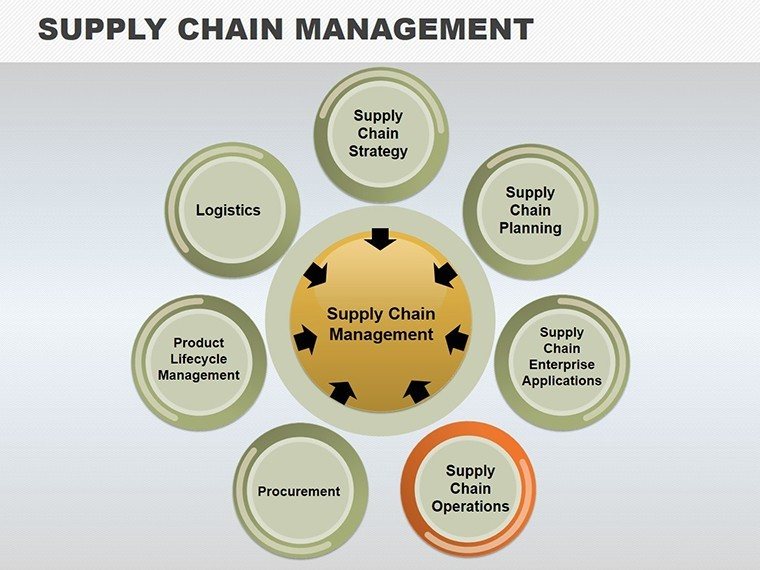
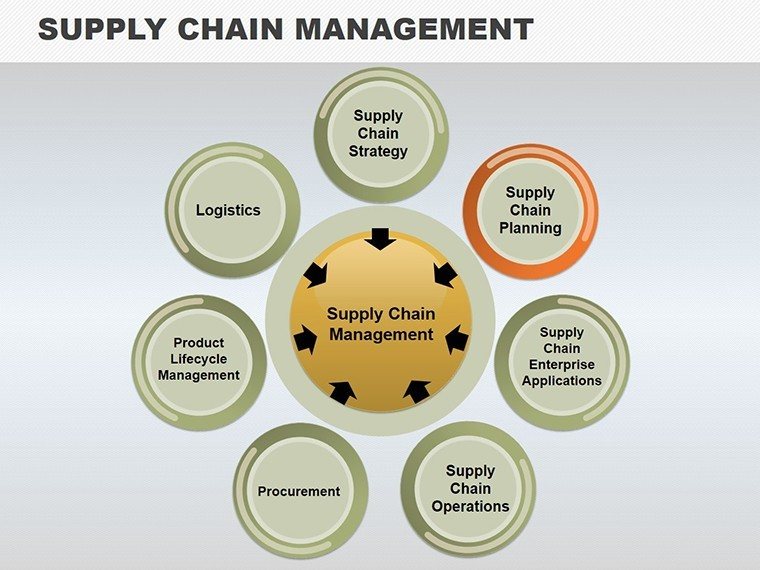
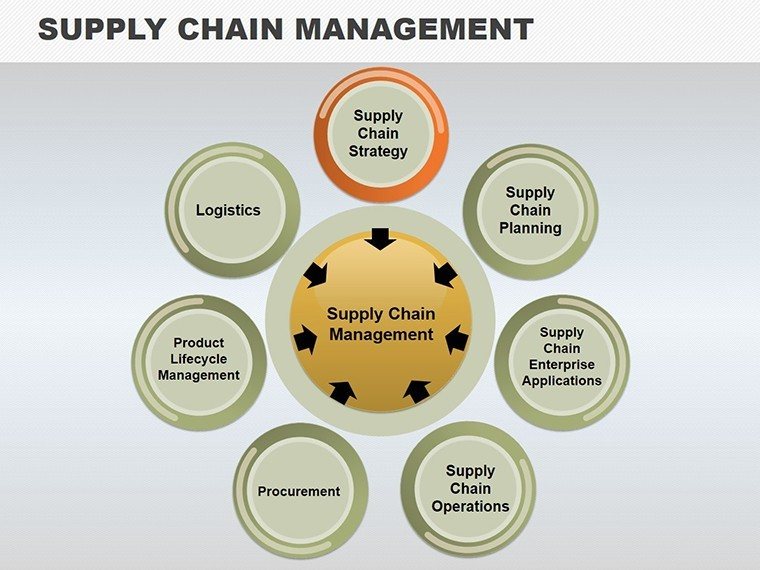
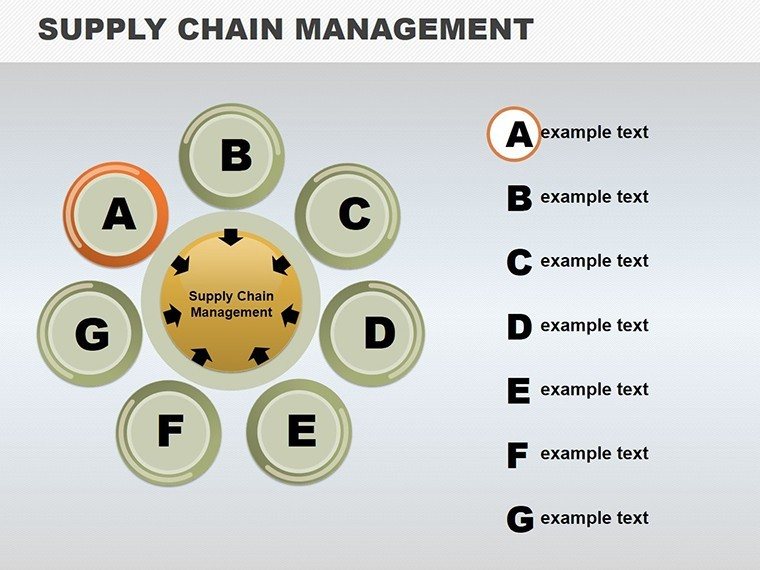
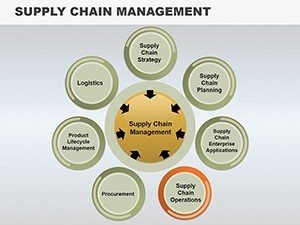
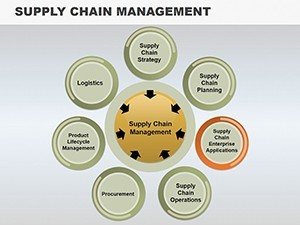
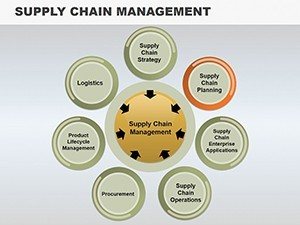
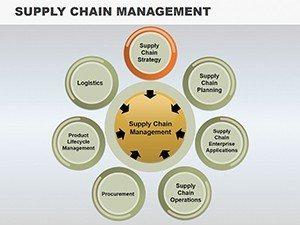
Navigating the complexities of supply chain management demands tools that clarify rather than confuse. Our Supply Chain Management PowerPoint charts template, featuring 12 editable slides, is engineered to do just that - transforming intricate processes into straightforward, visually compelling stories. Ideal for logistics experts, operations managers, and consultants who juggle supplier networks, inventory flows, and distribution channels, this template draws on cycle diagrams, pie charts, and business model visuals to map out end-to-end operations. Picture illustrating a global supply chain's bottlenecks during a stakeholder meeting, using color-coded cycles to pinpoint efficiencies and risks. Compatible with PowerPoint and Google Slides, it offers drag-and-drop editing for quick adaptations, ensuring your presentations align with real-time data shifts. Rooted in supply chain best practices from bodies like the Council of Supply Chain Management Professionals (CSCMP), this resource not only saves design time but also amplifies your message, fostering better collaboration and informed strategies in an ever-evolving market.
Core Features That Drive Clarity
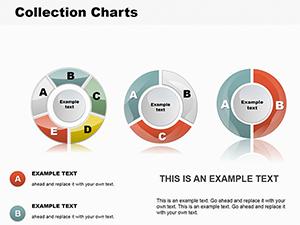
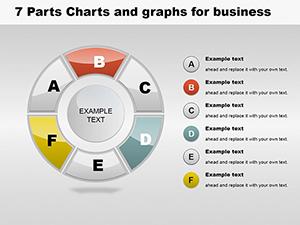
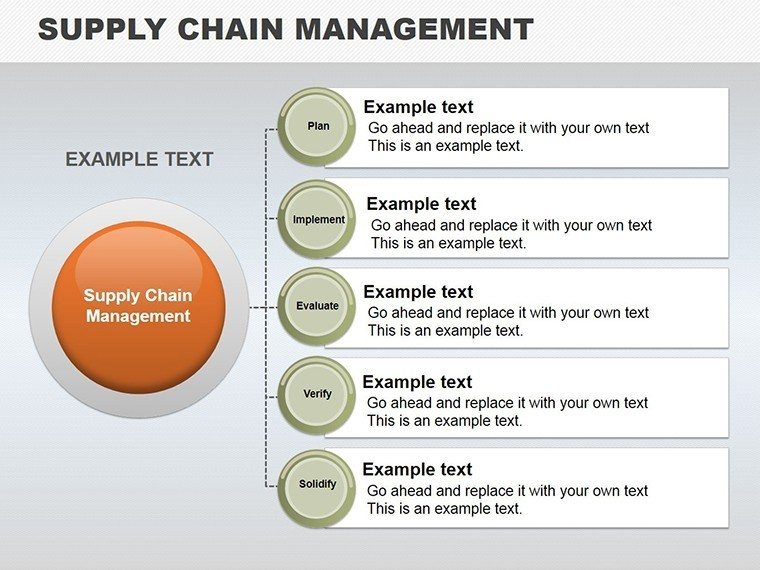
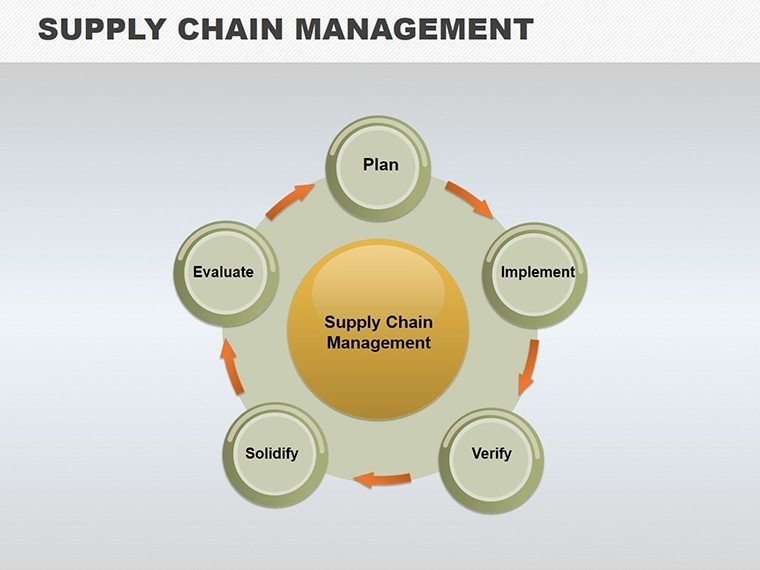
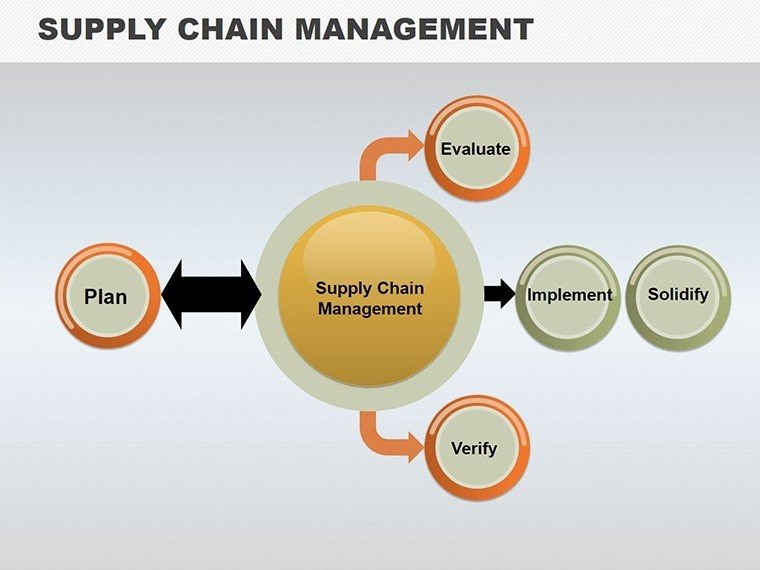
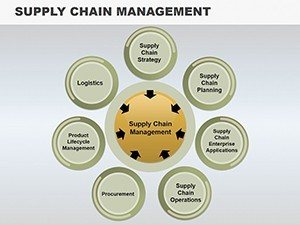
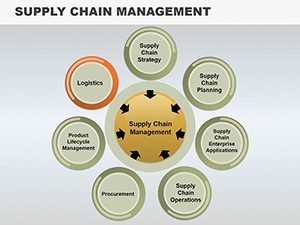
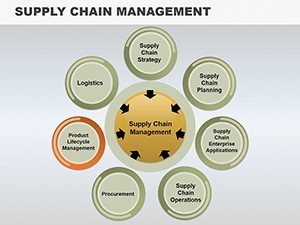
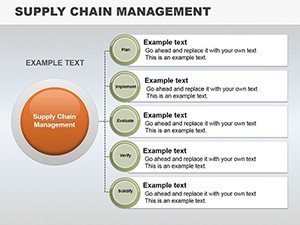
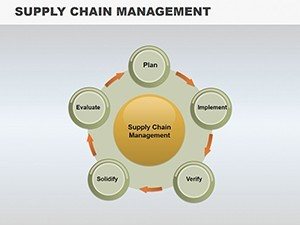
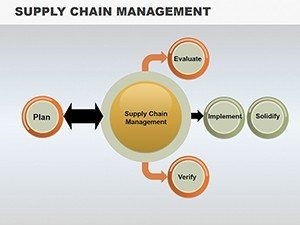
At the heart of this template are its visually engaging designs, which break down supply chain elements into intuitive graphics. For example, cycle charts depict procurement-to-delivery loops, while pie charts allocate costs across transportation, warehousing, and manufacturing. Each slide supports high-resolution exports, perfect for printed reports or digital shares.
Tailored Customization for Your Needs
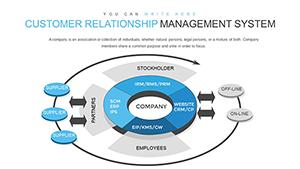
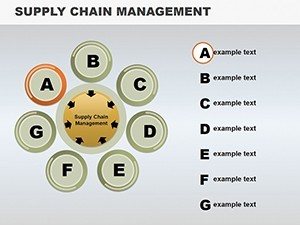
Customization is seamless: alter layouts to reflect your company's supply chain maturity model, incorporate icons for nodes like vendors or customers, and adjust scales for global vs. local views. A real-world example might involve a manufacturing firm using a slide to visualize just-in-time inventory, reducing waste as per Lean principles.
Benefits Tailored to Supply Chain Dynamics
This template's benefits shine in high-stakes environments. It empowers audiences to grasp concepts quickly, leading to faster consensus on improvements. Unlike generic charts, these are optimized for supply chain narratives, incorporating LSI elements like risk mitigation and sustainability metrics, enhancing search visibility and user relevance.
Outperforming Basic Tools
Compared to standard PowerPoint offerings, our charts include layered data views and interactive hyperlinks, allowing drill-downs into specifics like vendor performance scores.
Diverse Use Cases in Action
For supply chain professionals, deploy it in audits to chart compliance flows, as seen in a case where a retailer optimized routes, cutting costs by 15%. Educators can simplify topics like bullwhip effects for students, using animated cycles to demonstrate amplification. Consultants might present client benchmarks, contrasting current states with optimized models to justify recommendations.
- Download and import data from ERP systems.
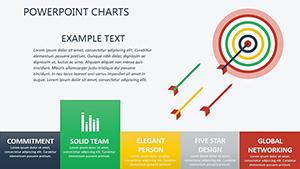
- Customize visuals to highlight key performance indicators.
- Incorporate feedback loops for iterative refinements.
- Present with confidence, backed by data-driven designs.
Workflow Enhancements
Integrate with tools like SAP or Oracle for live data pulls, or embed in dashboards for ongoing monitoring, aligning with agile supply chain methodologies.
Pro Tips for Supply Chain Mastery
Maximize impact by layering data ethically, avoiding overload; use consistent legends for multi-slide coherence; and reference CSCMP guidelines for ethical sourcing visuals. In volatile markets, update slides quarterly to reflect trends like nearshoring.
Step up your supply chain storytelling - download these PowerPoint charts today and orchestrate seamless operations.
Frequently Asked Questions
How customizable are the cycle charts?
Fully customizable, including colors, stages, and labels to fit your specific supply chain model.
Does it support data import from Excel?
Yes, easily link to Excel sheets for automatic updates in charts.
Is this suitable for virtual training sessions?
Absolutely, with animations and clear layouts optimized for screen sharing.
What categories of charts are included?
Cycle, pie, and business model charts tailored for supply chain visuals.