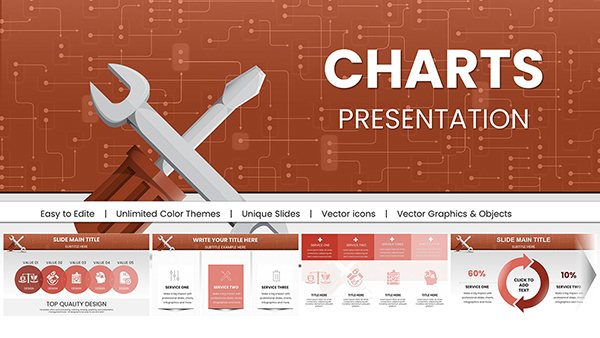
Financial Icons PowerPoint Charts Template: Visual Finance Pro


Type: PowerPoint Charts template
Category: Analysis
Sources Available: .pptx
Product ID: PC00128
Template incl.: 26 editable slides
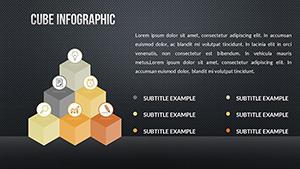
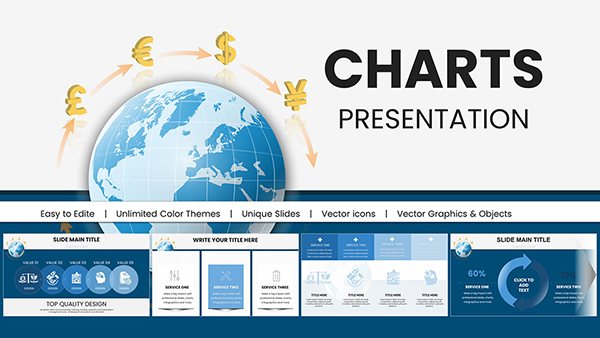
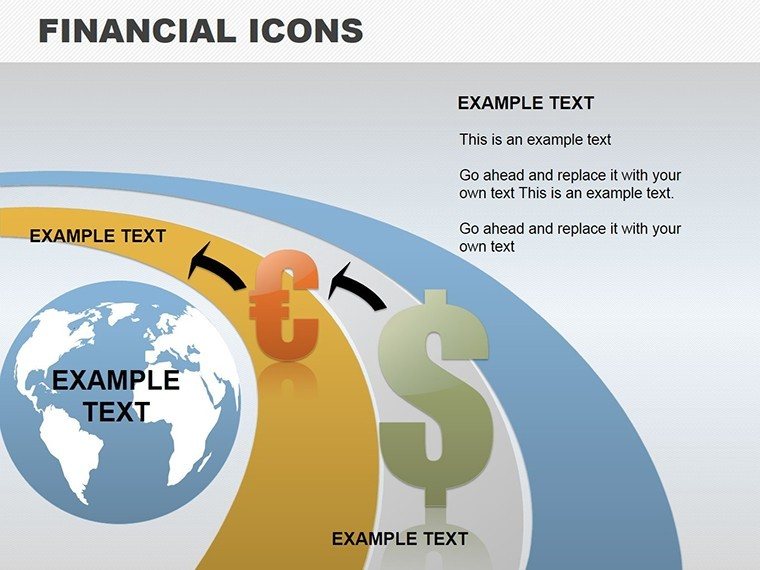
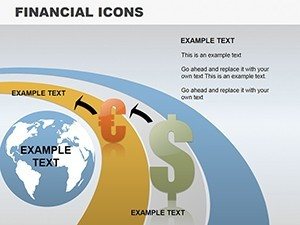
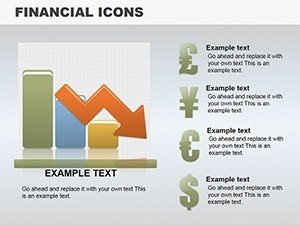
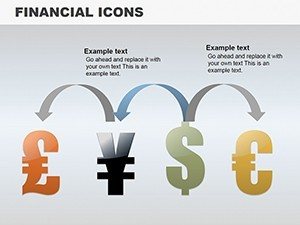
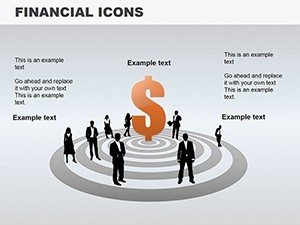
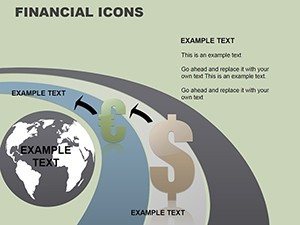
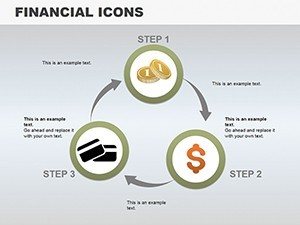
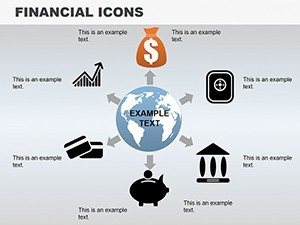
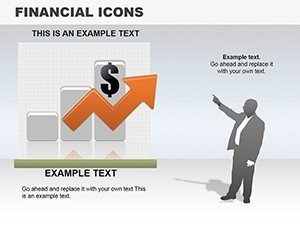
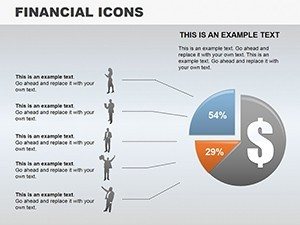
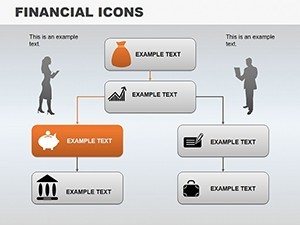
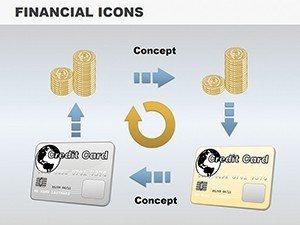
In the realm of finance, where numbers dominate but visuals persuade, our Financial Icons PowerPoint Charts template stands as a pivotal asset. With 26 editable slides packed with thematic icons - from currency symbols to growth arrows - this tool is designed for conveying fiscal narratives with impact. Echoing principles from financial visualization gurus like those at the CFA Institute, it prioritizes clarity and precision to avoid misinterpretation. Envision an investment banker illustrating portfolio performances in a client review, or an educator breaking down economic theories for students - these elements make abstract concepts tangible. More than a time-saver, it enhances your authority by integrating professional icons that align with industry standards. Compatible across PowerPoint and Google Slides, it's suited for global teams. Step into presentations that not only inform but inspire confidence, transforming your financial data into compelling, trustworthy stories.
Empower Your Narratives with Icon-Infused Charts
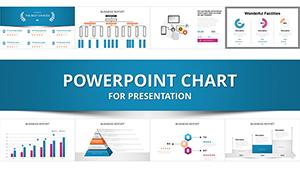
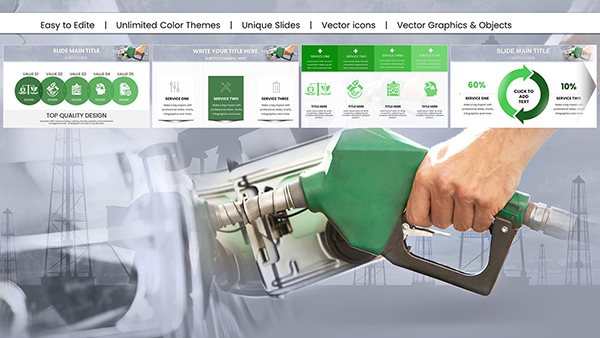
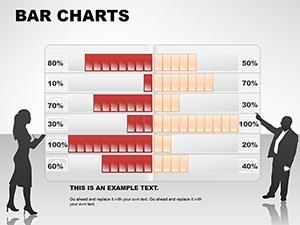
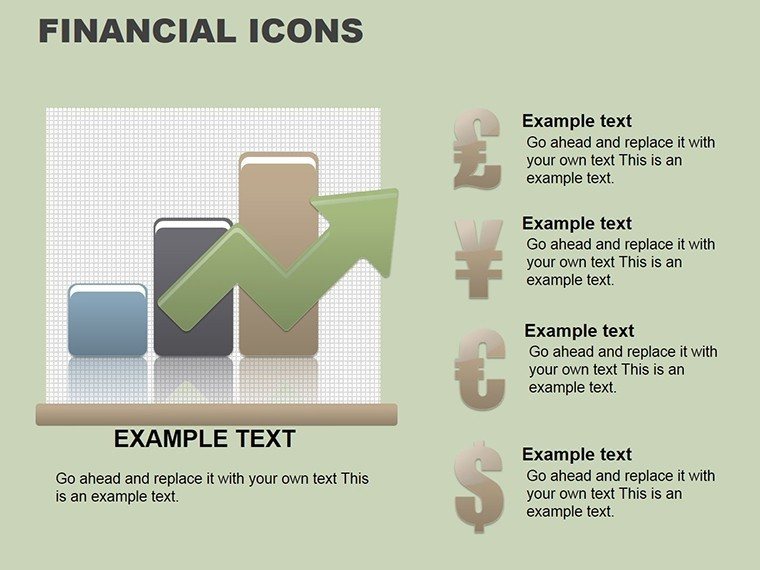
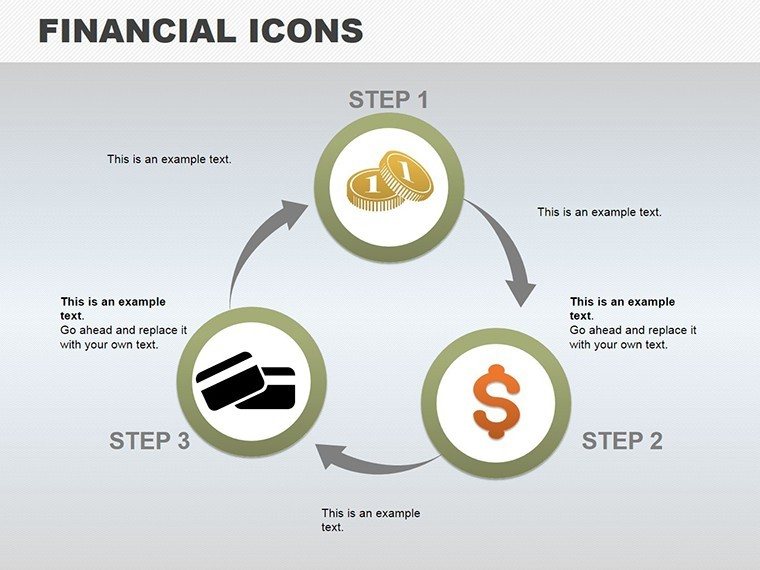
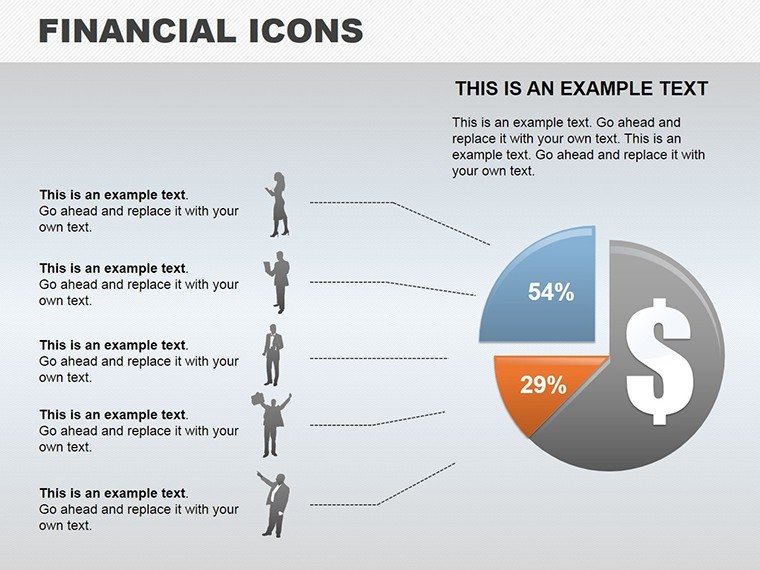
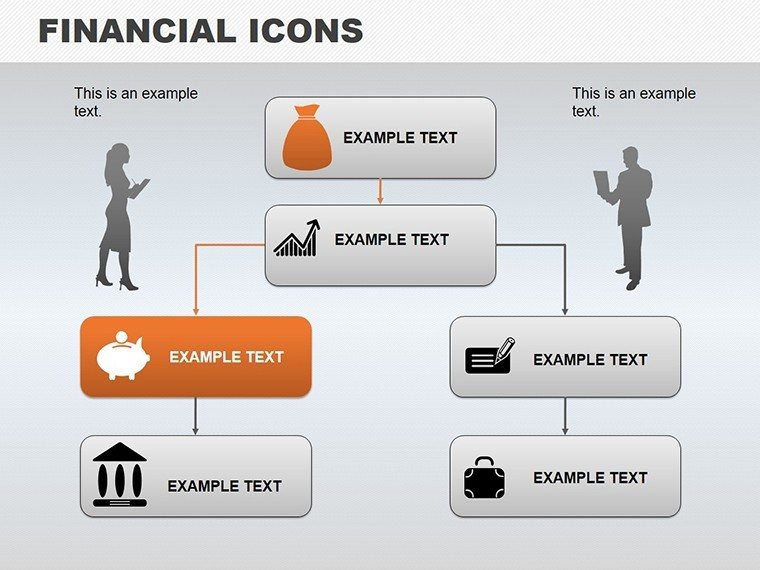
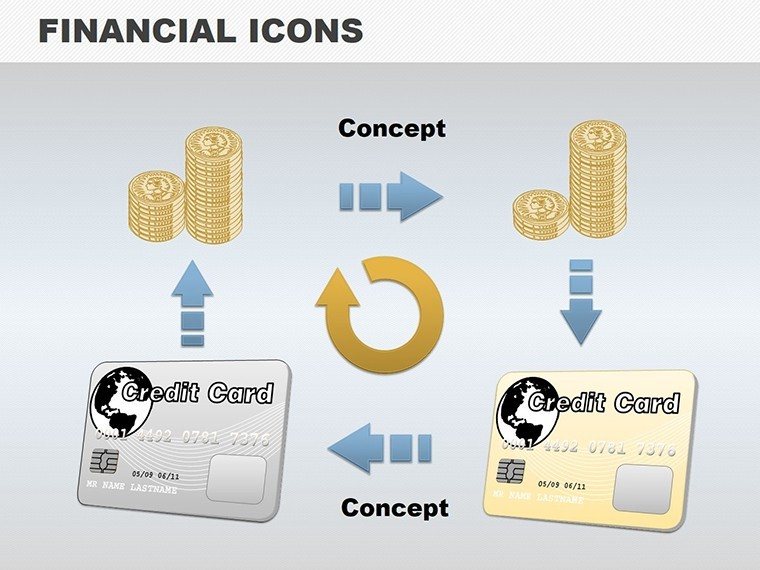
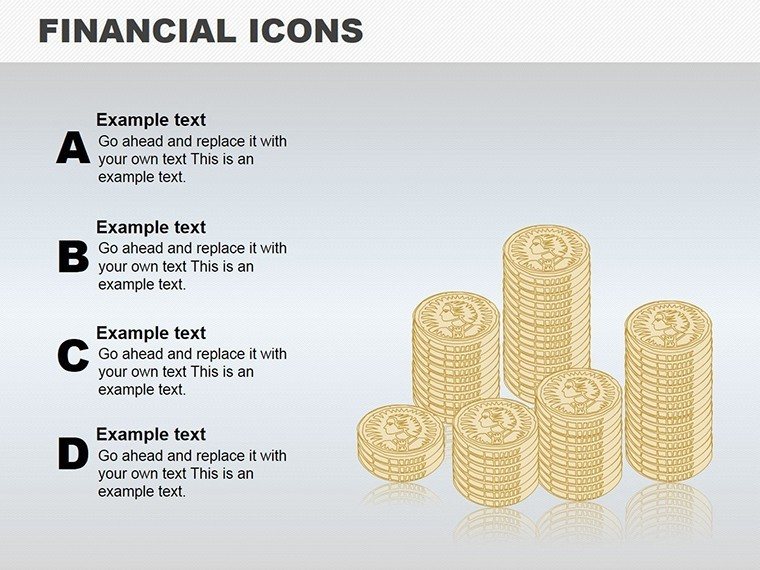
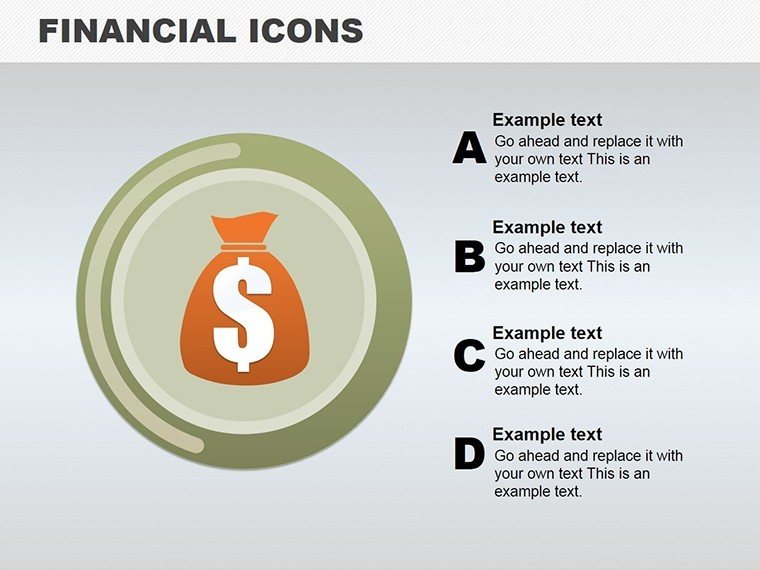
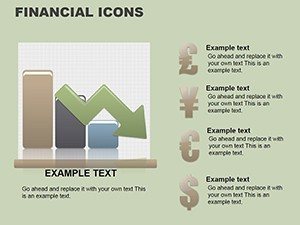
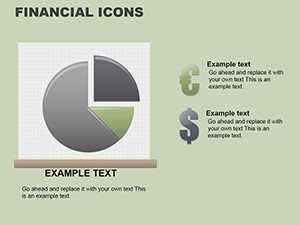
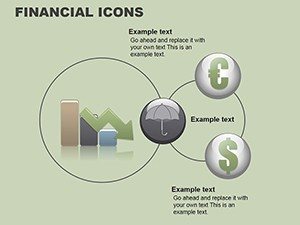
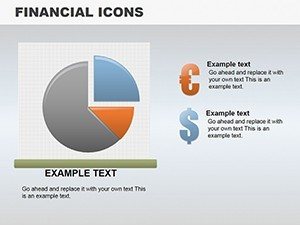
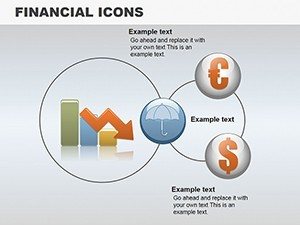
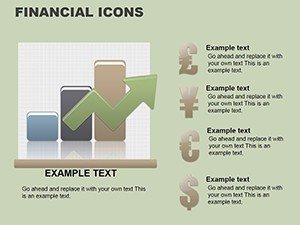
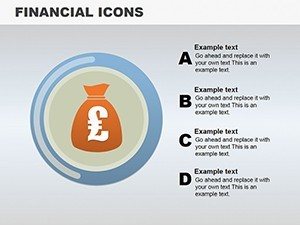
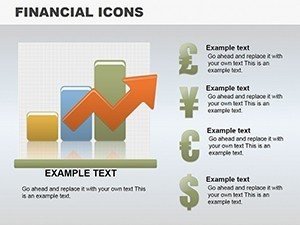
This template merges diverse chart types - lines for trends, bars for comparisons, pies for compositions - with a library of financial icons for enriched context. Customize icons by resizing or recoloring to fit themes, like gold tones for wealth management. The interface allows drag-and-drop placement, surpassing basic PowerPoint's rigidity. In a case from JPMorgan reports, similar icon-enhanced visuals clarified market volatilities, aiding investor decisions. The 26 slides include hybrids, like icon-annotated timelines for fiscal year overviews, providing comprehensive coverage.
Standout Benefits for Financial Experts
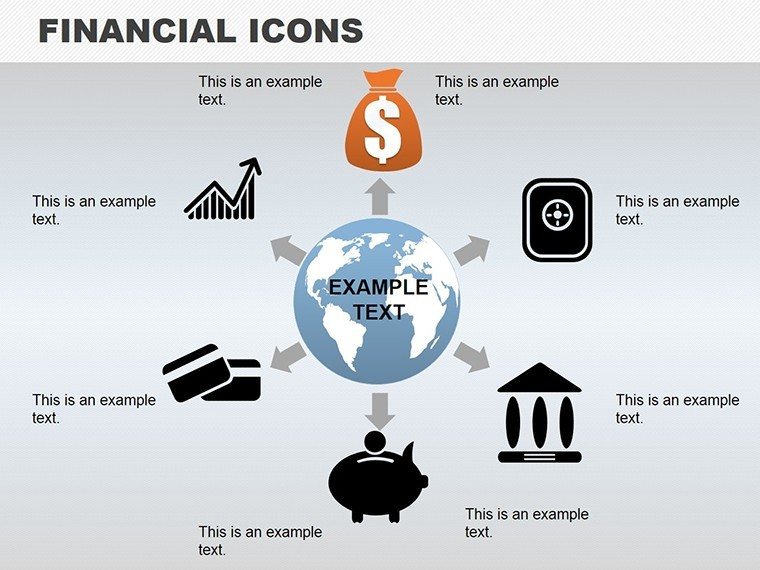
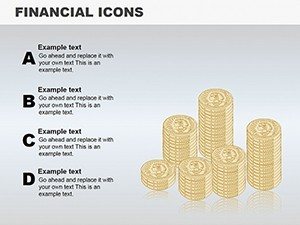
- Icon Variety: Over 100 finance-specific symbols for nuanced expressions.
- Chart Diversity: Mix and match types for multifaceted analyses.
- Easy Edits: No coding needed; intuitive tools for quick changes.
- High Resolution: Vector graphics scale without loss for prints or screens.
- Theme Consistency: Pre-matched palettes for professional cohesion.
These solve issues like bland defaults, fostering engaging, credible outputs. For consultants, iconify risk assessments, enhancing client trust.
Broad Applications in Finance and Beyond
Apply this for earnings calls, budgeting sessions, or compliance trainings. In auditing, use icons to flag variances; in education, simplify balance sheets. Steps: Select chart base. Add relevant icons. Input data. Style for audience. Animate for emphasis. Share securely. Akin to AIA documentation, structure financial plans visually. LSI like "icon-based financial infographics" integrates smoothly.
Practical Customization Workflow
- Browse slide options.
- Insert data and icons.
- Adjust layouts.
- Apply animations.
- Review and export.
This efficiency boosts productivity, as users note.
Advantage Against Generic Options
Outclasses basics with icon depth and flexibility. Subtle CTAs like "Visualize Finance Now" motivate. Example: A fintech startup used for pitch decks, securing ventures per TechCrunch.
Amplify your financial voice - download this icons template and shine.
Frequently Asked Questions
How many icons are included?
Over 100, covering finance essentials.
Can I edit icons?
Yes, fully customizable in size, color, position.
Suitable for Mac users?
Absolutely, via PowerPoint for Mac.
Integrate with data sources?
Yes, link to Excel for live updates.
License for multiple users?
Team licenses available upon request.
Refund policy?
Satisfaction guaranteed; contact support.