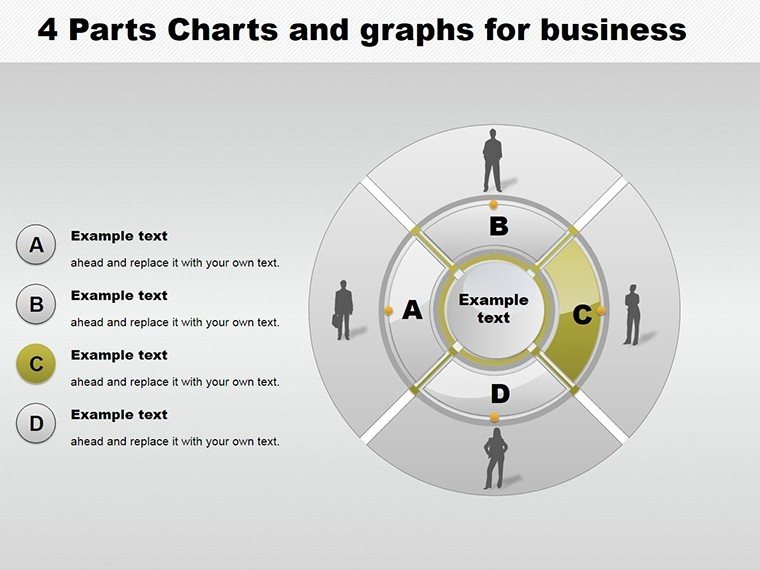
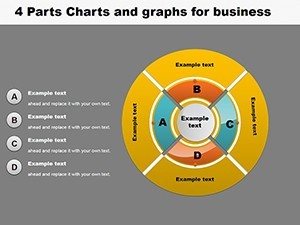
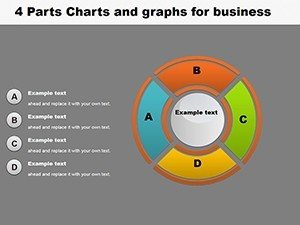
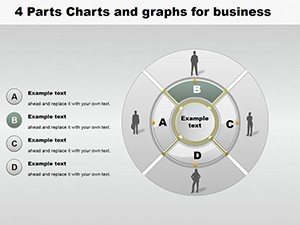
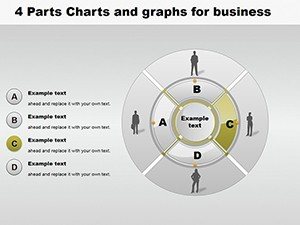
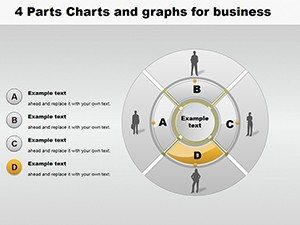
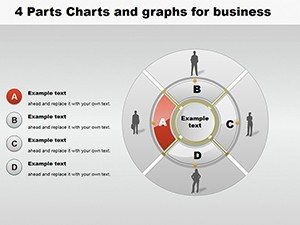
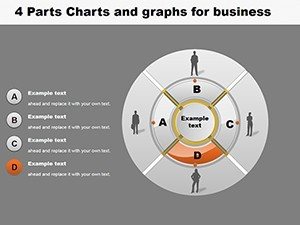
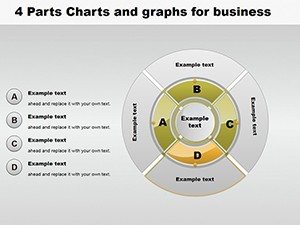
4-Part Pie Chart PowerPoint Template for Engaging Business Presentations


Type: PowerPoint Charts template
Category: Pie, Organizational
Sources Available: .pptx
Product ID: PC00118
Template incl.: 22 editable slides
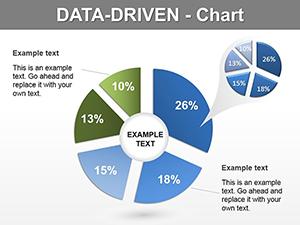
In the fast-paced world of business, where decisions hinge on clear data interpretation, our 4-part pie chart PowerPoint template stands out as a game-changer. Designed specifically for professionals who need to break down complex information into digestible segments, this template offers 22 fully editable slides that turn raw numbers into compelling visual narratives. Imagine presenting market share distributions, budget allocations, or performance metrics in a way that not only informs but also engages your audience - whether it's a boardroom full of executives or a virtual meeting with stakeholders. Tailored for seamless integration with PowerPoint and Google Slides, it ensures compatibility across platforms, saving you precious time on formatting. With a focus on user-friendly customization, you can adjust colors to match your brand palette, tweak fonts for readability, and resize elements without losing quality. This isn't just a template; it's a toolkit for elevating your communication strategy, drawing from best practices in data visualization inspired by experts like Edward Tufte, who emphasized clarity and efficiency in graphical displays. Whether you're an entrepreneur pitching to investors or a marketing manager showcasing campaign results, this resource empowers you to deliver presentations that resonate and drive action.
Elevate Your Data Visualization Game
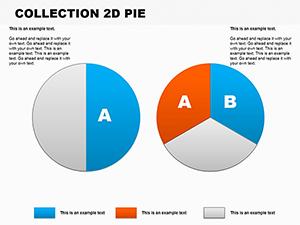
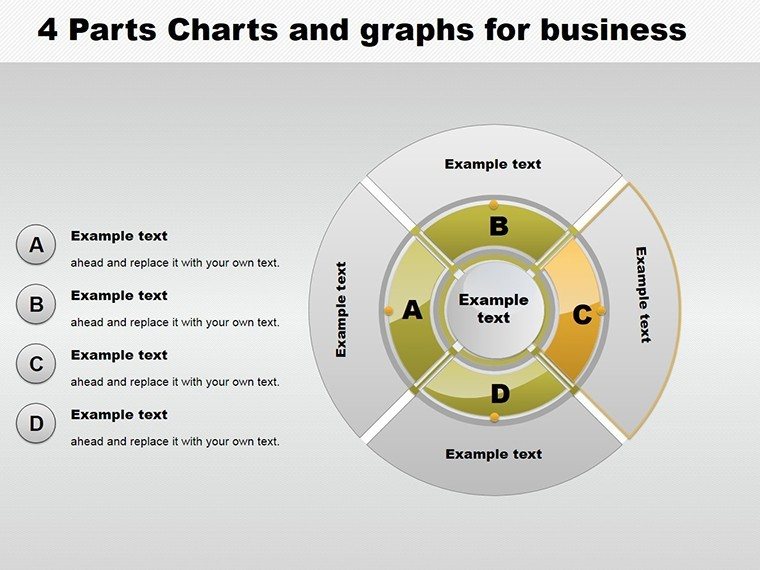
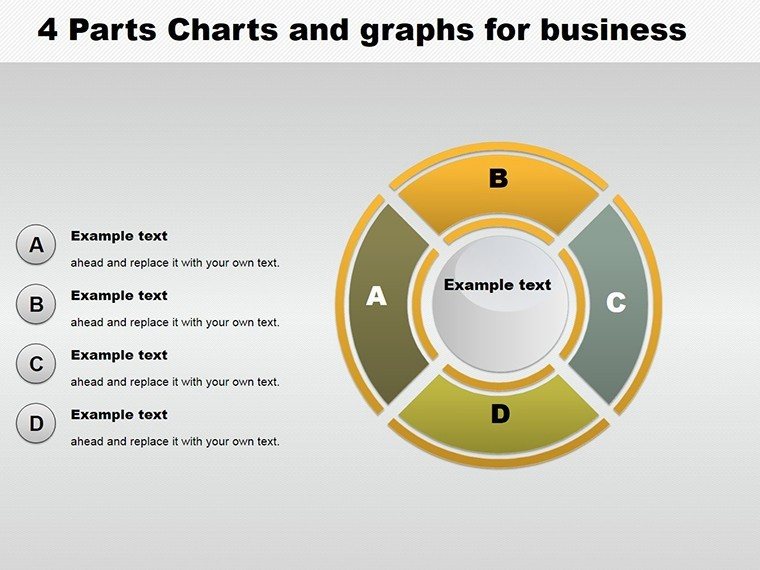
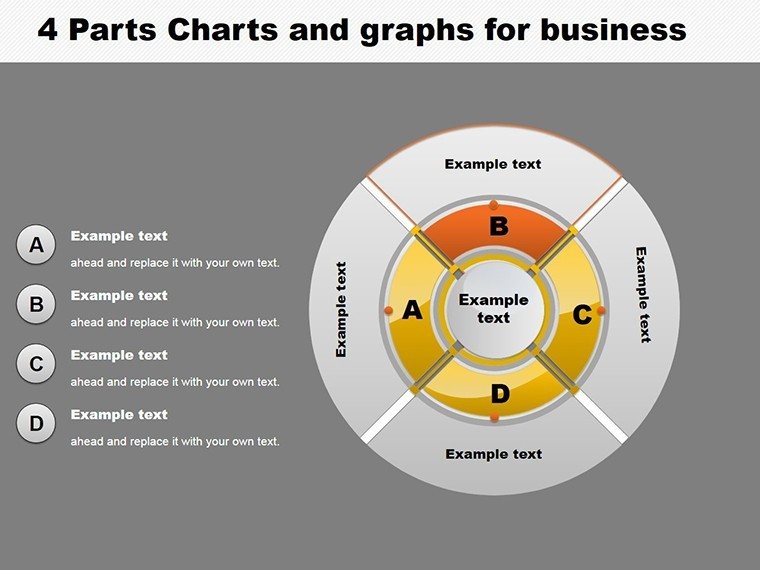
Diving deeper, the core strength of this 4-part pie chart template lies in its ability to simplify multifaceted data sets. Each slide is meticulously crafted to highlight proportions within a whole, making it ideal for scenarios where understanding relative contributions is key. For instance, in a financial report, you could use one slide to depict revenue streams from four primary sources - products, services, subscriptions, and partnerships - allowing viewers to grasp imbalances at a glance. The template incorporates subtle animations that reveal segments sequentially, building suspense and aiding in storytelling during live presentations. Beyond aesthetics, it adheres to accessibility standards, ensuring high contrast ratios for color-blind audiences and alt text compatibility for screen readers, demonstrating our commitment to inclusive design principles.
Customization at Your Fingertips
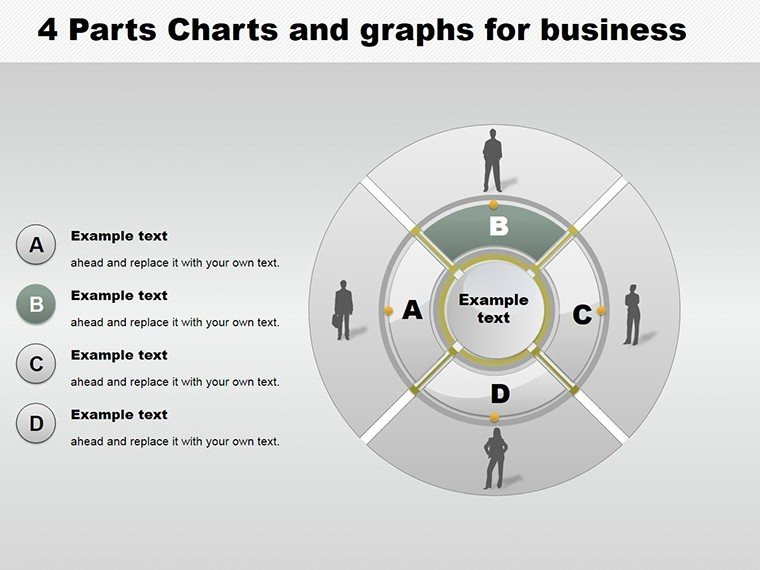
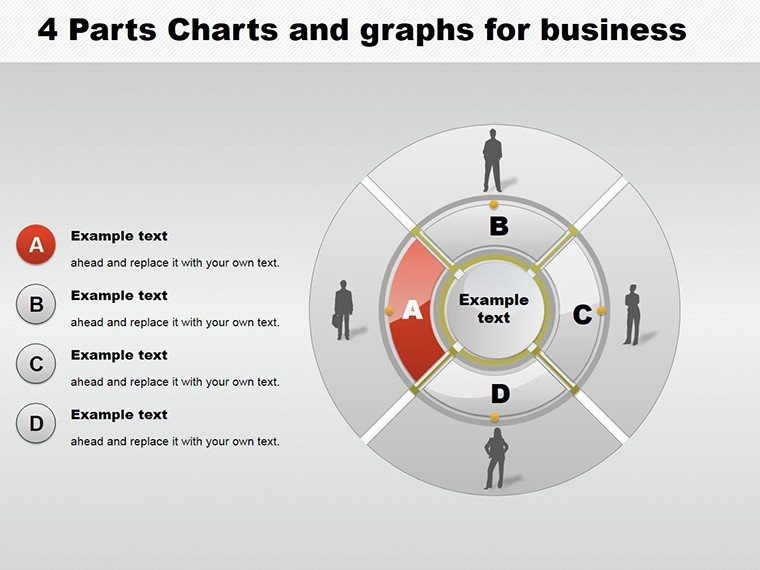
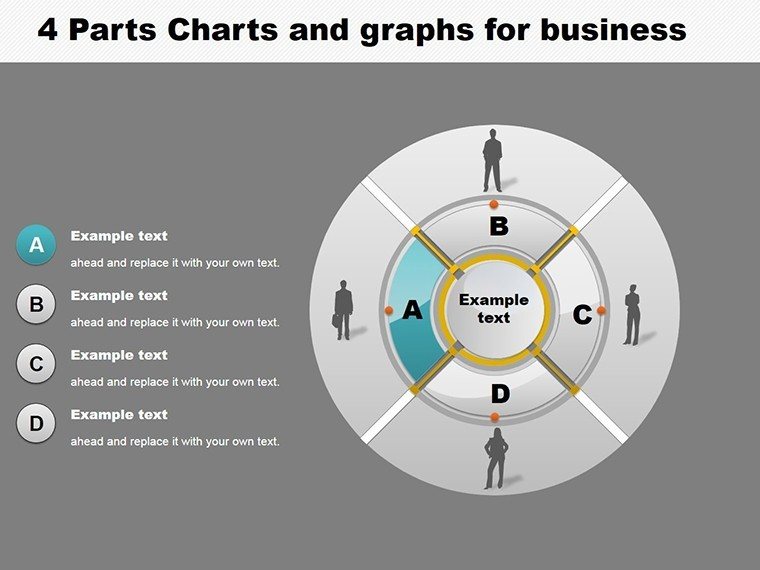
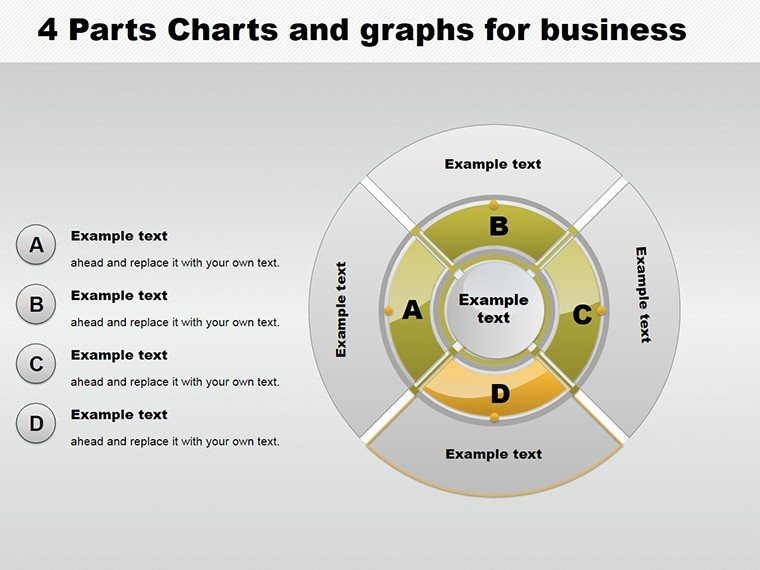
One of the standout features is the extensive customization options. Users can effortlessly modify the pie segments' labels, add data-driven tooltips, or even integrate icons representing each part for added visual flair. Drawing from real-world applications, consider how a startup founder might adapt a slide to show equity distribution among founders, investors, employees, and reserves, aligning with venture capital presentation norms. This flexibility extends to theme variations, with options for light and dark modes to suit different presentation environments, from brightly lit conference rooms to dimmed webinar settings.
Unlocking Benefits for Business Professionals
The benefits extend far beyond mere visuals. By using this template, you save hours that would otherwise be spent wrestling with PowerPoint's default tools, which often result in bland, uninspiring charts. Instead, leverage pre-built layouts that incorporate modern design trends, such as flat design elements combined with subtle gradients for depth. This professional polish can enhance your credibility; studies from the Harvard Business Review suggest that well-designed visuals increase audience retention by up to 65%. Moreover, the template's scalability means it works for small team huddles or large-scale conferences, adapting to your needs without compromising quality.
Compared to Standard PowerPoint Charts
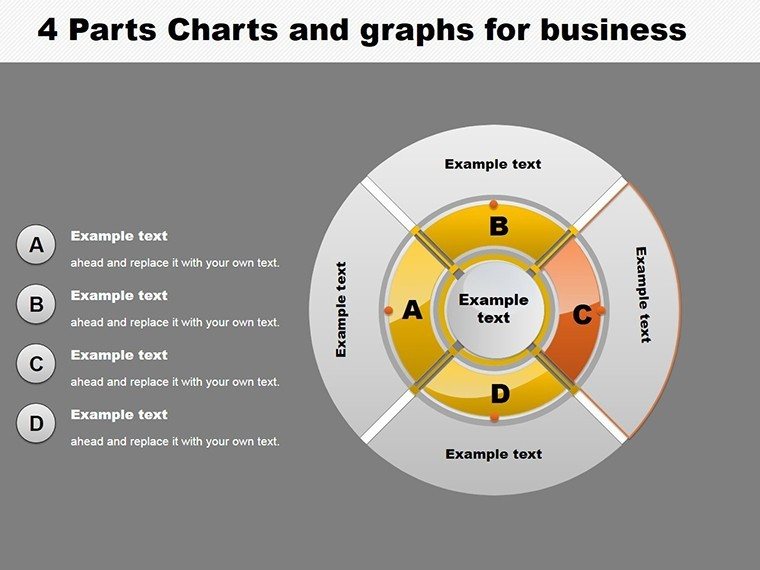
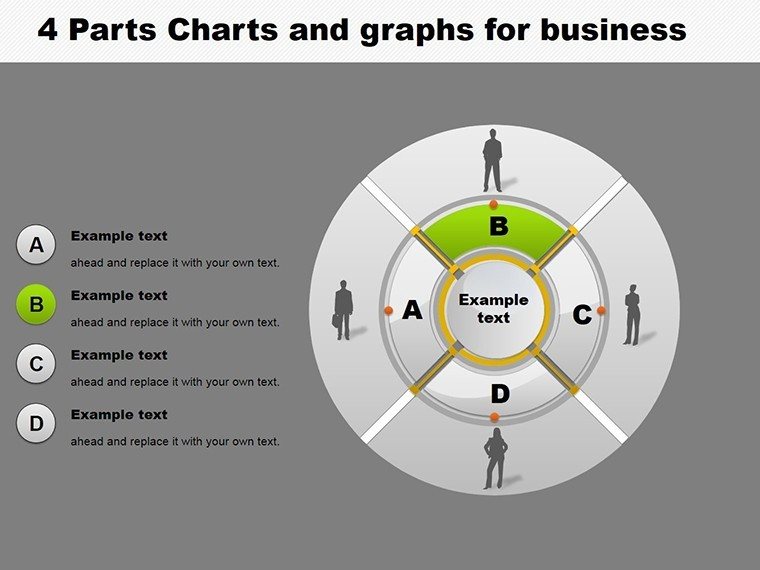
Unlike basic PowerPoint pie charts that feel static and outdated, our template introduces dynamic elements like exploded segments for emphasis and data labels that update automatically with input changes. This automation reduces errors and streamlines updates, a boon for iterative processes like quarterly reviews.
Real-World Use Cases and Applications
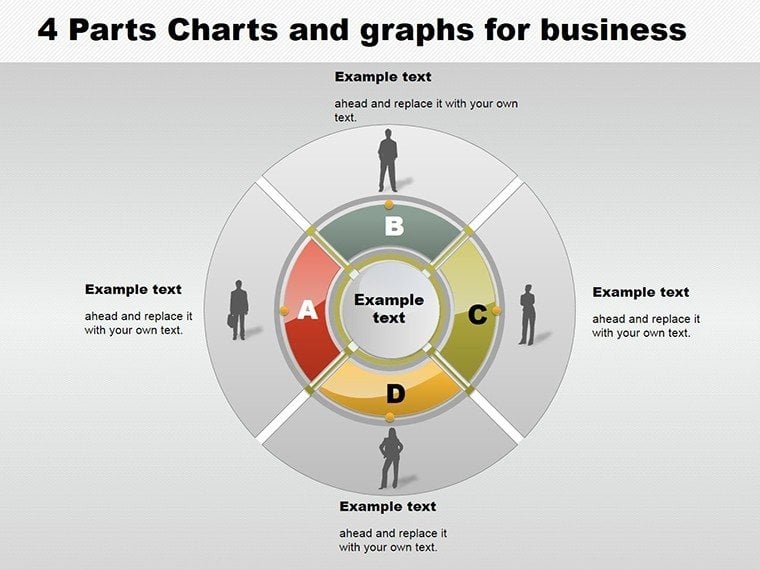
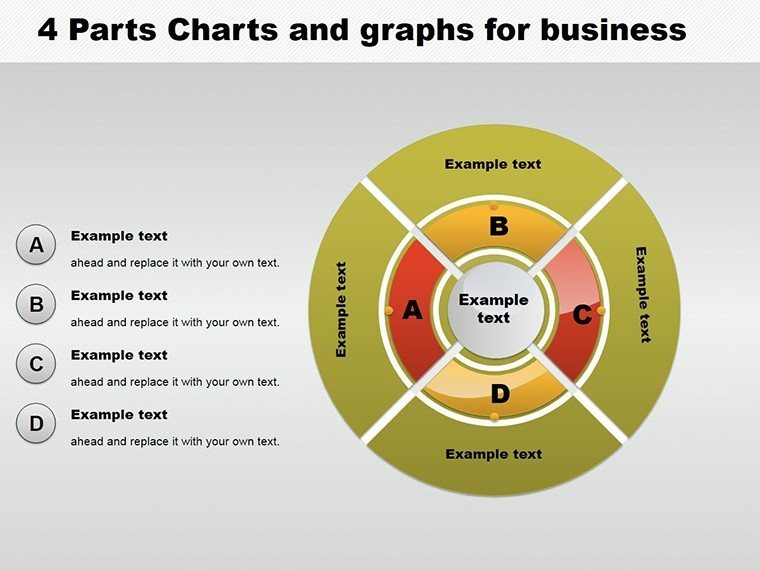
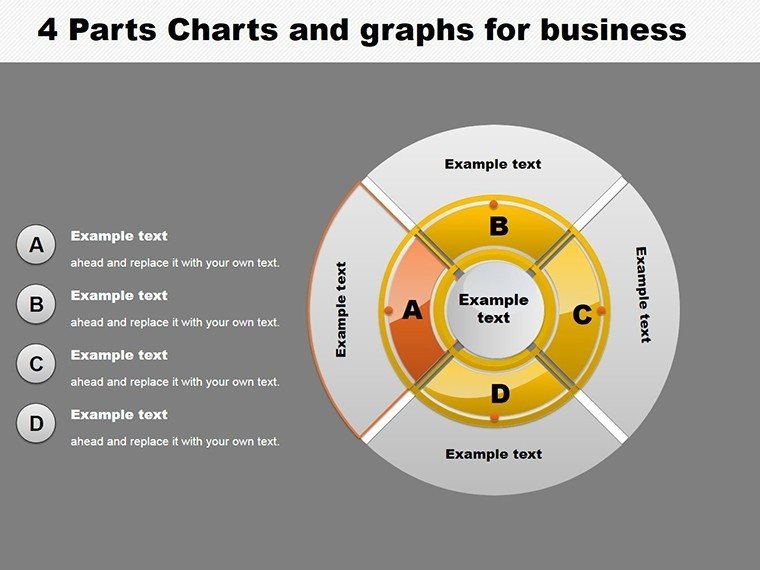
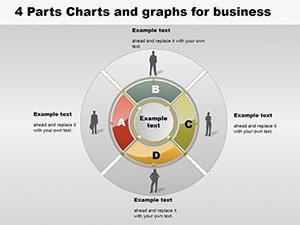
Let's explore practical applications. For executives, envision using the template in strategic planning sessions to illustrate departmental contributions to overall goals - say, how sales, marketing, operations, and R&D each play a role in revenue growth. A case study from a mid-sized tech firm showed that switching to segmented pie visuals in their annual report led to a 20% increase in stakeholder engagement, as measured by post-presentation surveys. Marketing professionals might employ it to break down customer demographics into four key age groups, revealing targeting opportunities for campaigns. Entrepreneurs, on the other hand, can craft investor decks that vividly display market opportunity slices, such as competitive landscape shares, making abstract concepts tangible and persuasive.
- Start by downloading the template and opening it in PowerPoint.
- Input your data into the placeholder fields - watch as the pie adjusts in real-time.
- Customize aesthetics to align with your branding guidelines.
- Rehearse with animations to ensure smooth delivery.
- Export and share, confident in its impact.
Integration with Workflows
Seamlessly integrate this into your existing workflows. Link slides to Excel data sources for live updates, or embed them in reports using Microsoft Teams for collaborative feedback. For those in creative fields, pair with stock imagery to theme the pies around industry motifs, like tech gadgets for a software company pitch.
Expert Tips for Maximum Impact
To truly harness this template, follow these tips: Limit text on slides to key takeaways, letting the visuals speak; use consistent color schemes across presentations for brand recognition; and always test on different devices for responsiveness. Drawing from AIA standards in design communication - though adapted here for business - prioritize hierarchy in information display. Avoid overcrowding by focusing on one main insight per slide.
Ready to transform your business narratives? Download this 4-part pie chart PowerPoint template now and start crafting presentations that not only inform but inspire action.
Frequently Asked Questions
How editable are the pie charts in this template?
The charts are fully editable, allowing changes to data, colors, sizes, and labels directly in PowerPoint.
Is this compatible with Google Slides?
Yes, it works seamlessly with Google Slides, maintaining all functionalities and designs.
Can I use this for non-business purposes?
Absolutely, it's versatile for educational, non-profit, or personal projects involving proportional data visualization.
What file format is provided?
The download is in .pptx format, standard for PowerPoint.
Are there animation options included?
Yes, pre-set animations for segment reveals enhance engagement during presentations.