 Click to zoom
Hexagonal Objects PowerPoint Charts - Professional Presentation Template
| Format | .pptx |
| Slides | 14 unique layouts |
| Aspect ratio | 16:9 |
| Compatibility | PowerPoint |
| Animated | No |
| Language | English |
| License | Commercial |
| File size | — |
| Version | v1.0 |
| Last updated | August 2023 |
What's inside
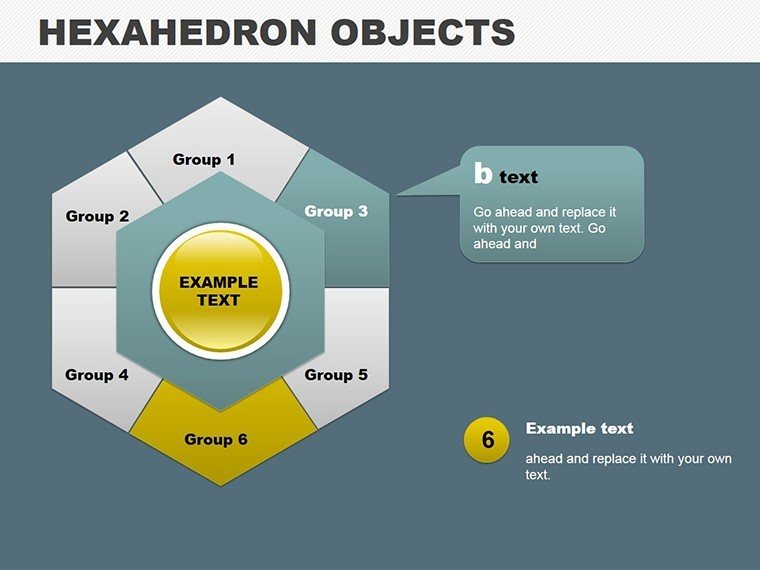
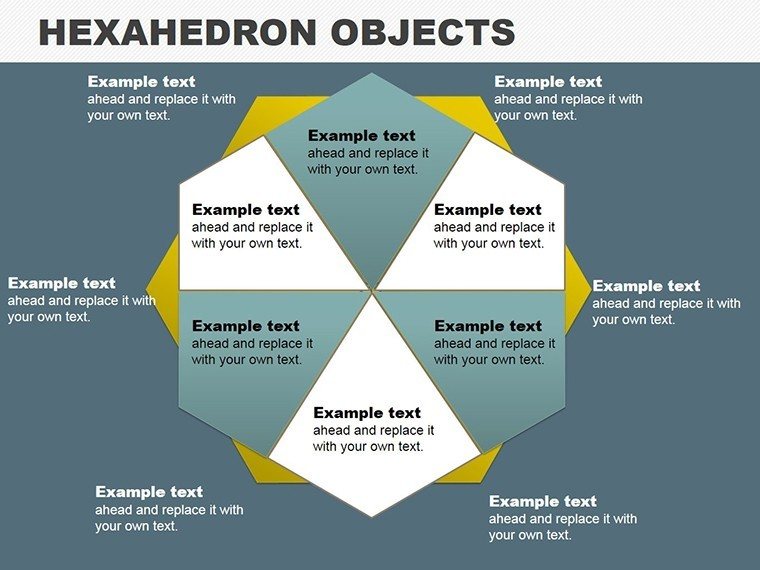
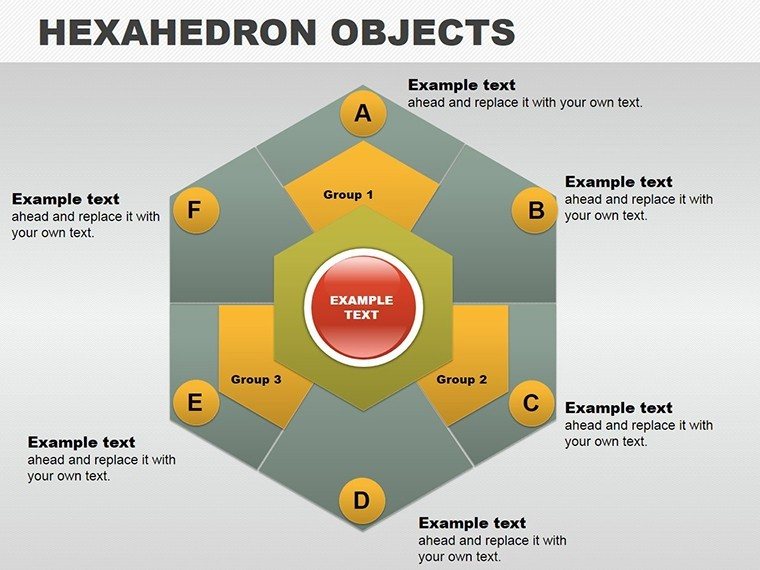
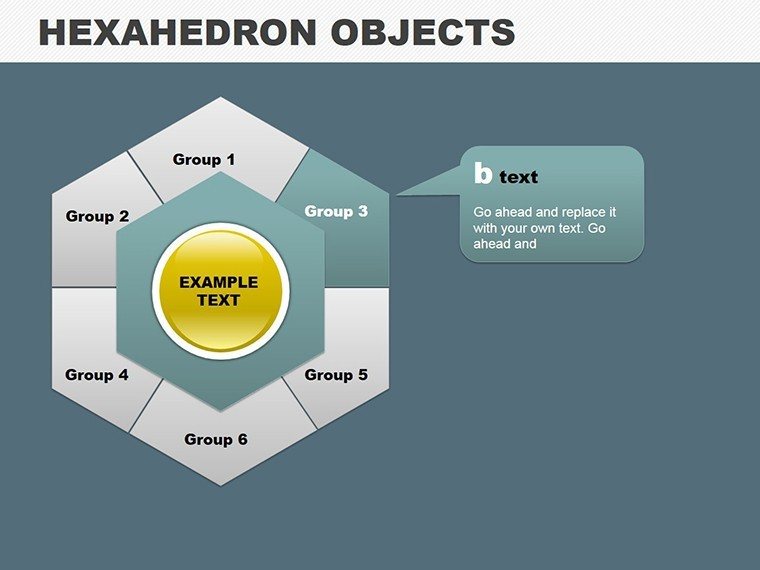
Step into a world where data takes on a geometric elegance, turning ordinary presentations into captivating experiences. Our Hexagonal Objects PowerPoint Charts Template, with 14 editable slides, is engineered for professionals who demand innovation in visual communication. Aimed at business leaders, educators, marketers, and designers, it leverages hexagonal shapes to simplify complex datasets, highlighting trends and relationships with modern flair. From sales dashboards to lesson plans, this matrix-themed template adapts to your needs, making abstract information concrete and compelling.
Consider the frustration of standard bar graphs failing to engage during a strategy session. Here, a hexagonal grid can interconnect metrics like market share and growth rates, with each facet customizable for emphasis. This design draws from honeycomb efficiency, symbolizing interconnectedness in data, perfect for illustrating network effects in tech industries or ecosystem balances in environmental studies.
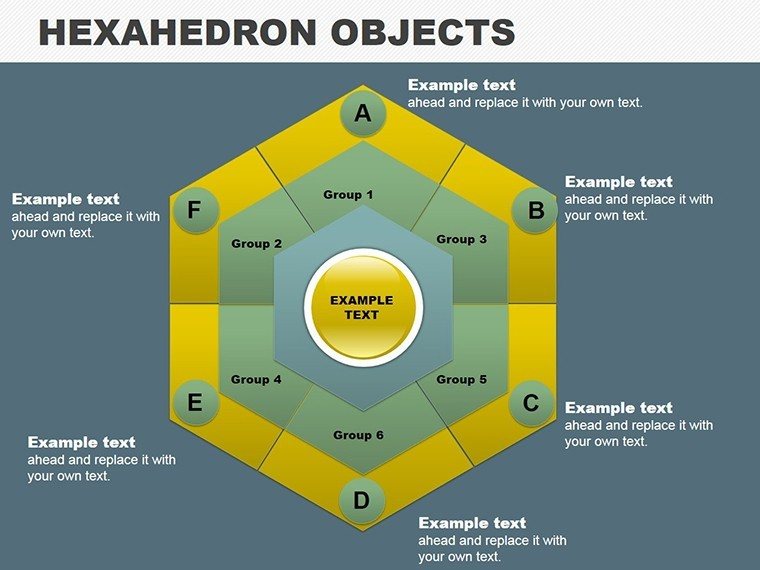
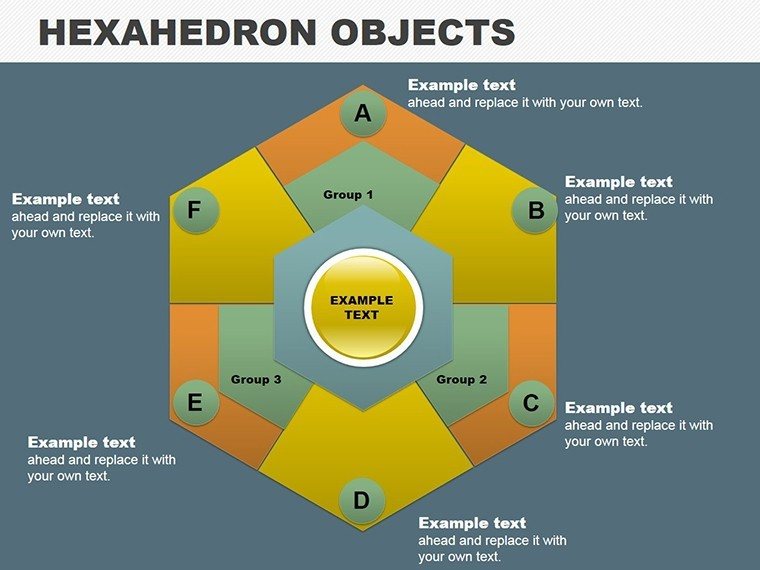
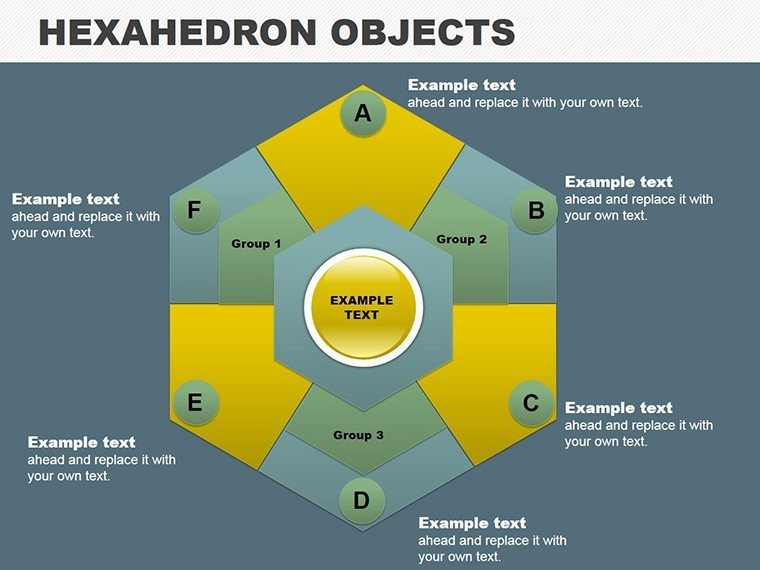
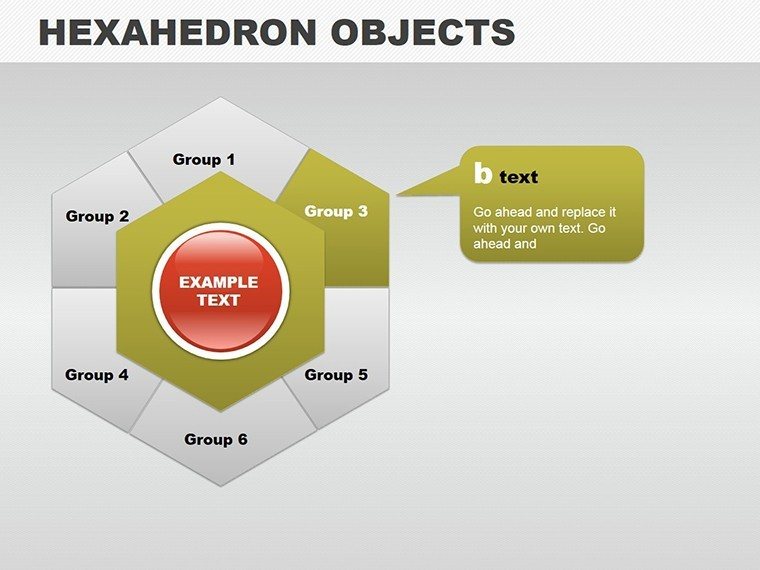
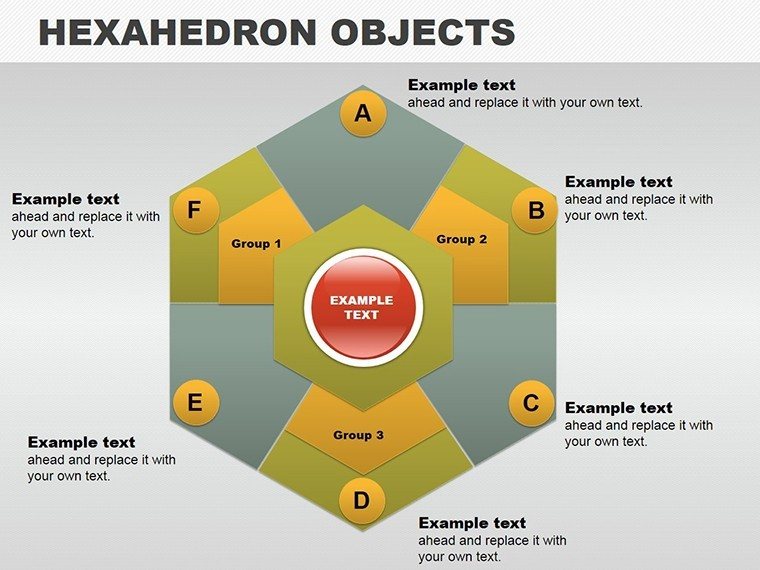
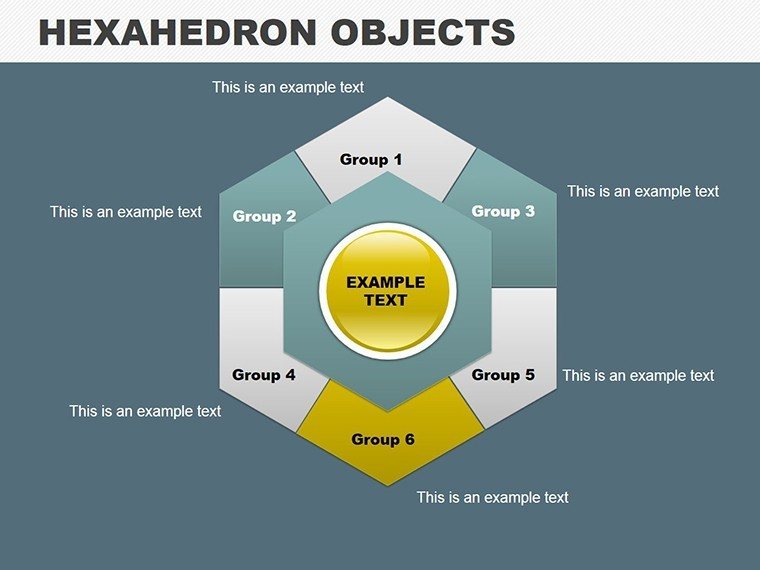
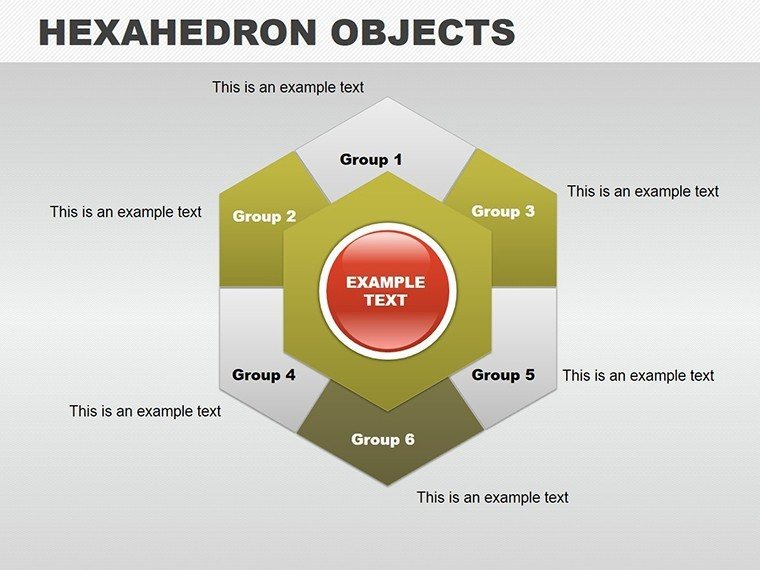
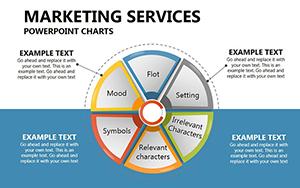
Exploring the slides reveals versatile layouts. One slide offers a central hexagon with surrounding cells for comparative analysis, editable to input KPIs or case details. In marketing, use it to map customer personas, inspired by campaigns like those from HubSpot that visualize audience segments dynamically.
Innovative Features for Dynamic Visuals
The template's user-friendly interface shines through. Scale hexagons without distortion, alter shades to evoke emotions - greens for growth in financial reports - and integrate data from spreadsheets effortlessly.
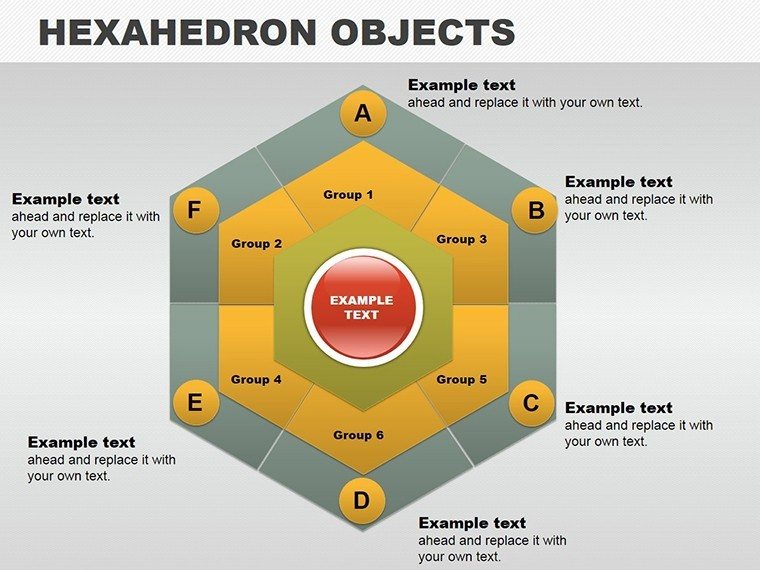
- Matrix Grids for Relationships: Depict interconnections, like in project management for task dependencies.
- Comparative Hexagons: Side-by-side views for benchmarking, adjustable for multi-variable analysis.
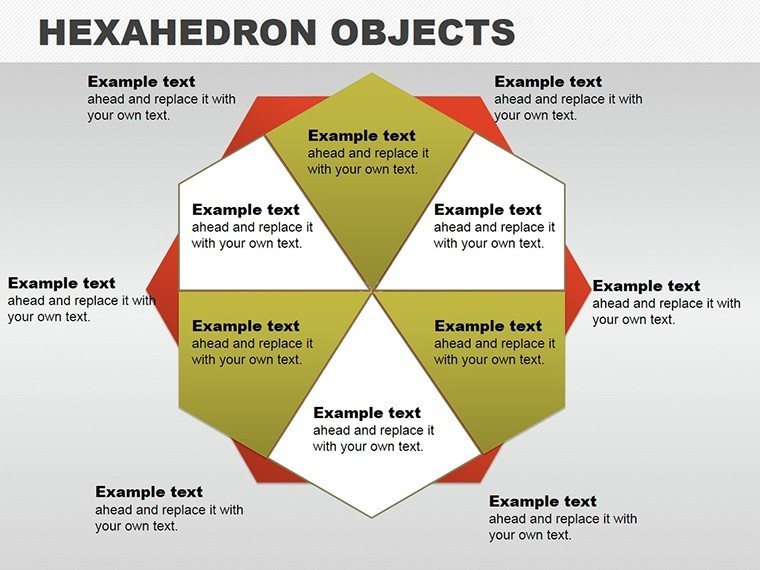
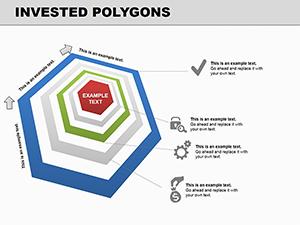
- Layered Designs: Build depth with overlapping shapes, ideal for phased strategies.
For educators, transform history lessons into hexagonal timelines, each cell a pivotal event. Tip: Use gradients for progression visuals, enhancing narrative flow.
Applications in Professional Settings
In practice, this template empowers diverse scenarios. Marketers can visualize SWOT in hex form, revealing strategic insights. Business pros craft proposals with data mosaics, leading to better buy-in, as seen in firms adopting visual tools for 25% faster decisions.
- Assess your data structure and select a hexagonal layout.
- Input values and tweak aesthetics.
- Add animations for sequential reveals.
- Review for clarity and iterate.
- Present with confidence.
Outshining basic PowerPoint, it provides pre-built sophistication. Google Slides compatible, it's great for teams. Integration tip: Link to external data for live updates.
Building Trust Through Expert Design
Aligned with design principles from sources like the Interaction Design Foundation, it boosts credibility. Versatile across industries, it's your go-to for standout visuals.
Embrace hexagonal innovation - download and redefine your data stories now.
Frequently Asked Questions
How do I customize the hexagonal shapes?Easily resize, recolor, and reposition using PowerPoint's tools.Is it suitable for large datasets?Yes, expandable grids handle complexity well.Can I animate individual hexagons?Absolutely, for engaging step-by-step presentations.What industries benefit most?Business, education, marketing, and more.Are updates available?Support includes access to future enhancements.Does it work on Mac?Yes, fully compatible with PowerPoint on all platforms.Good for
- Project roadmaps and sprint plans
- Product launch timelines
- Quarterly or annual review decks
- Company history and milestone summaries
Licence
reviews
I downloaded this for a quick office presentation.
The graph slides looked clean on screen.
A few icons seemed outdated but not terrible.
Easy to rearrange the chart blocks.
FAQ
Will it work in Google Slides?
Are fonts embedded?
Can I use this for client work?
What's the refund policy?
Do you update the template after purchase?
Similar templates
See all PowerPoint Charts →
All 14 slides