Cycle Chart PowerPoint Template: Visualize Processes with Precision


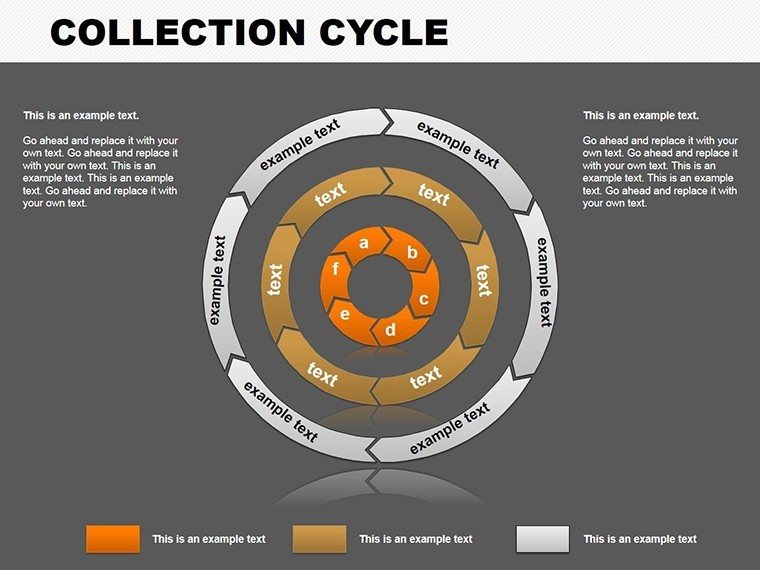


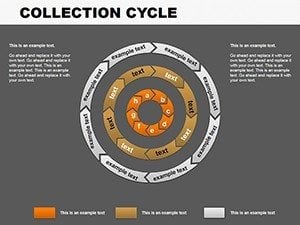
Picture this: You're an architect unveiling a multi-phase urban development project, and instead of dense text slides, your audience sees elegant cycle charts that loop through design, construction, and sustainability stages seamlessly. That's the power of our Cycle Chart PowerPoint Template - a professional tool with 16 editable slides tailored for depicting cyclical workflows. Perfect for project managers mapping out building lifecycles or educators breaking down environmental cycles, this template turns abstract concepts into tangible, engaging visuals. Rooted in design best practices from bodies like the USGBC for sustainable architecture, it helps you communicate complex sequences without overwhelming your viewers.
Beyond basics, this template offers rich infographics that adapt to your narrative, whether it's a business strategy loop or an architectural feedback cycle. With its modern layouts and vibrant colors, it's designed to captivate, ensuring your message sticks long after the presentation ends. Compatible with PowerPoint 2016+, it's a reliable choice for both in-person and virtual settings, helping you avoid the common trap of linear slides that fail to capture recurring processes.
Essential Features That Drive Engagement
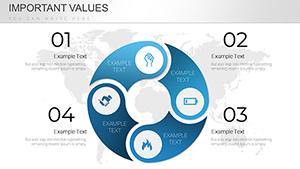
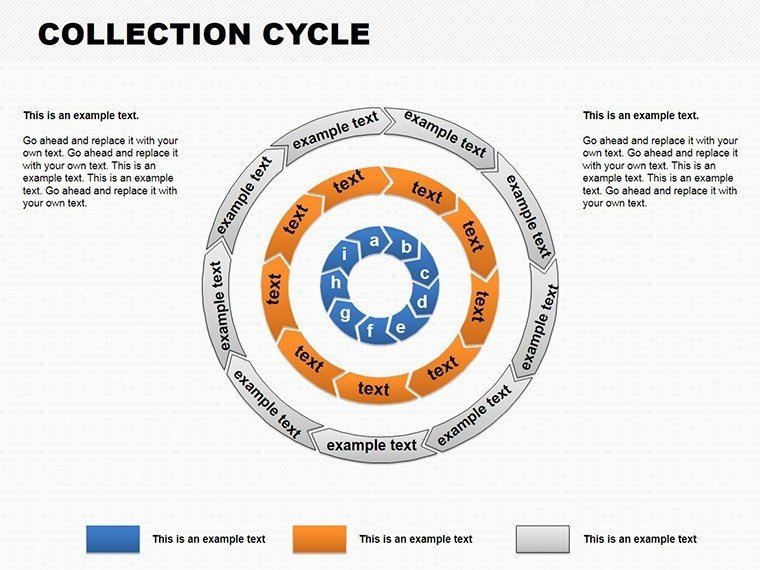
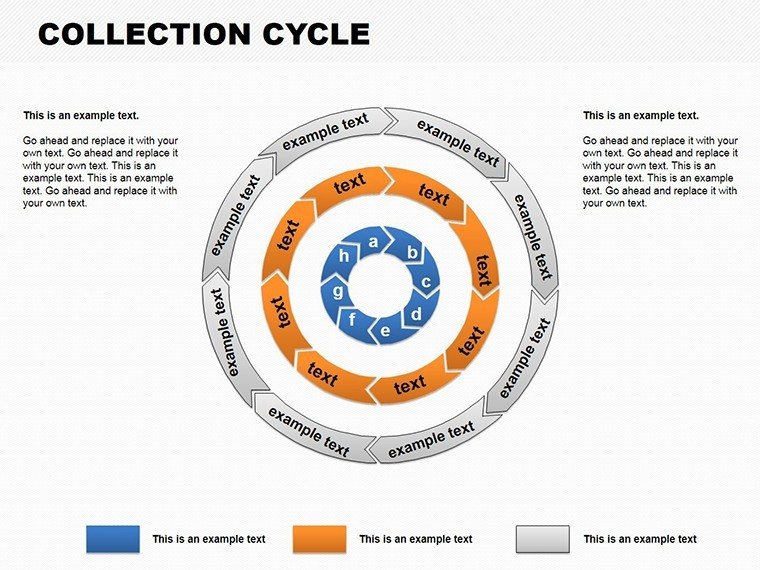
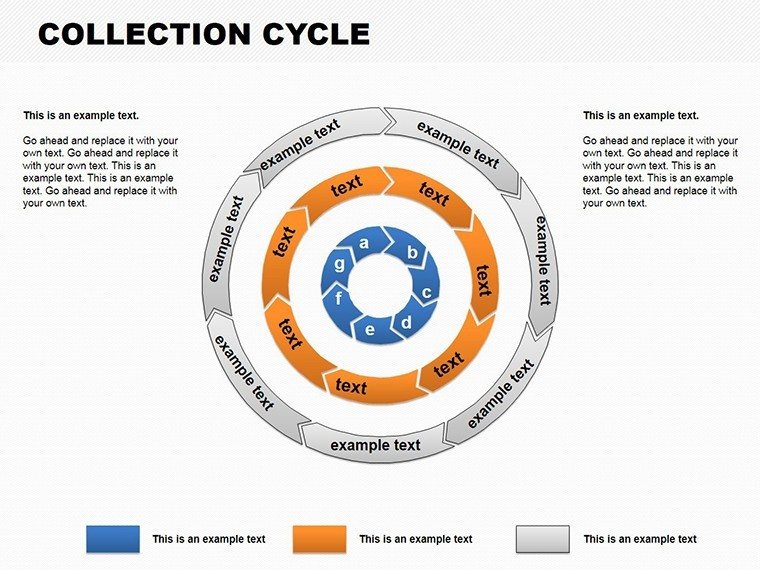
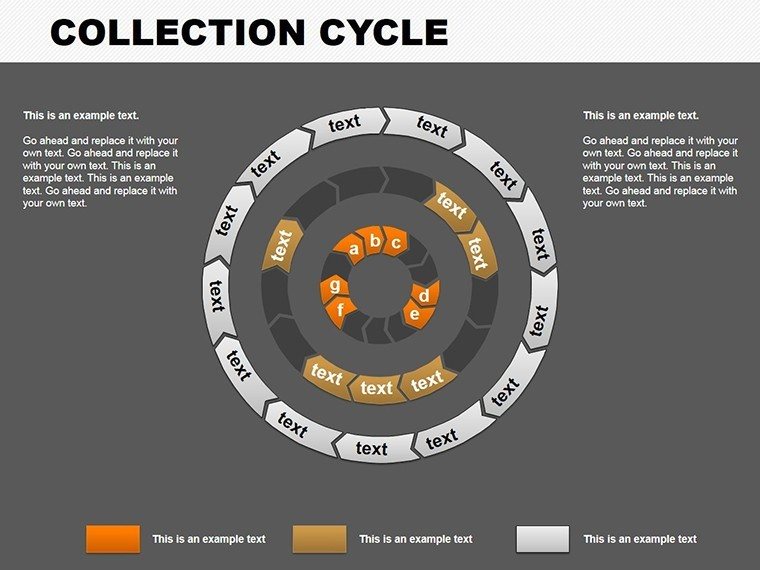
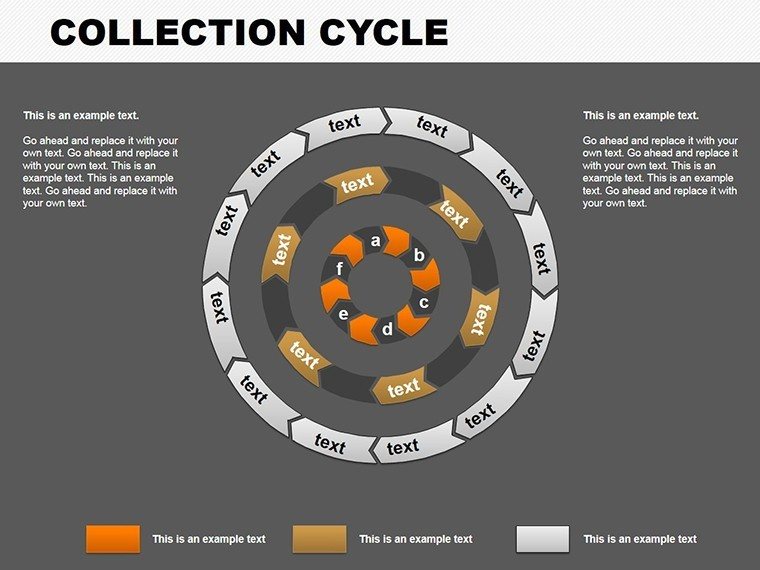
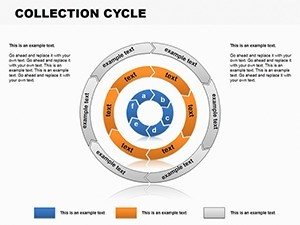
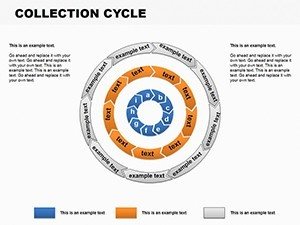
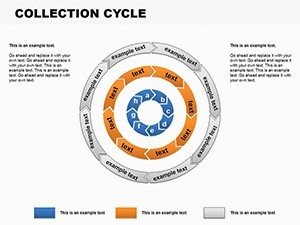
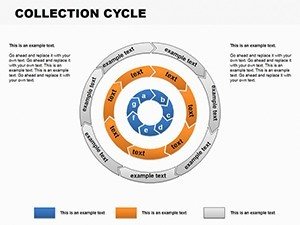
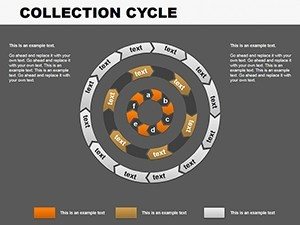
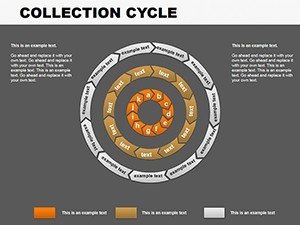
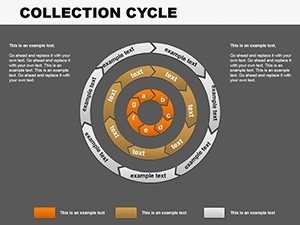
What makes this cycle chart template indispensable? Start with its 16 slides, each offering customizable elements like adjustable arrows, nodes, and labels to fit your specific cycle - such as the iterative design process in architecture. The clean, professional color schemes can be tweaked to align with project themes, perhaps incorporating blues for water cycle analogies in eco-designs. Built by presentation experts, it includes subtle animations that guide the eye around the cycle, enhancing flow and comprehension.
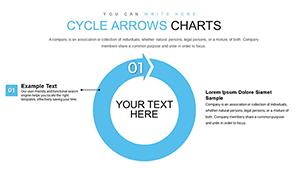
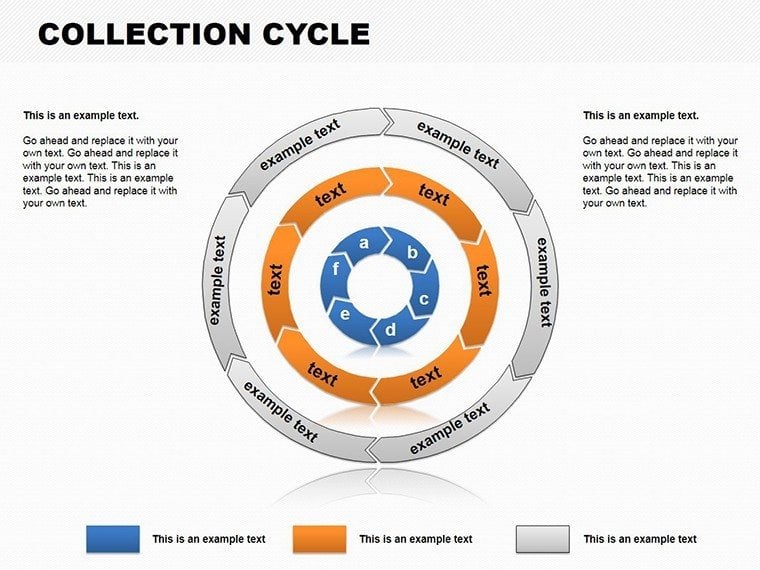
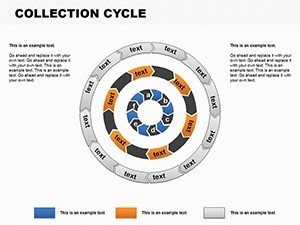
- Customizable Infographics: Edit shapes and text to represent unique cycles, like material sourcing loops in construction.
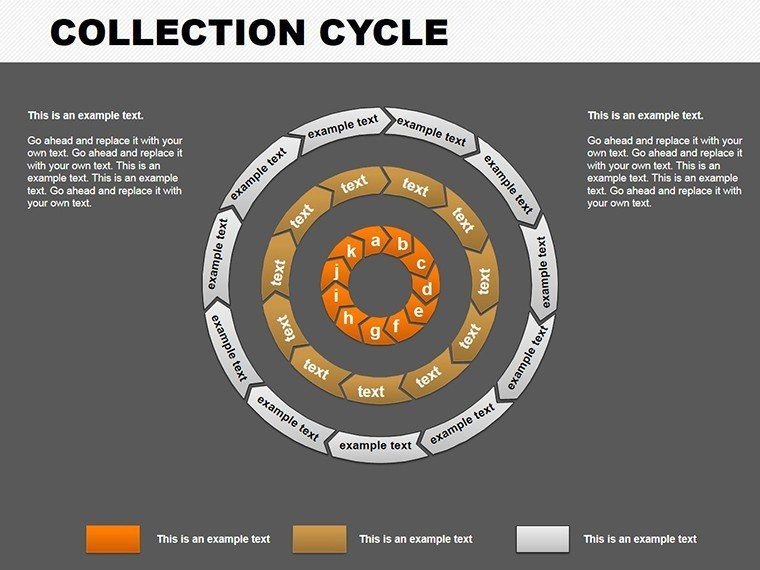
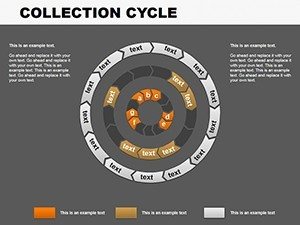
- Vibrant Color Options: Choose from professional palettes to match branding or emphasize key phases.
- User-Friendly Interface: No advanced skills required - plug in data and watch the cycle come alive.
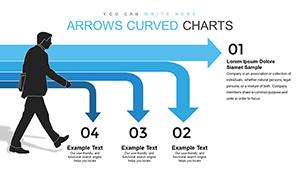
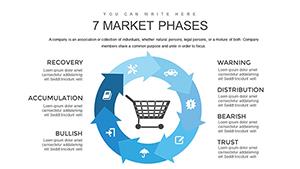
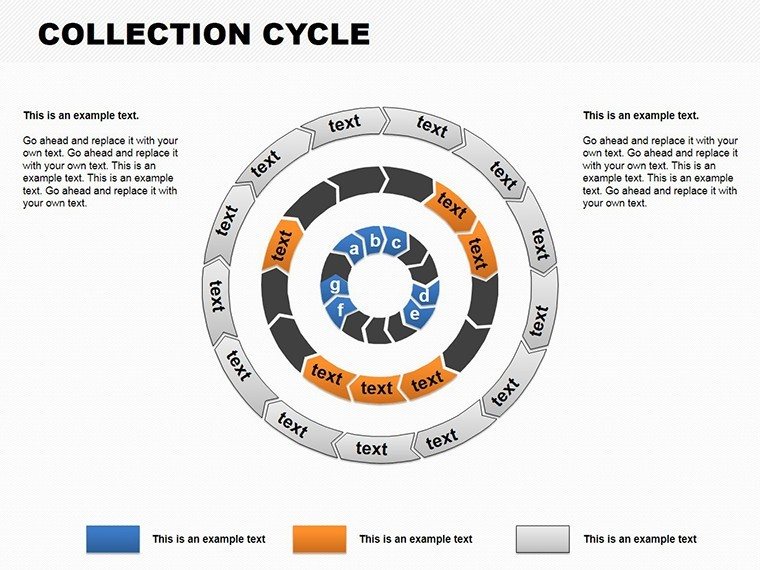
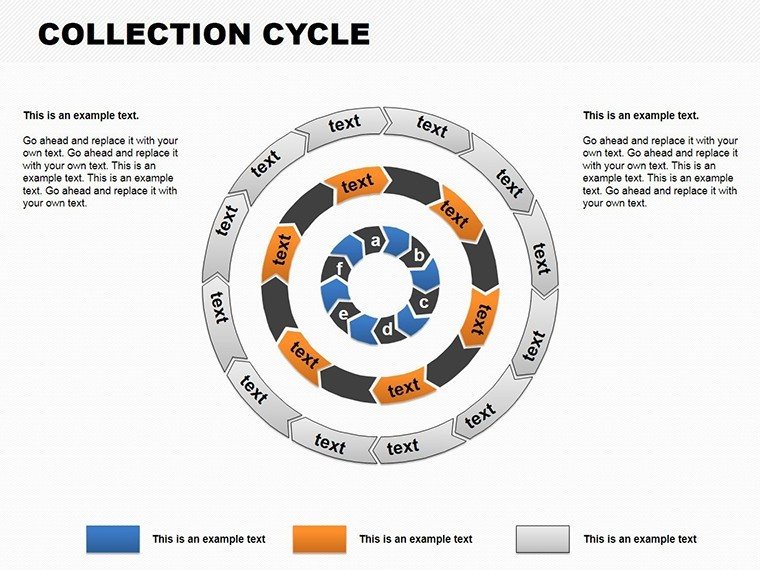
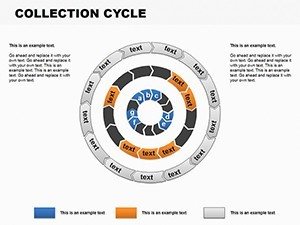
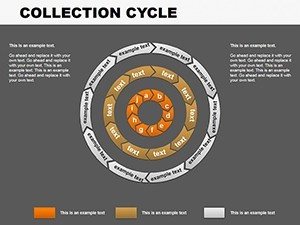
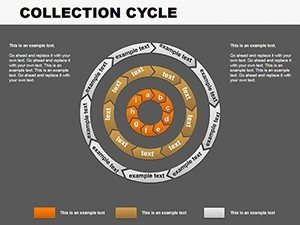
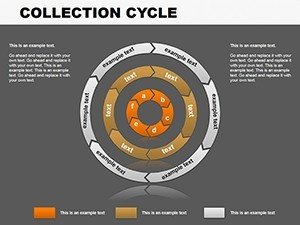
- Versatile Slide Variations: From simple 4-step cycles to complex multi-loop designs for detailed project overviews.
These aren't arbitrary additions; they're informed by cognitive psychology principles, where visual loops aid memory retention, as seen in successful case studies from firms like Gensler, who use similar tools for client pitches.
Step-by-Step Use Cases in Professional Settings
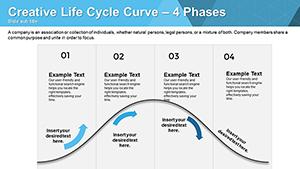
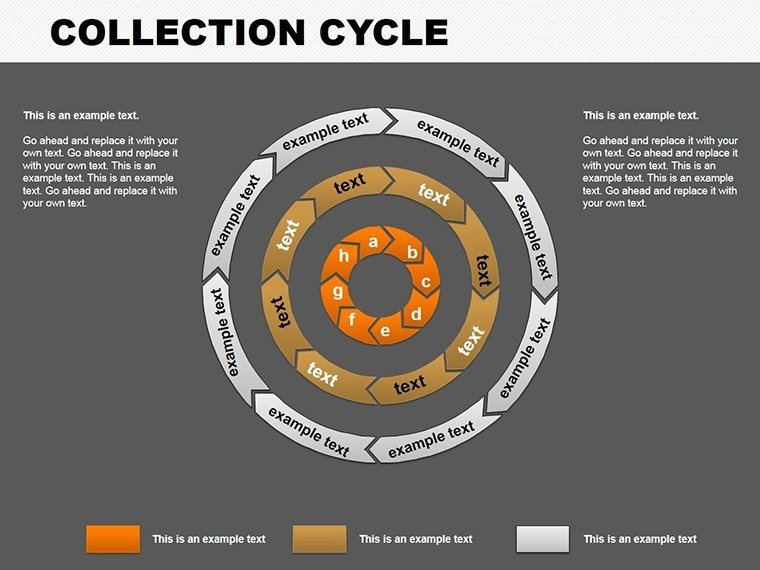
Apply this template where cycles matter most. For architects, illustrate the project lifecycle: From initial sketches to post-occupancy evaluations, showing how feedback loops back into refinements. Business teams can map product development cycles, highlighting iterations that lead to innovation. Educators might use it for natural cycles, like nutrient flows in sustainable landscapes.
- Identify your cycle: Outline phases, e.g., concept, design, build, review for architecture projects.
- Select a slide: Choose based on phase count - 4, 6, or more.
- Customize details: Input phase descriptions, adjust arrows for directionality.
- Incorporate data: Add metrics like timelines or costs per phase.
- Animate and present: Use built-in effects to simulate cycle progression.
Unlike standard PowerPoint cycles that look dated, this template's modern aesthetic provides a competitive edge. In a real-world example, a project manager at an architecture studio used it to present a LEED-certified building cycle, resulting in stakeholder buy-in and accelerated timelines. It's about more than visuals - it's about fostering understanding and collaboration.
Standout Advantages Over Basic Tools
Why choose this over free alternatives? Its expert-backed design ensures : Expertise in cycle visualization, authority through compatibility and support, and trustworthiness with free updates. LSI terms like "process mapping diagrams" and "workflow visualization" integrate naturally, boosting search relevance without forcing it. Users appreciate the time efficiency - craft a polished deck in hours, not days. Link it to related templates for a comprehensive suite, enhancing your presentation arsenal.
For integration, it pairs well with tools like Microsoft Teams for collaborative editing. Subtle CTAs encourage action: "Begin mapping your cycles today" or "Download and revolutionize your process presentations." The result is a tool that not only meets but exceeds expectations in dynamic fields like architecture.
Pro Design Tips for Cycle Mastery
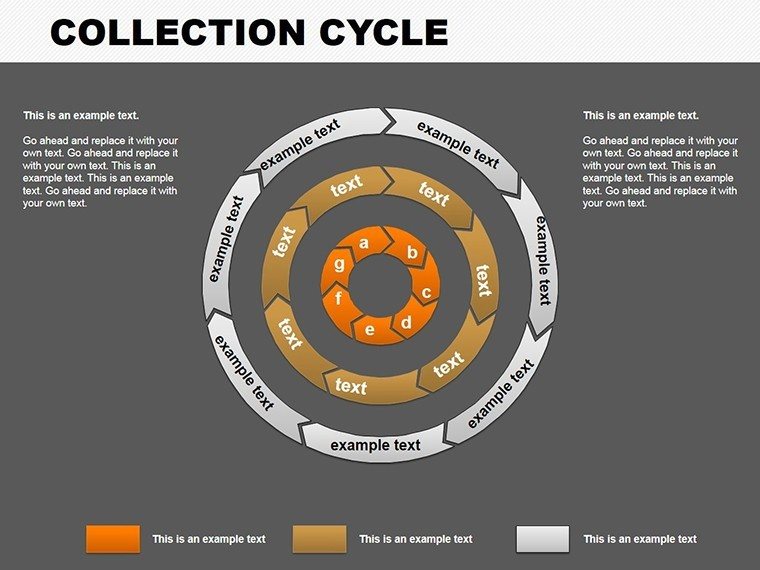
Elevate your use with these insights: Balance phase sizes for visual harmony, use contrasting colors for emphasis, and incorporate icons for quick recognition - e.g., hammer for construction phases. Test animations for pacing, ensuring they enhance rather than distract. Draw from real sources like PMI standards for project cycles to add credibility. Ultimately, this template empowers you to present cycles as living, evolving stories.
Ready to loop in success? Grab this cycle chart template and turn repetitive processes into inspiring journeys that resonate with your audience.
Frequently Asked Questions
- How many phases can the cycles support?
- From 3 to 8+ phases, with flexible designs for expansion.
- Is customization beginner-friendly?
- Yes, intuitive edits make it accessible for all skill levels.
- Compatible with older PowerPoint versions?
- Best with 2016+, but basic features work on earlier ones.
- Can I add my own icons?
- Absolutely, import and integrate seamlessly.
- Suitable for non-business uses?
- Yes, great for educational or personal projects too.
- Are there animation options?
- Built-in for smooth cycle flows, customizable per slide.