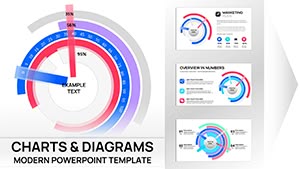
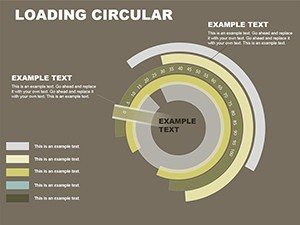
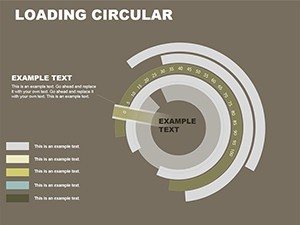
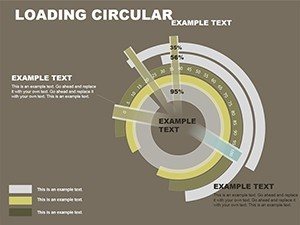
Linear Process Flow Diagram PowerPoint Template - Fully Editable & Instant Download


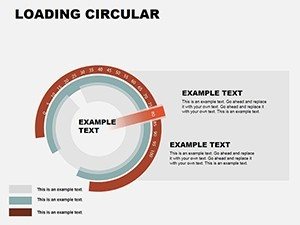


In corporate and project environments, stakeholders need unambiguous visual paths to understand execution sequences. This Linear Process Flow Diagram PowerPoint Template provides clean, professional layouts that anchor discussions and eliminate ambiguity in presentations.
Key Features
- Fully editable linear flow designs
- Clear step-by-step layouts with arrows and connectors
- Easy customization of text, colors, and shapes
- Compatible with Microsoft PowerPoint
- Professional and minimal design style
Why Choose This Template
Linear flows prevent misinterpretation by presenting information in logical order. The template ensures presentations remain focused and professional during critical operational or strategy discussions.
It saves time on creating diagrams from scratch while maintaining clarity for diverse audiences.
How to Use the Template
Open the downloaded PPTX file in PowerPoint. Update each step with your specific process details. Modify colors to align with branding and adjust layout as needed. The simple structure makes customization quick and straightforward.
Professional Scenarios
Operations directors outline workflow improvements to leadership teams.
Project managers present project phases and dependencies to stakeholders.
Consultants illustrate implementation roadmaps during client engagements.
Team leads explain standard operating procedures in training sessions.
Streamline your next process presentation - download today.
Is the template fully editable?
Yes, all shapes, text, colors, and connectors are fully editable in PowerPoint.
What file format is included?
The template is provided in PPTX format, compatible with recent versions of Microsoft PowerPoint.
Can I add or remove steps?
Yes, the linear structure allows easy addition or removal of steps while maintaining alignment.
Is it suitable for operational reviews?
Yes, the clear sequential design is ideal for presenting processes in corporate and project settings.
How fast is the download?
After purchase, you receive an instant download link to access the template immediately.