CRM PowerPoint Charts Template: Visualize Insights


Type: PowerPoint Charts template
Category: Cycle
Sources Available: .ppt, .pptx
Product ID: PC00079
Template incl.: 18 editable slides
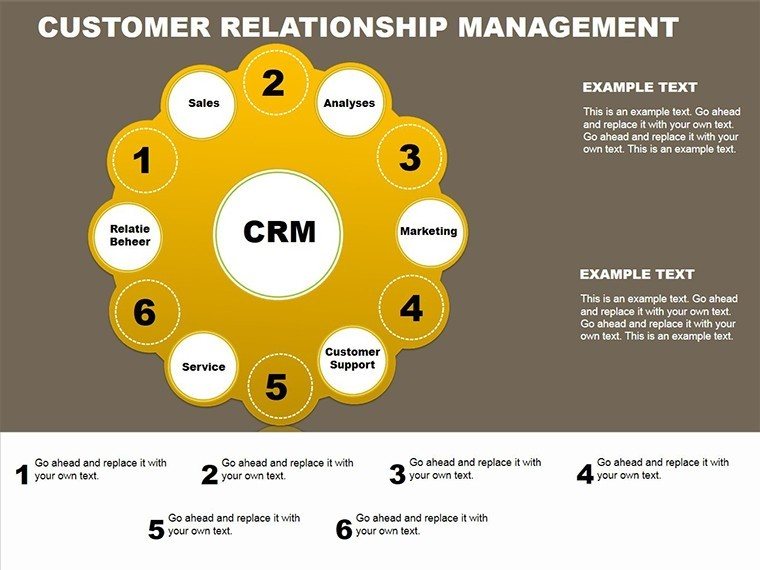
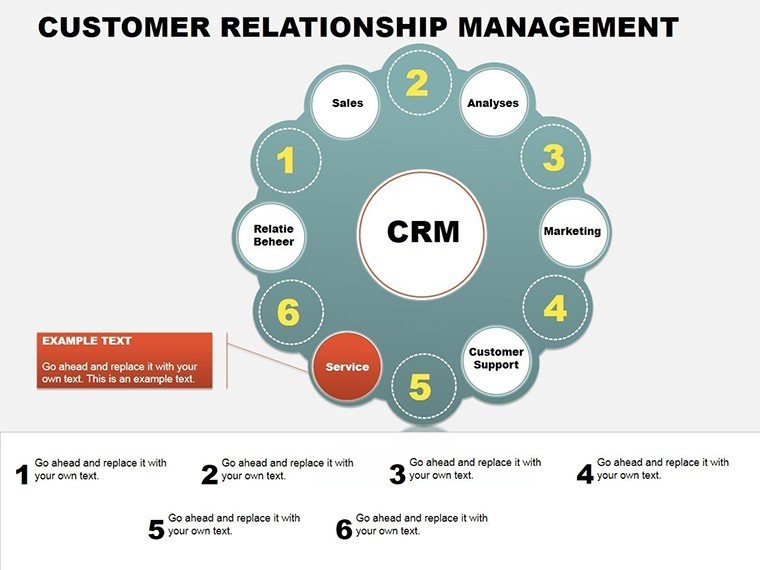
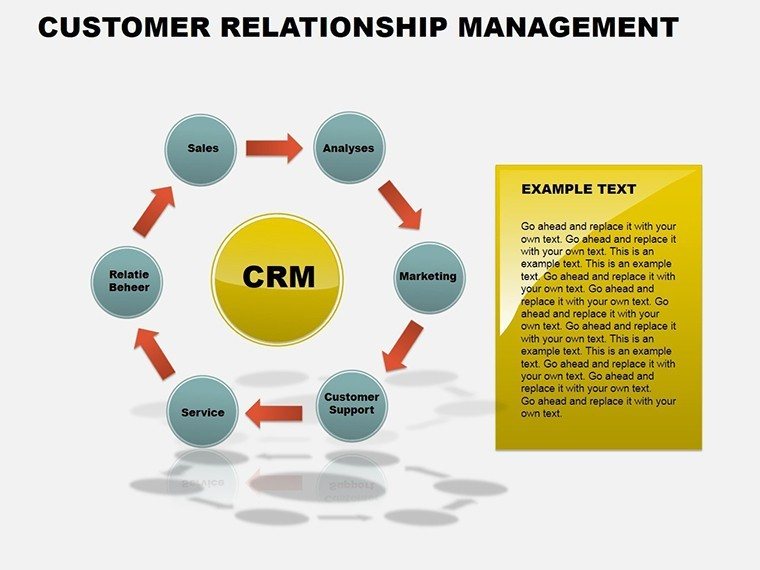
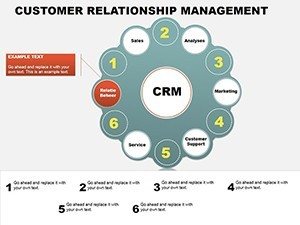
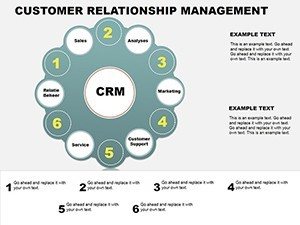
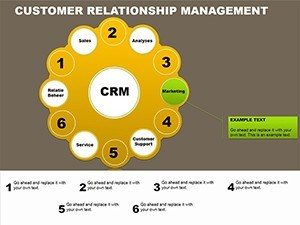
Navigating the intricate web of customer interactions can feel like charting a city's skyline - full of peaks, valleys, and unexpected connections. Enter the CRM PowerPoint Charts Template, your compass for clarity with 18 editable slides in .pptx, primed for PowerPoint and Google Slides. Crafted for sales leaders and relationship managers who need to spotlight patterns amid the noise, this template weaves data into diagrams that reveal opportunities at a glance.
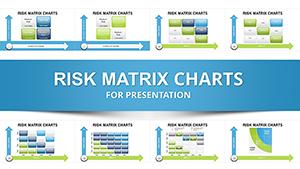
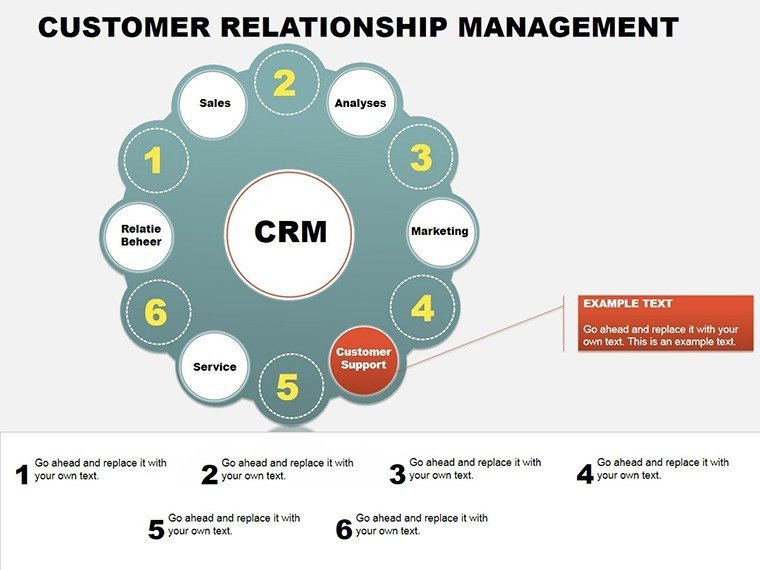
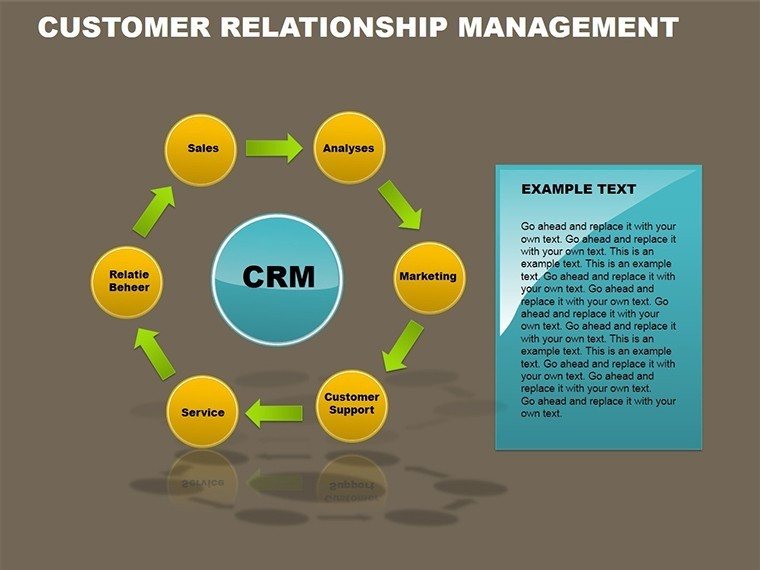
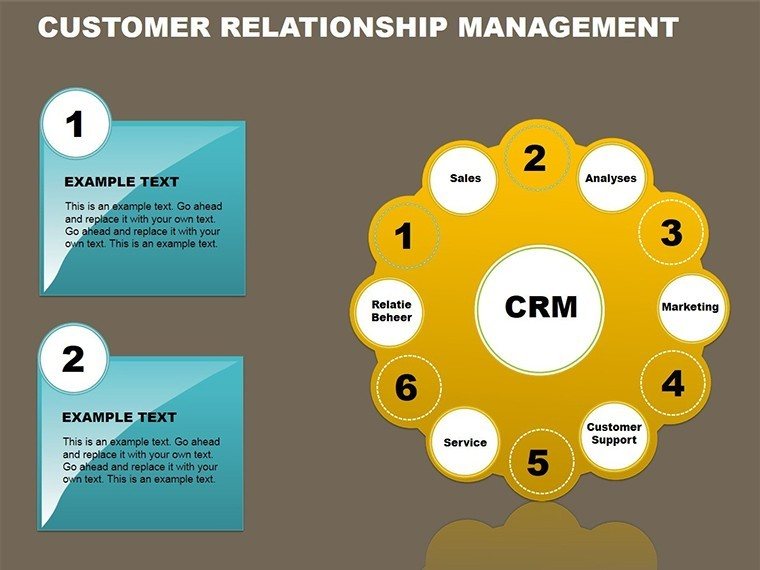
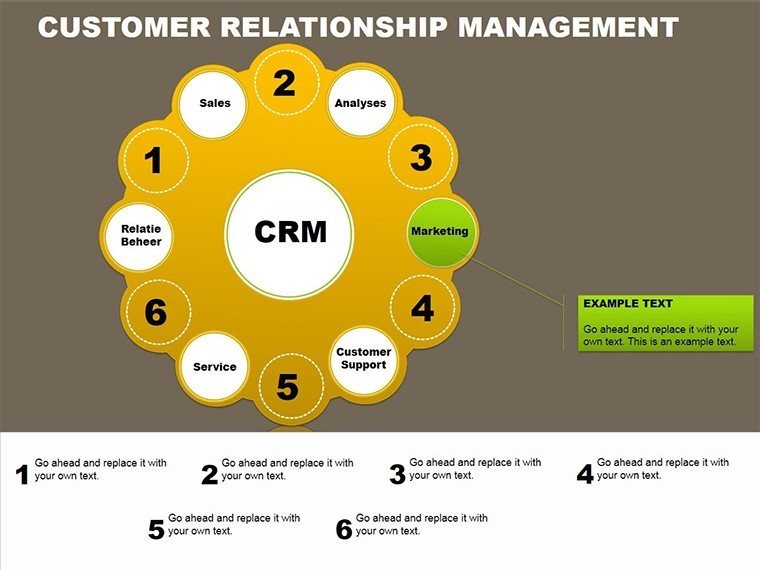
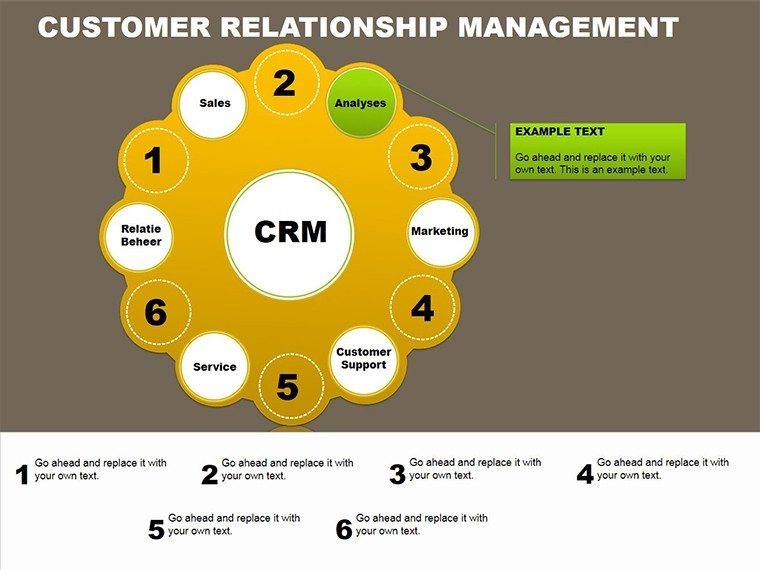
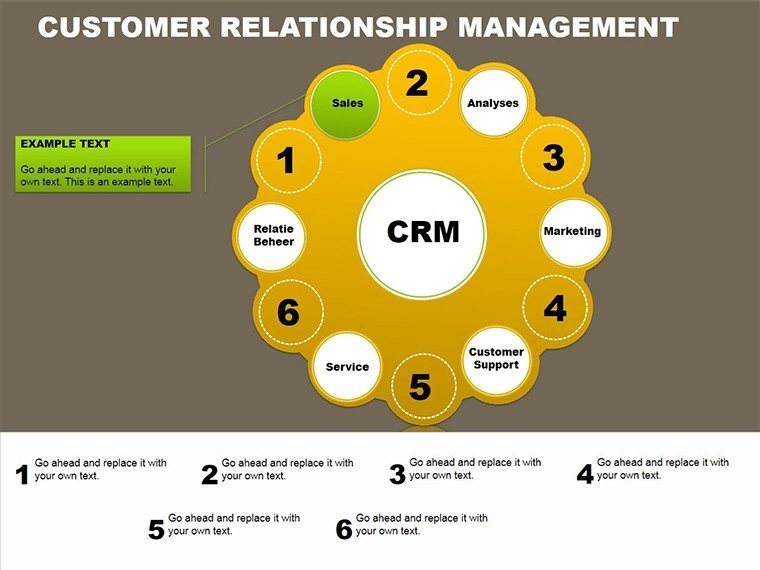
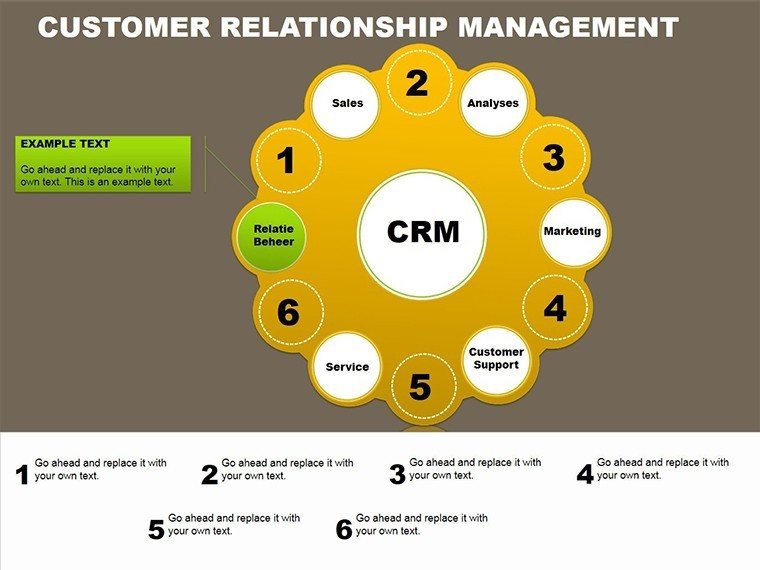
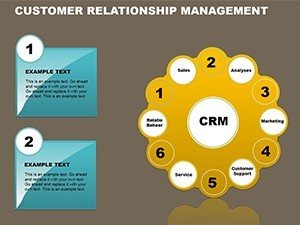
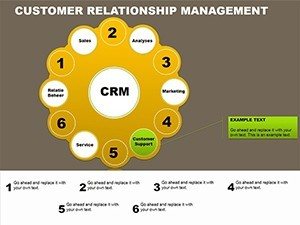
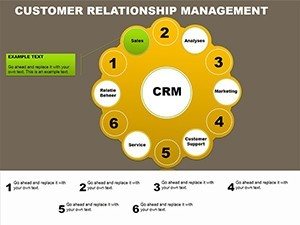
In the competitive arena of client management, where every touchpoint counts, generic spreadsheets fall short. This template, informed by CRM best practices from Gartner reports, employs cycle and dependency charts to map journeys from inquiry to loyalty. Picture a sales director demoing pipeline health: Segmented cycles color-coded by stage - prospects in sunny yellow, closes in triumphant green - exposing bottlenecks before they bottleneck revenue. For architecture consultancies tracking project stakeholders, radial charts link clients, vendors, and regulators, ensuring no thread unravels.
Beyond basics, it's a time-saver with animated effects that pulse through dependencies, mimicking real relational dynamics. Fully vectorized for sharp exports, it integrates with tools like Salesforce exports, auto-populating fields for live demos. The payoff? Decks that don't just report - they strategize, arming teams to nurture leads with precision and panache.
Mapping Relationships with Precision
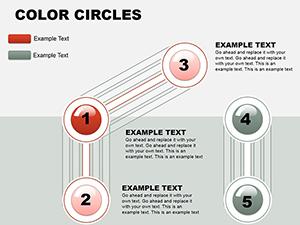
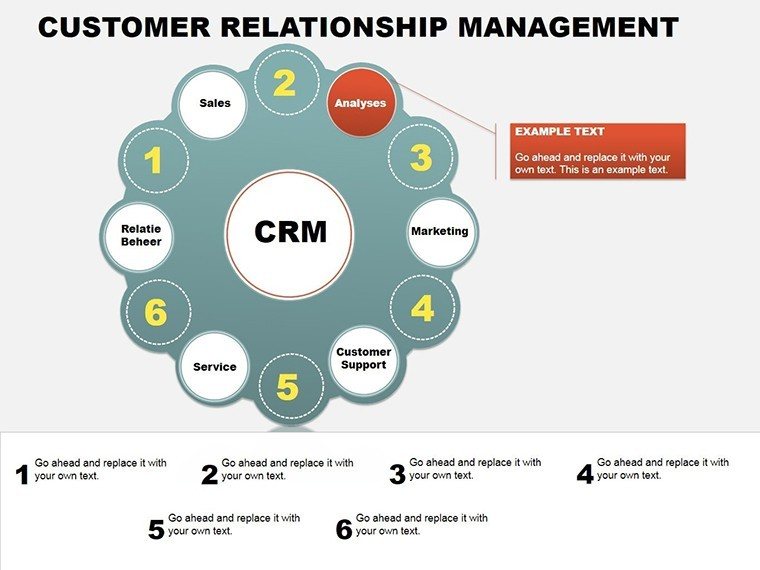
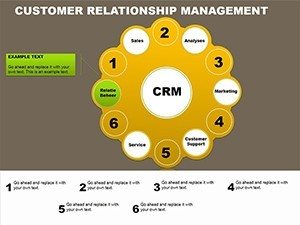
At its core, this template excels in relational graphing, where lines and loops illustrate how one metric influences another - think dependency wheels for cross-selling potentials. Drawing from network theory in business analytics, slides feature high-contrast inscriptions and icons that scale effortlessly, ideal for mobile reviews during client lunches.
Real insight: A mid-sized marketing agency adopted these for client retention analyses, using animated cycles to forecast churn risks. By visualizing touchpoint frequencies, they boosted renewals 22%, per internal metrics. For design pros, adapt to portfolio pipelines: Charts tracking bid-to-build ratios, with arrows denoting feedback loops that refine proposals.
Core Features for CRM Mastery
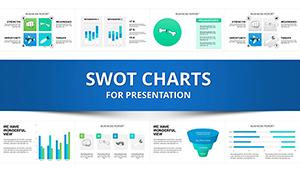
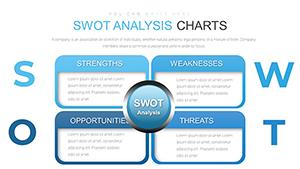
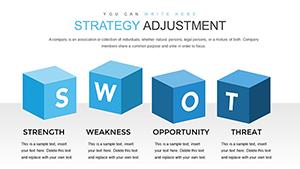
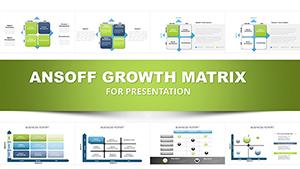
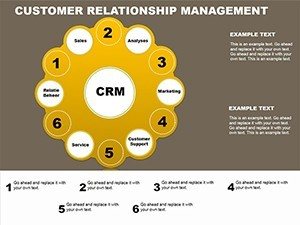
- 18 Dynamic Slides: Cycles, dependencies, funnels, and matrices for comprehensive views.
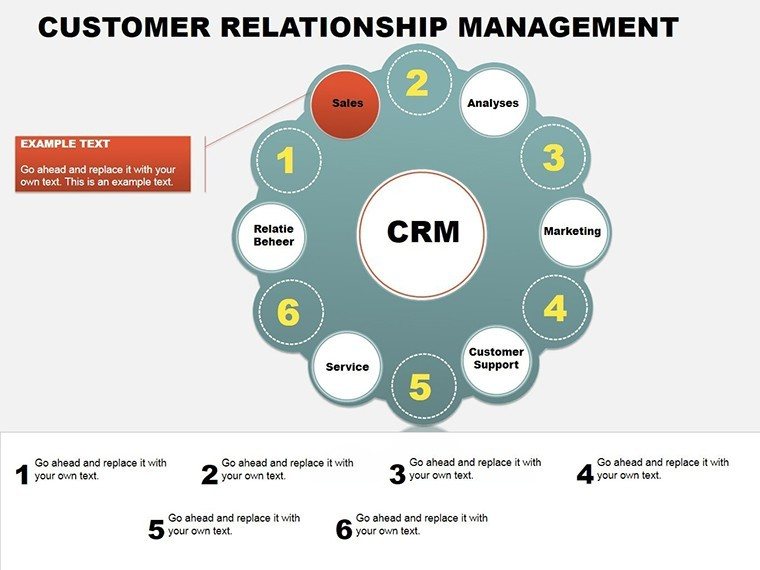
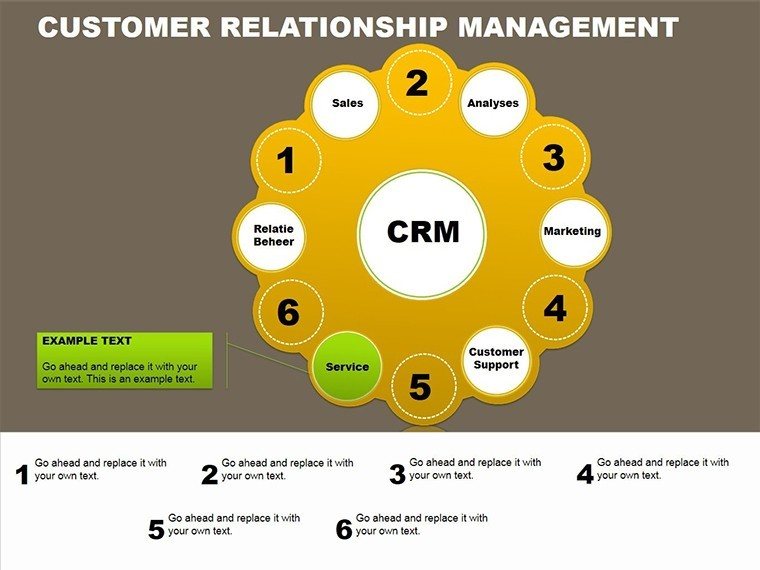
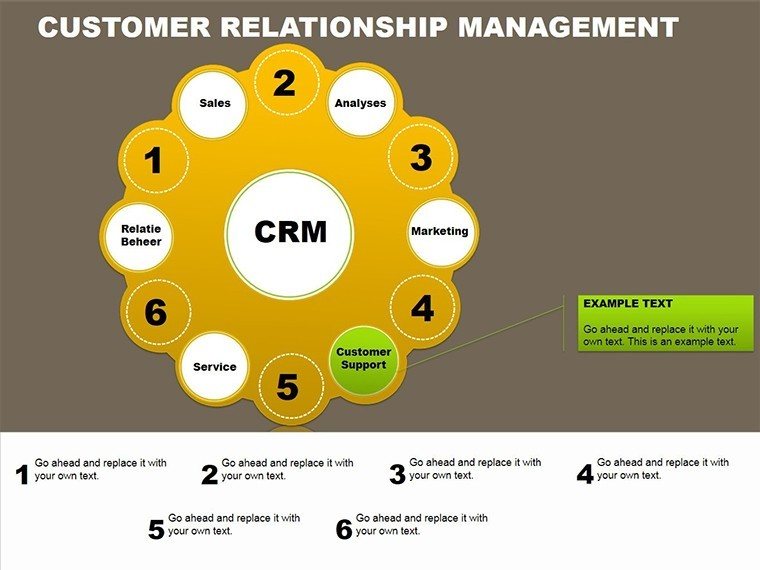
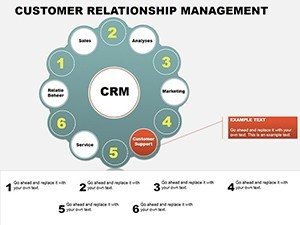
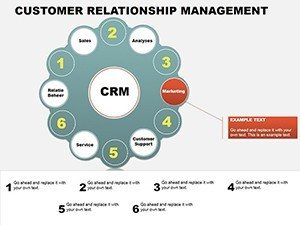
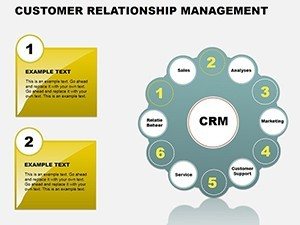
- Custom Animations: Sequence reveals to trace customer paths step-by-step.
- Vector Icons Galore: 100+ symbols for personas, stages, and outcomes.
- Color & Text Freedom: One-click swaps for brand harmony, with font embeds.
- Multimedia Ready: Slots for video testimonials or audio clips in relationship stories.
These align with ISO standards for data presentation, ensuring trustworthiness in high-stakes shares.
Tailored Scenarios for Sales Success
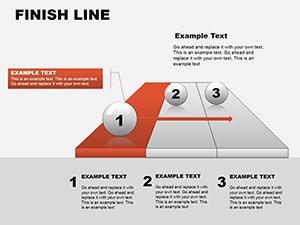
Sales funnels come alive here: A slide's circular progression segments by conversion rates, animations fading low-performers to spotlight wins. Marketers layer in engagement metrics, turning abstract A/B tests into actionable arcs.
In education for CRM training, dependency graphs link concepts like lead scoring to outcomes, fostering deeper comprehension. Architecture teams: Use for vendor relationship matrices, plotting reliability scores against timelines, averting delays on multimillion builds.
Non-profits tracking donor cycles find solace in these visuals, where loops highlight recurring gifts, inspiring stewardship strategies.
Effortless Implementation Steps
- Unpack the Kit: Extract zip; open master slide for global tweaks.
- Feed the Data: Paste from CSV or link CRMs - charts recalibrate on the fly.
- Polish Interactions: Fine-tune animation timings; add hyperlinks to detailed reports.
- Test Narratives: Rehearse with annotations, ensuring each chart cues your key message.
- Go Live: Embed in emails or portals; secure with passwords for sensitive intel.
From setup to spotlight in 45 minutes - efficiency that lets you focus on relationships, not rendering.
Insider Strategies for Chart Supremacy
As a CRM consultant who's optimized decks for HubSpot users, I recommend starting with audience empathy: Tailor densities - sparse for execs, detailed for analysts. For architecture bids, integrate with AutoCAD screenshots, overlaying charts on floorplans for holistic pitches.
Pro move: Use transparency on overlapping nodes to denote influence strengths, avoiding visual jams. Against off-the-shelf options, this template's relational smarts mean intuitive insights, no PhD required.
Empower Your CRM Vision Today
Stop sifting through silos - let these charts connect the dots for you. Download now, infuse your slides with relational riches, and watch customer stories unfold into success sagas. Your next win is one visualization away.
Frequently Asked Questions
How do these charts handle CRM data imports?
Seamlessly via Excel/CSV; dynamic links update visuals automatically.
Are animations compatible with Google Slides?
Core ones yes; advanced may simplify, but impact remains strong.
Ideal for architecture client management?
Yes - track project stakeholders and feedback cycles effectively.
Can I add custom icons?
Absolutely; drag in SVGs for personalized touchpoints.
What's included in the file pack?
.pptx, JPG previews, icon library, and animation guide.
Secure for confidential data?
Yes; no cloud dependencies, full local control.