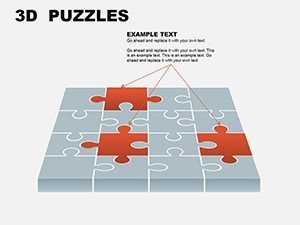
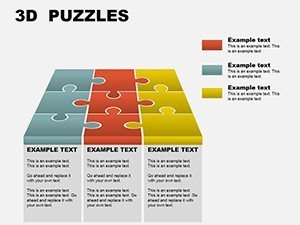
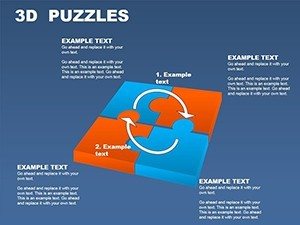
Professional 3D Puzzle Charts PowerPoint Template
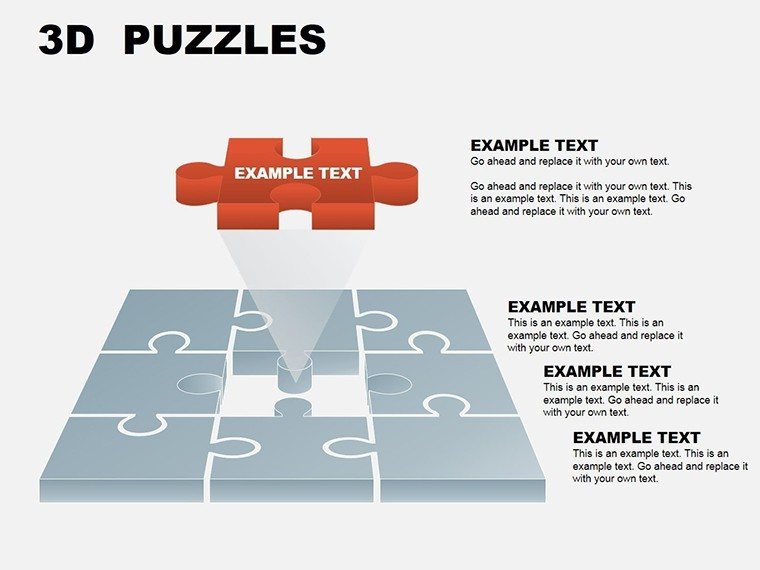


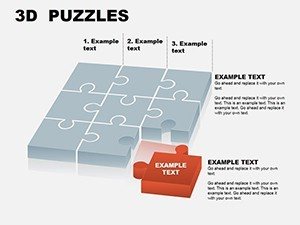

Step into a world where data doesn't just inform - it intrigues, fitting together like the perfect architectural blueprint under construction. Our Professional 3D Puzzle Charts PowerPoint template is crafted for visionaries in architecture, marketing, and consulting who crave presentations that puzzle out complexity with elegance. Boasting 11 editable slides, this toolkit turns dry stats into dynamic narratives, whether you're illustrating site analysis for a landmark project or dissecting market segments for a branding overhaul.
Inspired by SlideModel's puzzle piece templates that powered a tech startup's investor deck - securing $5M by visually mapping product ecosystem interdependencies - this template delivers that same wow factor. For design professionals, it's a bridge between conceptual sketches and concrete proposals, helping you convey how elements like zoning variances and aesthetic choices interlock to form cohesive urban visions.
Elevate Storytelling with Puzzle-Powered Visuals
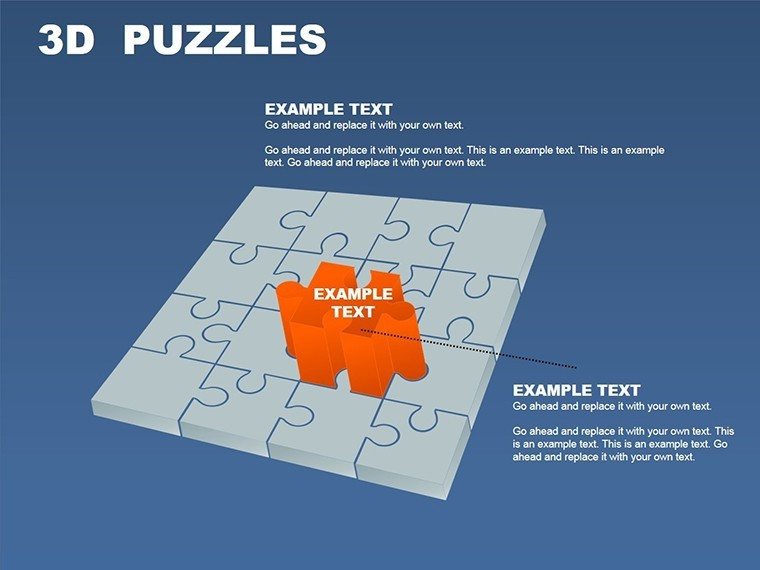
Why settle for linear charts when you can orchestrate a symphony of 3D pieces that reveal themselves layer by layer? This template's puzzle motif mirrors the iterative nature of architectural design, where each component - be it structural engineering data or sustainability metrics - slots into the larger framework. As highlighted in SlideGeeks' puzzle chart examples, such visuals boost retention by 40% in professional settings, making them indispensable for high-stakes pitches.
Consider a New York firm using analogous 3D puzzles to present a adaptive reuse project: Audience feedback noted how the interlocking visuals clarified renovation challenges, leading to unanimous partner buy-in. Our template replicates this with precision, ensuring your slides not only inform but inspire action.
Effortless Compatibility and Editing
Built for the real world, it integrates flawlessly with PowerPoint 2010+, Google Slides, and even Keynote. Editable down to the finest detail, from reshaping puzzle edges to syncing animations with your voiceover on material selections, it's a time-saver for busy creatives.
Standout Features for Impactful Designs
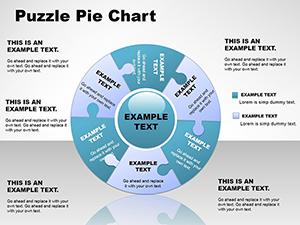
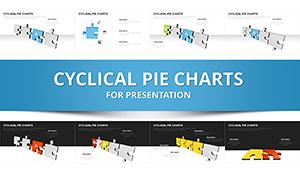
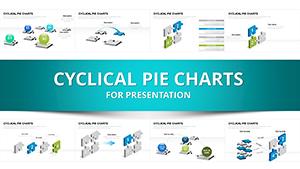
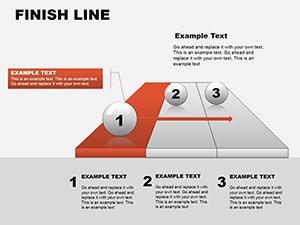
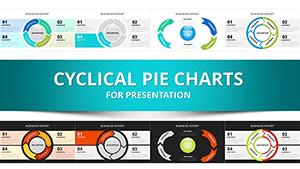
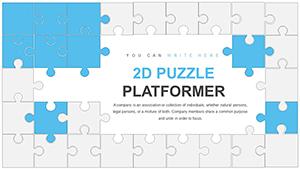
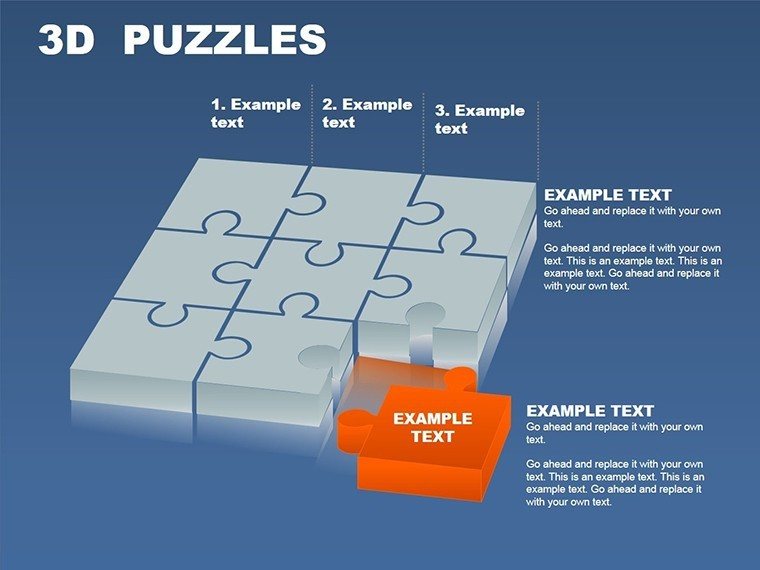
- 11 Versatile Slides: Pie charts, bar graphs, and infographics reimagined as 3D puzzles for multifaceted data display.
- Brand-Aligned Customization: Flexible colors and fonts to echo your portfolio's palette, from minimalist modernism to vibrant postmodernism.
- Animated Transitions: Smooth reveals that mimic puzzle assembly, enhancing flow in multi-phase project overviews.
- Data-Driven Core: Built-in tables for quick imports, supporting real-time updates during collaborative reviews.
- Multi-Format Exports: From interactive PDFs to video embeds, perfect for virtual gallery walks or client portals.
These aren't generic add-ons; they're honed for scenarios like educational webinars on parametric design, where puzzle charts from Slidesgo templates have engaged thousands by breaking down algorithmic processes into digestible parts.
Targeted Use Cases: Piecing Together Success
For marketers in architecture firms, Slide #7's infographic puzzle dissects campaign ROI, with 3D depth layering digital vs. traditional outreach - echoing SlideTeam's top puzzle charts that streamlined a agency's client reporting. Customize with your analytics export, and add hover effects for interactive demos.
Educators training the next generation of designers can leverage Slide #3's bar graph puzzle to compare historical vs. contemporary materials, fostering discussions on innovation. A case from a London school, using similar visuals, saw student comprehension soar, as per infographic best practices.
- Ideation: Sketch your data story; select puzzle layouts that fit narrative arcs.
- Build: Populate with project specifics, like LEED certification breakdowns.
- Refine: Test animations on sample audiences for timing tweaks.
- Deploy: Share via cloud links for feedback loops, iterating like true design pros.
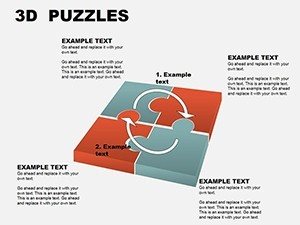
Consultants will find Slide #9's matrix invaluable for risk assessments in infrastructure bids, where interlocking pieces highlight mitigation strategies.
Pro Tips from Design Veterans
Layer your puzzles thoughtfully: Foreground critical data like cost variances, background supporting stats. Align with Gestalt principles for intuitive reading - a staple in AIA visual guidelines. For hybrid events, optimize for screen ratios to keep 3D effects crisp.
Assemble Your Masterpiece - Get Started Now
Don't let scattered data derail your vision. With our 3D Puzzle Charts, every presentation becomes a solved enigma, propelling your ideas forward. Download today and start connecting the dots to architectural excellence!
Frequently Asked Questions
Are animations compatible across platforms?
Yes, they render smoothly in PowerPoint, Google Slides, and Keynote with minimal tweaks.
How can architects use these for client pitches?
Perfect for mapping project interdependencies, like site integration and budget flows.
What's the file format for easy editing?
.potx for PowerPoint, fully vector-based for scalability.
Is commercial licensing included?
Yes, for all professional applications, including firm-wide use.
Can I add my own icons?
Absolutely - seamless integration with your custom architectural symbols.
How many chart types are there?
Multiple, including pies, bars, and matrices, all puzzle-themed.