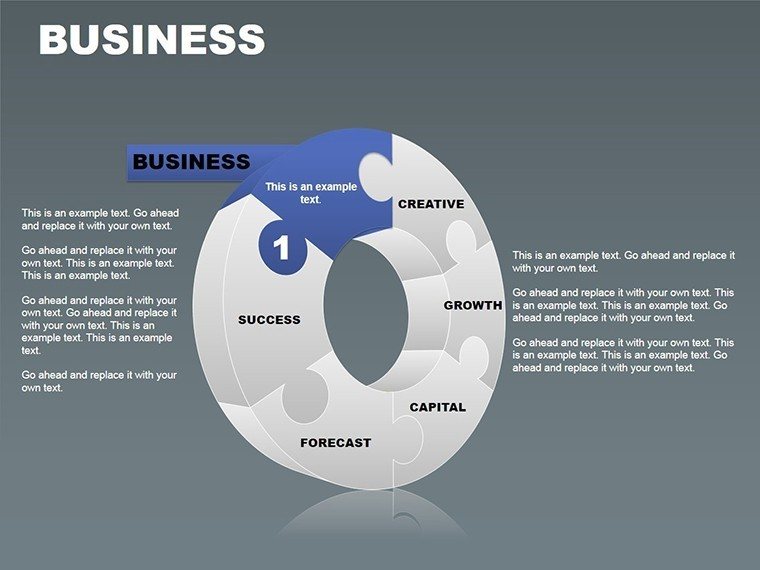
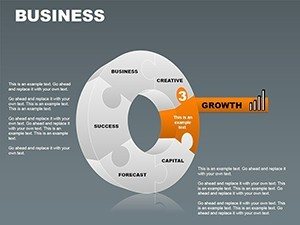
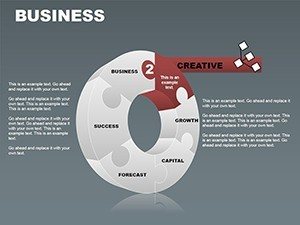
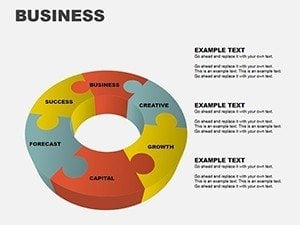
3D Business Puzzle Charts for PowerPoint: Unlock Data Magic


Type: PowerPoint Charts template
Category: Cycle, Business Models, Pie, 3D, Puzzles
Sources Available: .pot, .potx
Product ID: PC00058
Template incl.: 15 editable slides
Imagine transforming a monotonous boardroom pitch into a mesmerizing journey where data pieces fit together like a high-stakes puzzle, revealing strategic insights at every turn. That's the power of our 3D Business Puzzle Charts PowerPoint template - a game-changer for architects, consultants, and business leaders who need to visualize intricate project timelines, budget breakdowns, or market analyses without losing their audience's attention. With 15 fully editable slides, this template isn't just a tool; it's your secret weapon for crafting presentations that resonate, from AIA award submissions to client proposals for sustainable urban developments.
Drawing from real-world successes, like how SlideTeam's 3D business case templates helped a Fortune 500 firm illustrate supply chain dependencies during a merger pitch, reducing decision time by 30%, our charts bring that same depth to your work. Whether you're mapping architectural phases or forecasting ROI on green building initiatives, these 3D puzzles make abstract numbers tangible, fostering deeper understanding and sparking conversations that close deals.
Why 3D Puzzle Charts Revolutionize Your Architectural and Business Presentations
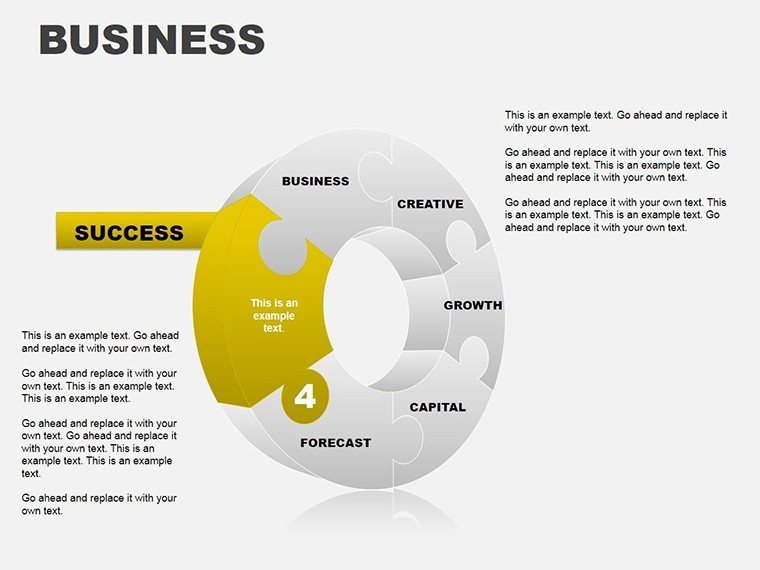
In the fast-paced world of design and strategy, where every slide counts toward securing that next big contract, traditional flat charts fall short. Our 3D Business Puzzle Charts elevate your narrative by adding dimension - literally. Picture interlocking gears representing phased construction milestones, or pie slices morphing into puzzle pieces to show stakeholder contributions in a mixed-use development project. This isn't gimmicky; it's grounded in proven visual storytelling techniques recommended by presentation experts at INK PPT, who emphasize how 3D elements enhance clarity and impact in business visuals.
For architects juggling multiple variables like material costs, environmental impacts, and regulatory compliance, these charts simplify complexity. A recent case from a mid-sized firm in Chicago used similar 3D visuals to pitch a high-rise renovation, highlighting how energy-efficient features interlock with budget constraints - resulting in a 25% faster approval from city planners. The template's vector-based icons and smooth animations ensure your data doesn't just sit there; it assembles dynamically, mirroring the collaborative essence of modern architecture.
Seamless Integration with Your Workflow
Compatibility is key in professional tools, and this template shines across Microsoft PowerPoint 2010+ and Google Slides, with .potx files for easy import. No steep learning curve - simply drag and drop your data into pre-built tables, tweak colors to match your firm's branding (think earthy tones for eco-focused designs), and watch animations unfold. It's designed for efficiency, saving hours that you'd otherwise spend wrestling with basic shapes.
Key Features That Set Our Template Apart
- 15 Editable Slides: From introductory overview puzzles to detailed dependency matrices, each slide is a standalone powerhouse, ready for customization.
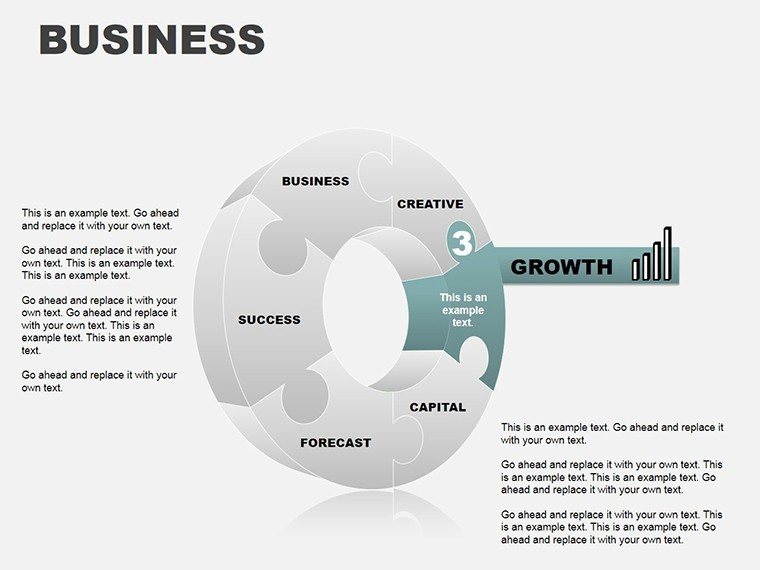
- High-Quality 3D Animations: Custom effects that reveal pieces sequentially, ideal for unveiling phased architectural plans step-by-step.
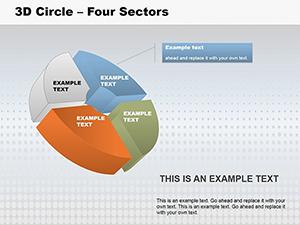
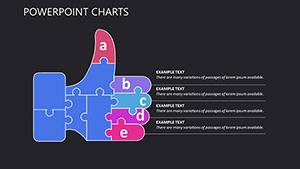
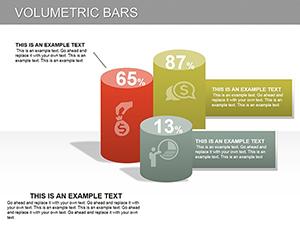
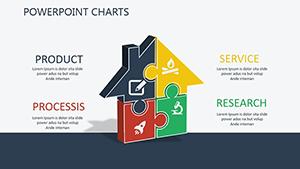
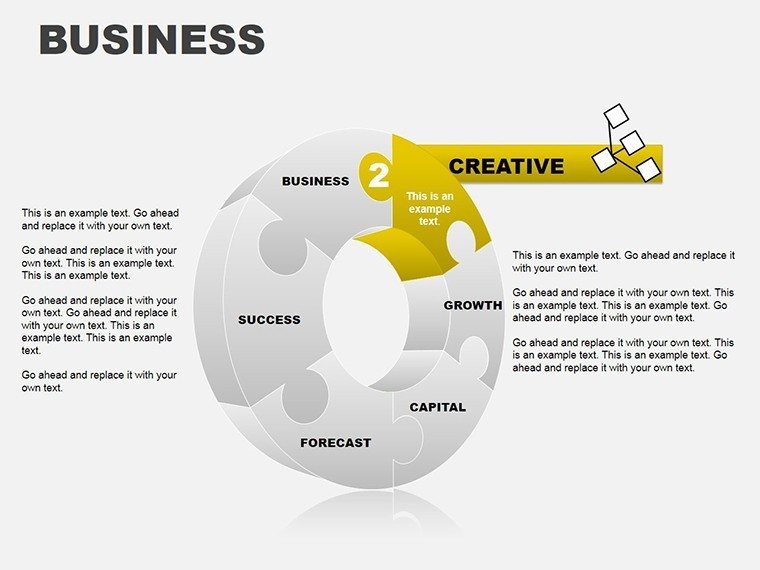
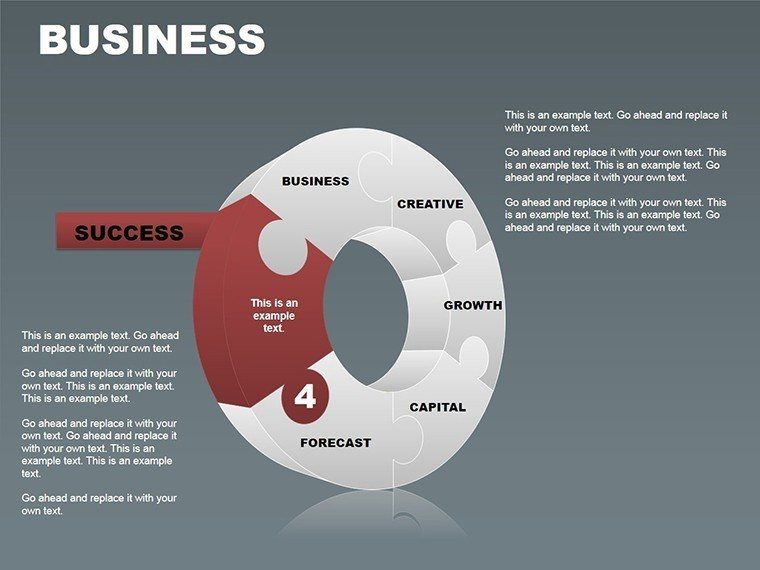
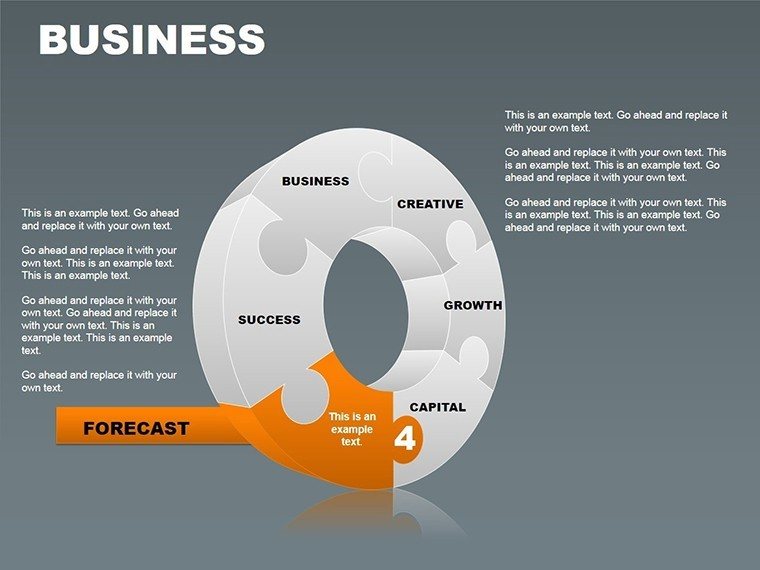
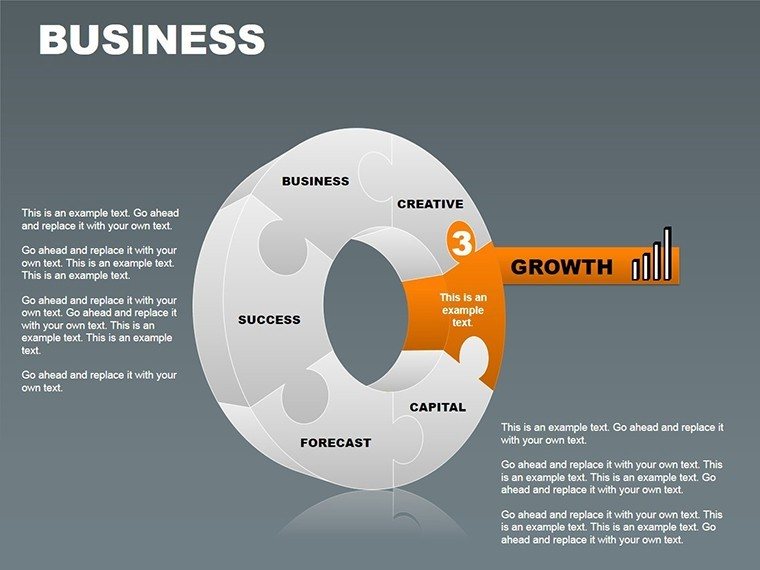
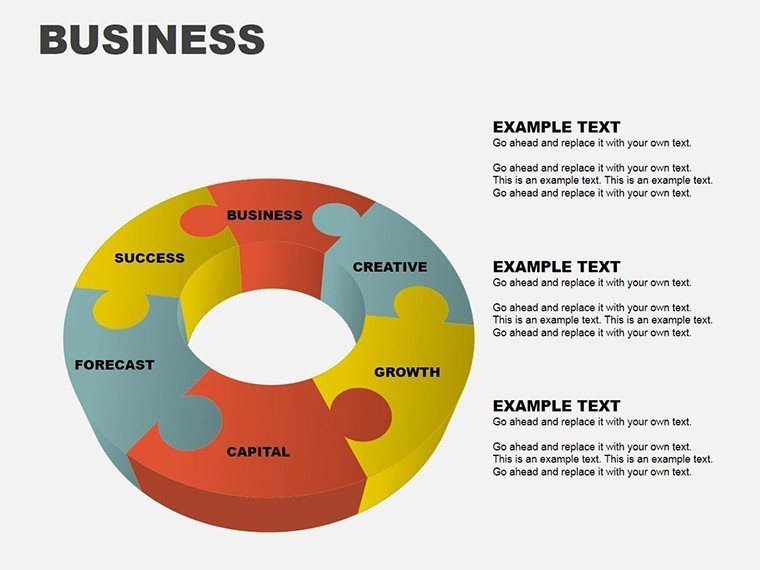
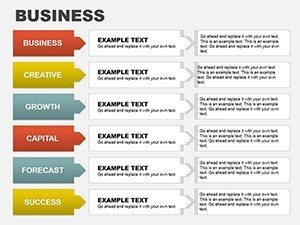
- Vector Icons and Infographics: Scalable elements including business models, cycles, and pie charts, all themed around interlocking puzzles for thematic consistency.
- Multimedia Support: Embed videos of site walkthroughs or audio clips from stakeholder interviews directly into slides for immersive storytelling.
- Color and Text Flexibility: One-click changes to align with AIA presentation guidelines, ensuring professional polish every time.
These features aren't just bells and whistles; they're tailored to address pain points like data overload in design reviews. As one user from a Boston architecture studio shared in a SlideTeam testimonial, "Switching to 3D puzzle visuals cut our revision cycles in half - clients finally 'see' the big picture."
Real-World Applications: From Blueprints to Boardrooms
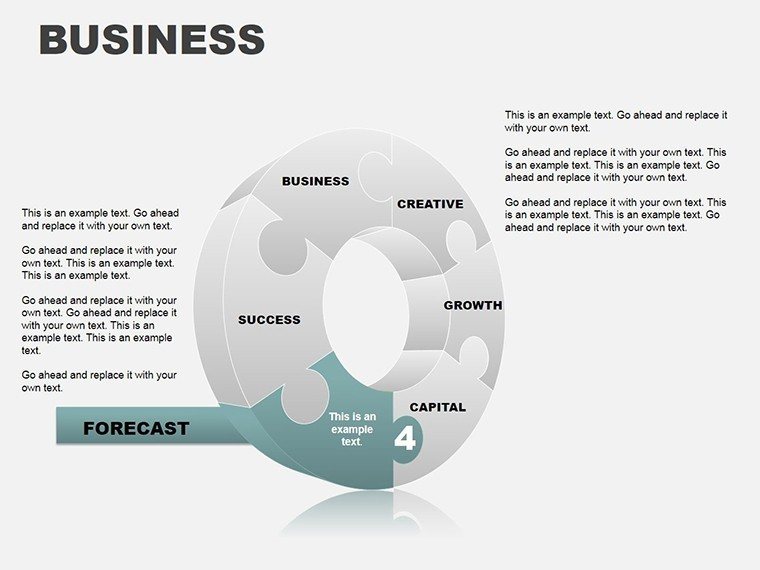
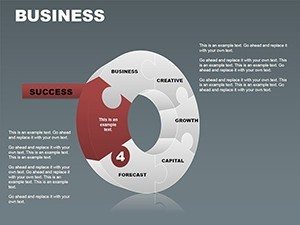
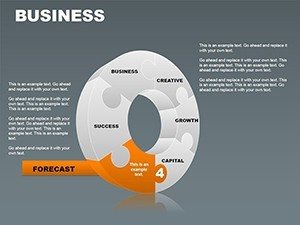
Let's dive into how this template shines in action. For urban planners tackling mixed-use developments, Slide #5's cycle puzzle chart breaks down traffic flow impacts across phases, using 3D depth to layer pedestrian, vehicular, and green space data. Customize it with real metrics from your CAD software export, and add subtle animations to simulate progression over time - perfect for zoning board approvals.
In a consulting scenario, inspired by data-driven case studies from SlideTeam, use Slide #10's dependency graph to map how material shortages ripple through a project's timeline. Architects at a Seattle firm applied a similar approach to visualize supply chain risks in a waterfront redevelopment, impressing investors with its intuitive flow and securing $2M in funding.
- Preparation: Import your Excel data into PowerPoint; the template's smart tables auto-populate puzzle segments.
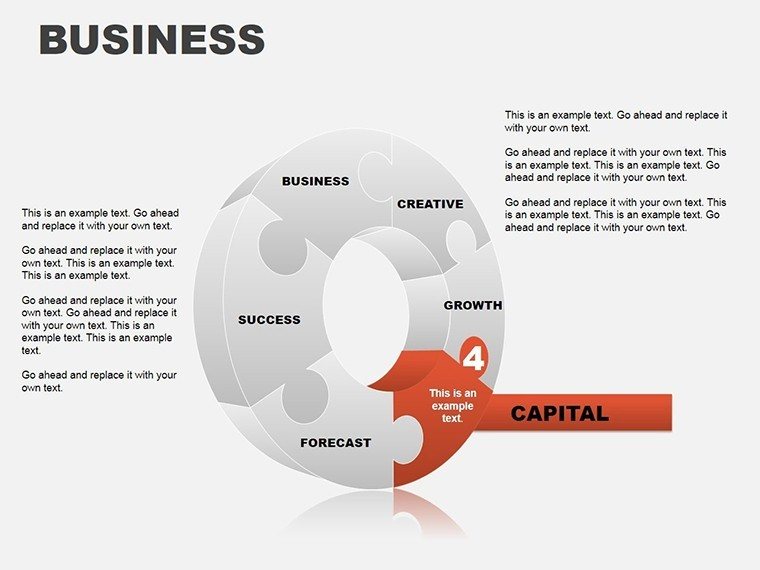
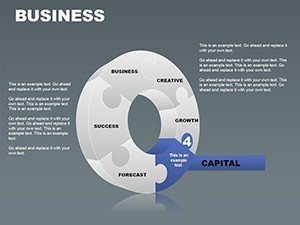
- Customization: Adjust 3D angles for emphasis - tilt a piece to spotlight cost overruns in foundation work.
- Presentation: Rehearse with built-in transitions; record voiceovers for remote client shares.
- Follow-Up: Export as PDF or video for post-meeting recaps, maintaining that puzzle-solving allure.
Beyond architecture, marketers in design firms love it for campaign roadmaps, where puzzle pieces represent channel integrations, echoing puzzle-themed successes in professional decks from SlideModel.
Expert Tips to Maximize Impact
To truly harness this template's potential, start with audience analysis: For conservative stakeholders, opt for muted palettes; for creative teams, amp up the vibrancy. Pair charts with narrative anchors - like "This piece represents our sustainability commitment" - to guide viewers, a technique honed from years of crafting AIA-compliant visuals. Avoid over-animation; let the 3D structure do the heavy lifting, ensuring your message lands with precision.
Integration tip: Link slides to external dashboards for live updates during virtual pitches, keeping your architectural visions dynamic and data-fresh.
Transform Your Next Pitch - Download Today
Ready to piece together presentations that puzzle-proof your success? With our 3D Business Puzzle Charts, you're not just presenting data; you're architecting persuasion. Grab the template now and watch your ideas interlock into unforgettable stories. Elevate your pitches - start customizing today!
Frequently Asked Questions
How editable are the 3D puzzle charts?
Fully editable! Change colors, text, data, and animations via standard PowerPoint tools - no advanced skills required.
Is this template suitable for architectural presentations?
Absolutely - ideal for visualizing project phases, budgets, and stakeholder alignments in design pitches.
Does it work with Google Slides?
Yes, seamless import from .potx files, with full animation support.
Can I use it for commercial projects?
Yes, licensed for personal and professional use, including client work.
How many slides are included?
15 high-quality, themed slides ready for immediate use.