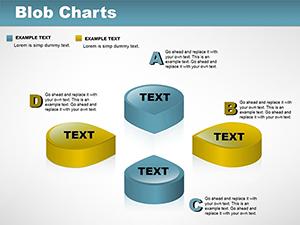
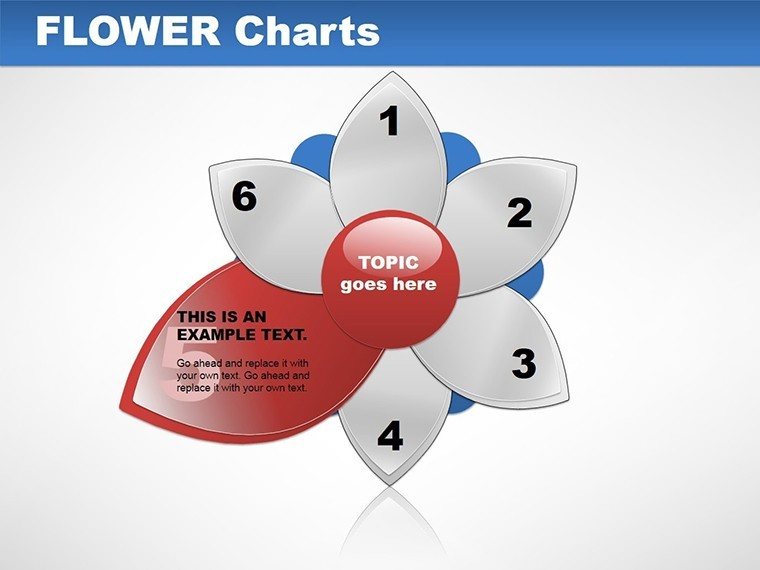
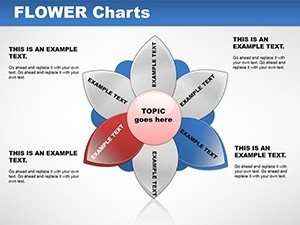
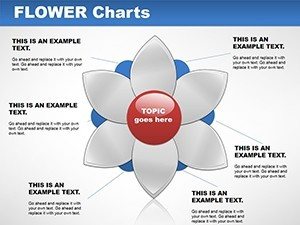
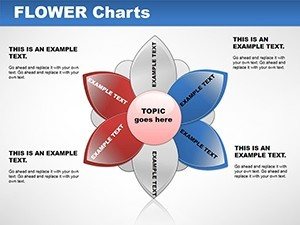
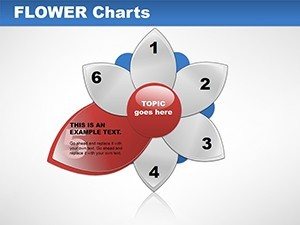
Flower Chart PowerPoint Template


Type: PowerPoint Charts template
Category: Relationship, Tables, Illustrations, Spheres
Sources Available: .potx
Product ID: PC00048
Template incl.: 11 editable slides
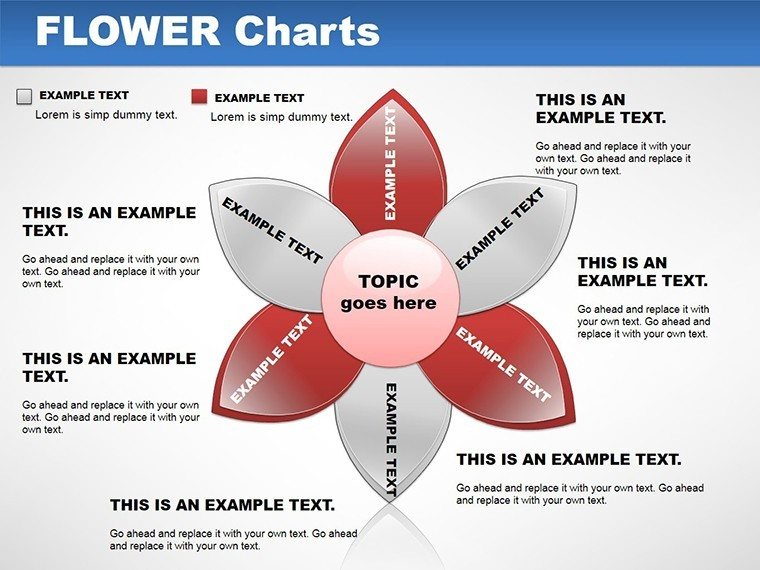
As someone who`s spent years crafting presentations for sustainability consultants and creative teams, I know how tough it can be to make numbers feel alive. Standard charts often fall flat, leaving audiences glazing over during those key metrics slides. That`s where this flower chart PowerPoint template steps in. It weaves your data into organic, petal-by-petal designs that draw eyes and spark conversations, turning a routine report into something that lingers like a garden in full bloom.
I`ve used templates like this one in client workshops for environmental nonprofits and marketing firms, where we needed to highlight growth trends without overwhelming the room. The result? Attendees lean in, nod along, and remember the insights long after the meeting ends. Whether you`re mapping out quarterly progress for a green initiative or breaking down audience segments for a campaign, these slides make complex info accessible and engaging.
Why Choose Flower-Themed Charts for Your Next Presentation
Think about the last time you presented sales data. Did it feel like reciting a spreadsheet? Floral motifs change that by layering symbolism into your visuals - stems for steady ascent, petals for segmented shares. In my experience with project managers tracking timelines, this approach not only clarifies the story but also ties it to themes of growth and harmony, especially fitting for topics like sustainability or team development.
This template packs 11 fully editable slides, each built to handle real-world data without fuss. You drop in your figures, tweak the colors to match your brand, and watch the design adapt seamlessly. No more wrestling with clunky animations or mismatched fonts; everything flows as naturally as a vine climbing a trellis.
Explore the Slide Designs That Bring Data to Life
Start with the opening slide, a serene canvas where soft watercolor blooms frame your title and subtitle. It`s understated yet inviting, setting a tone of thoughtful revelation rather than hard sell. I`ve opened sessions with this for landscape architecture pitches, and it immediately eases the group into the material.
Move to the bar chart slide, where vertical stems rise like young shoots to represent metrics such as revenue streams or task completions. Each bar ends in a cluster of petals, color-coded for quick scanning - say, deep rose for high performers and pale lavender for areas needing nurture. In a recent session with event coordinators, we used this to visualize attendee flows, making adjustments feel intuitive and collaborative.
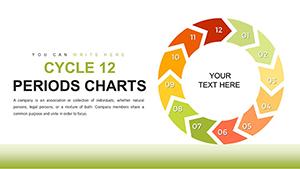
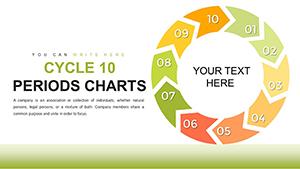
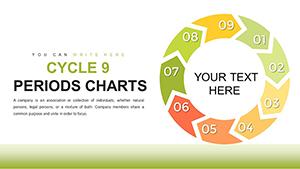
The donut chart slide mimics a woven wreath, ideal for circular data like budget allocations or market shares. Petals fan out around the central ring, with labels curling gently like tendrils. Founders I`ve worked with love this for investor updates, as it conveys wholeness and interconnectedness without the stark lines of traditional pies.
For trends over time, the line chart employs curving vines that connect data points with elegant arcs. Dots bloom into small flowers at peaks, subtly emphasizing successes. Educators mapping student progress have told me this visual turns abstract scores into a narrative of seasonal change, fostering deeper discussions.
Don`t overlook the table slide, formatted with delicate borders resembling leaf veins. Rows and columns nestle amid faint floral patterns, keeping dense info readable. I`ve relied on this for consultant reports comparing vendor options, where the subtle texture prevents the grid from feeling cold or corporate.
Rounding out the set are versatile icon slides featuring hand-sketched elements like buzzing bees for collaboration stats or dewdrops for fresh ideas. These integrate anywhere, adding whimsy to bullet lists or as standalone accents. The whole collection uses a palette of earthy greens, warm pinks, and cool blues - fully adjustable to evoke calm forests or vibrant meadows, depending on your story.
How This Template Fits Your Workflow
Compatibility is key in my line of work, juggling client files across platforms. This template shines in PowerPoint and Google Slides alike, with vector elements that scale perfectly for web shares or large prints. Animations are optional but effective - imagine petals unfurling on click to reveal segments, adding a layer of delight without distraction.
Customization takes minutes: swap hues via the color theme tool, resize icons without losing crispness, or layer in your logo over the textured background. For accessibility, built-in prompts guide alt text additions, ensuring everyone follows along. Project managers I`ve coached use it to condense Gantt-style timelines into vine-wrapped paths, slashing prep time while boosting clarity.
Real-World Wins from Everyday Users
In one memorable collaboration with a marketing lead at a wellness brand, we repurposed the wreath donut for customer personas. What started as scattered demographics became a unified portrait of interconnected needs, leading to sharper strategy sessions. Similarly, biology instructors have adapted the stem bars for ecosystem balances, making abstract concepts tangible for undergrads.
For urban planners charting green space distributions, the line vines illustrate phased rollouts with poetic precision. These aren`t hypotheticals - they`re the outcomes I`ve seen firsthand, where a touch of nature elevates data from forgettable to unforgettable.
Unlock Engaging Visuals Today
Ready to let your data flourish? Open this flower chart PowerPoint template and infuse your next deck with effortless elegance. It`s designed for those moments when you want substance wrapped in style, helping your ideas take root and grow.
Frequently Asked Questions
Can I use this template for non-nature-related presentations?
Absolutely. The floral elements are subtle and symbolic, working well for any growth-oriented topic like business metrics or educational timelines. Just adjust colors to fit your theme.
How many slides come with the flower chart template?
You get 11 editable slides, covering bars, donuts, lines, tables, and icons - enough variety for a complete deck without excess.
Is it easy to add my own data to these flower charts?
Yes, placeholders make it simple: paste your numbers, and the designs update automatically. No advanced skills needed.
Does the template support animations for the floral elements?
It includes gentle entrance animations like blooming reveals, which you can enable or disable per slide for smooth flow.
Can I customize the colors in this PowerPoint flower template?
Fully - edit the theme to match your branding, from soft pastels to bold accents, while keeping the organic feel intact.
Is this template compatible with Google Slides?
Yes, it imports seamlessly into Google Slides, retaining all edits and layouts for collaborative editing.