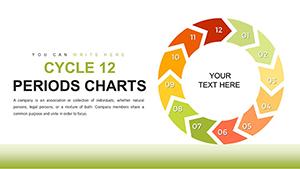
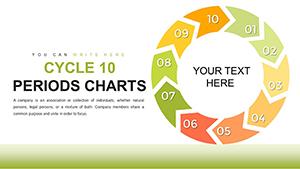
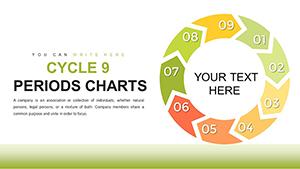
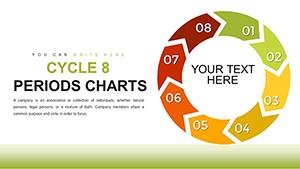
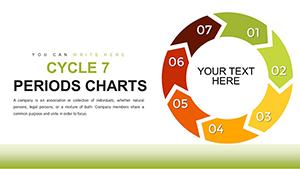
Triangular Cycle PowerPoint Charts Template


Cycles represent the essence of continuity and evolution in business and learning, and our Triangular Cycle PowerPoint Charts Template captures that dynamism perfectly. Aimed at professionals, teachers, and students, this 9-slide collection merges triangular shapes with cycle flows for unique visualizations that stand out. Fully editable in PowerPoint or Google Slides, it allows you to depict recurring processes, feedback loops, or iterative developments with elegance. Envision illustrating project lifecycles in a status update or teaching biological cycles in class - these designs make abstract loops concrete and memorable. More than charts, they're narrative drivers that encourage cyclical thinking, ideal for fostering innovation in team meetings or academic settings. Step away from linear timelines; embrace triangles that symbolize balance and progression in your presentations.
Harnessing Cyclical Power in Visuals
Triangular cycles blend stability with motion, akin to agile methodologies where phases loop back. Tables add structure for data points within cycles.
Core Features Driving Engagement
- Flow Customization: Alter cycle paths, triangles, and arrows to suit your story's rhythm.
- Table Synergies: Embed tables in cycles for metric tracking per phase.
- Smooth Animations: Cycle through elements with built-in transitions for fluid storytelling.
- Modern Styling: Clean, angular designs inspired by contemporary infographics.
- Versatile Formats: .potx ready for any setup.
Addresses pitfalls like disjointed flows, offering cohesive alternatives.
Slide-by-Slide Insights and Applications
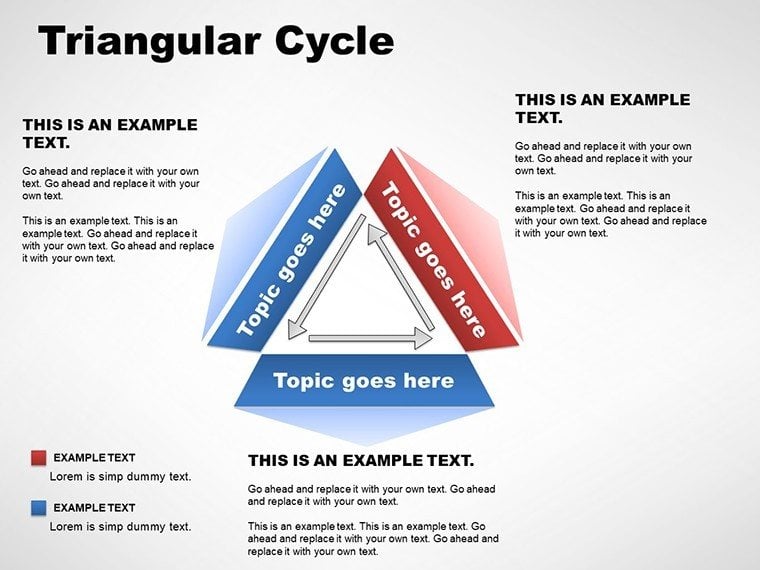
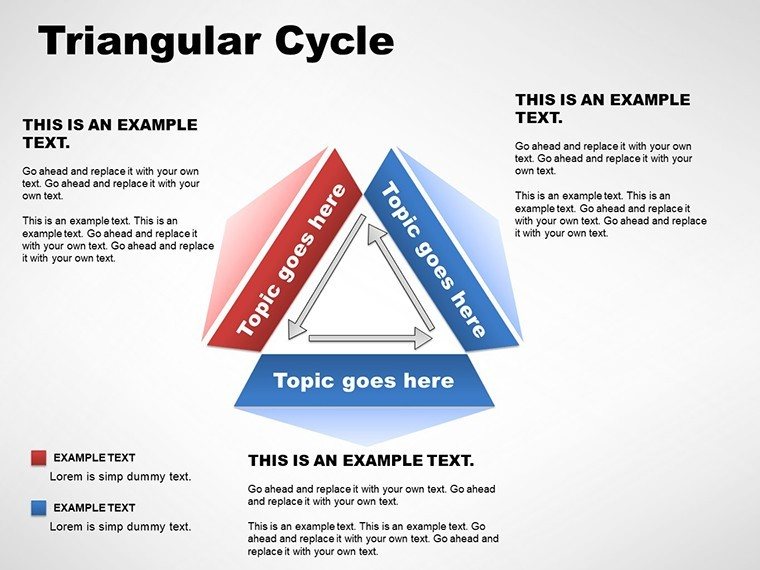
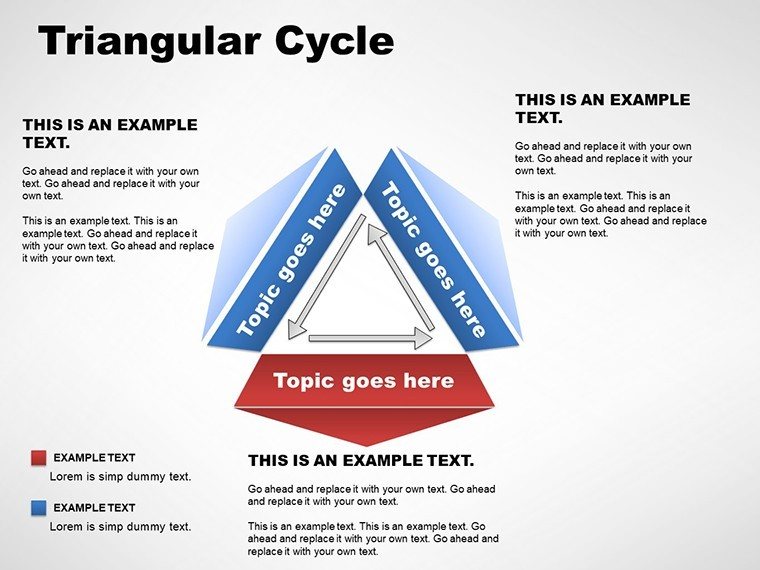
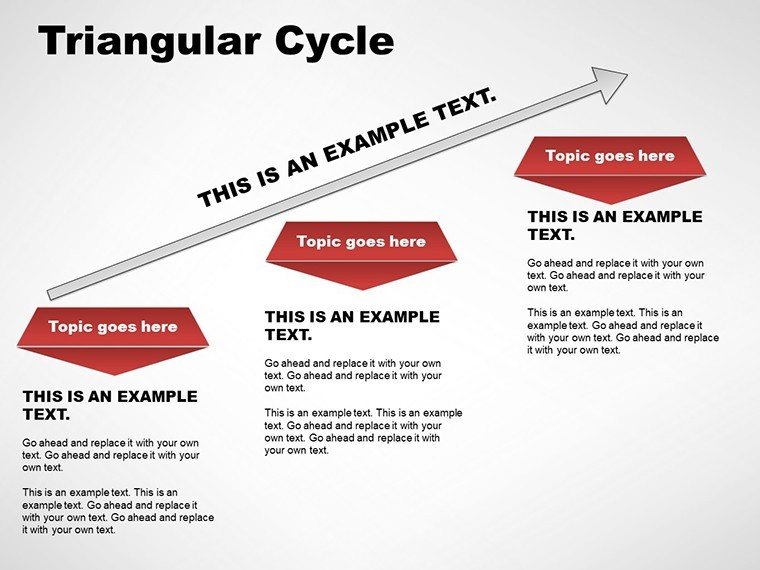
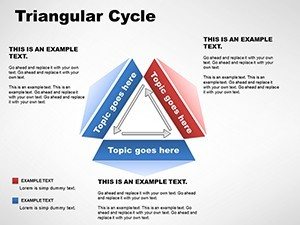
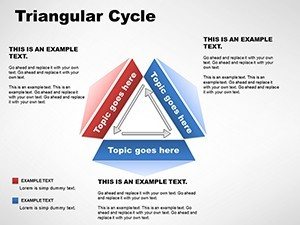
Slide 1 introduces a simple triangular cycle for basics, like plan-do-check-act in quality management.
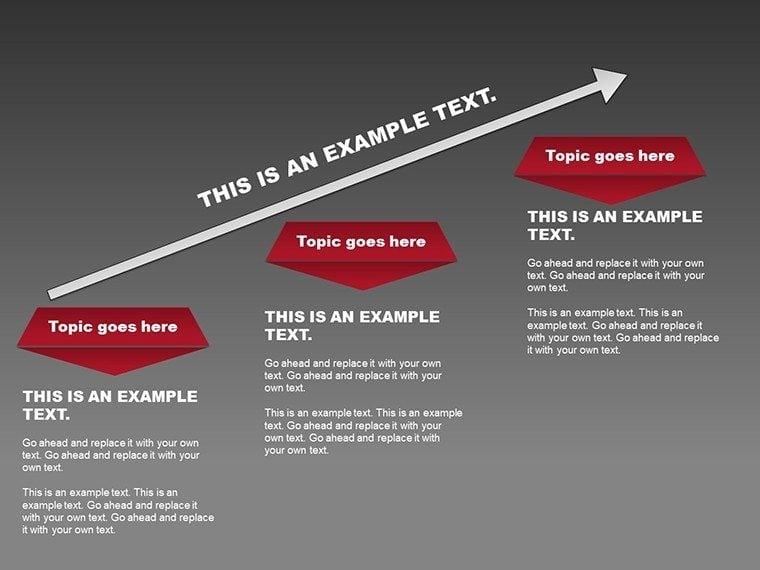
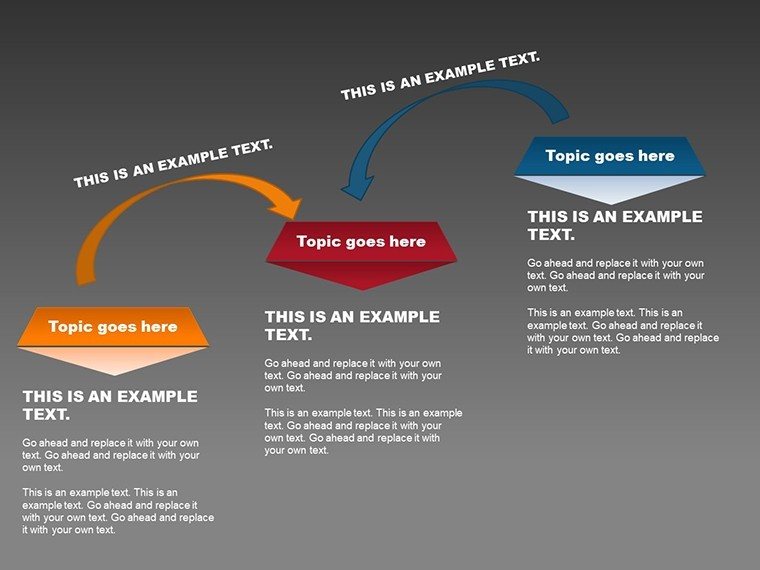
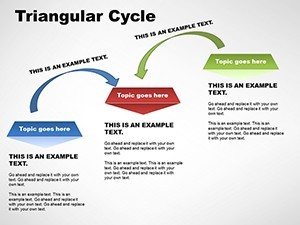
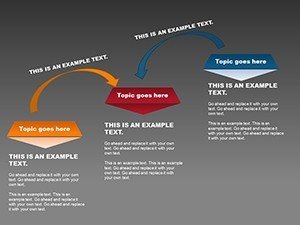
Slides 2-5 build complexity: Slide 2 adds three phases with tables, for marketing funnels. A company applied it to track campaign loops, improving ROI as per Forbes insights. Slide 3 incorporates four triangles, Slide 4 loops with feedback arrows, Slide 5 integrates data tables.
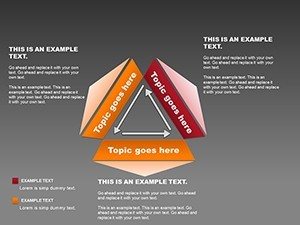
Advanced cycles (Slides 6-7): Slide 6 nests triangles for sub-cycles, Slide 7 expands for multi-level processes.
Conclusion slides 8-9: Summarize with hybrid table-cycles, perfect for action plans.
Students used these for thesis defenses, cycling through research iterations to demonstrate rigor.
Deployment Strategies and Insider Tips
For project managers, map agile sprints; educators cycle through lesson plans.
Tips: Use color coding for phase distinctions. Link to external docs for depth. Practice timing animations.
Real apps include startup pitches showing product development cycles, aligning with Lean principles.
Optimizing Your Presentation Pipeline
Feed data from tools like Asana into cycles. Add thematic icons for visual pop.
Surpasses basic loops with triangular anchors, enhancing stability in visuals.
Developed with user feedback, ensuring reliable, expert-backed designs.
Loop into Better Presentations
This Triangular Cycle template redefines flow - customize it to keep your ideas circulating effectively.
Frequently Asked Questions
How to adjust cycle directions?
Rotate arrows or paths via shape tools.
Animations for cycles?
Yes, sequential for phase reveals.
Best for which scenarios?
Iterative processes, feedback, and recurring data.
Integrate tables how?
Place within or beside cycles for context.
Slide count?
9 editable slides.
Student-friendly?
Yes, intuitive for projects.