Promo code "00LAYOUTS"
Matrix Square Patterns PowerPoint Charts Template
Type: PowerPoint Charts template
Category: Matrix, Business Models, Cubes, Spheres, Puzzles
Sources Available: .pot, .potx
Product ID: PC00043
Template incl.: 14 editable slides
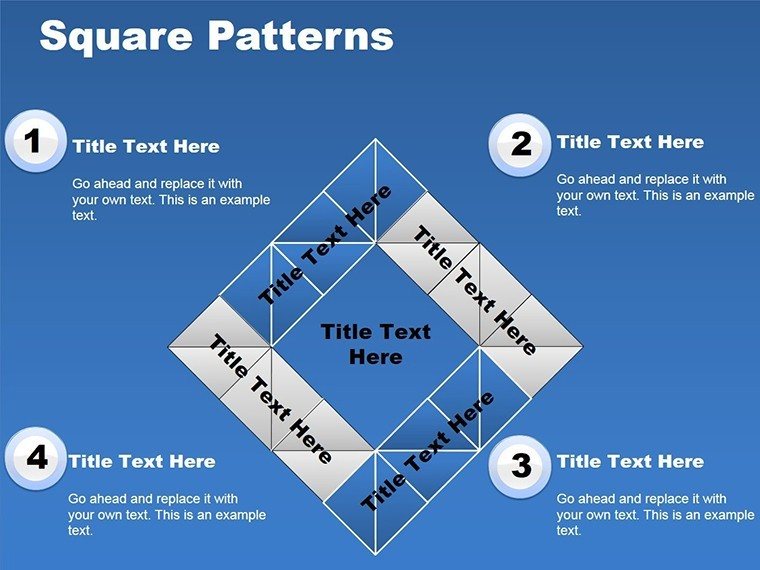
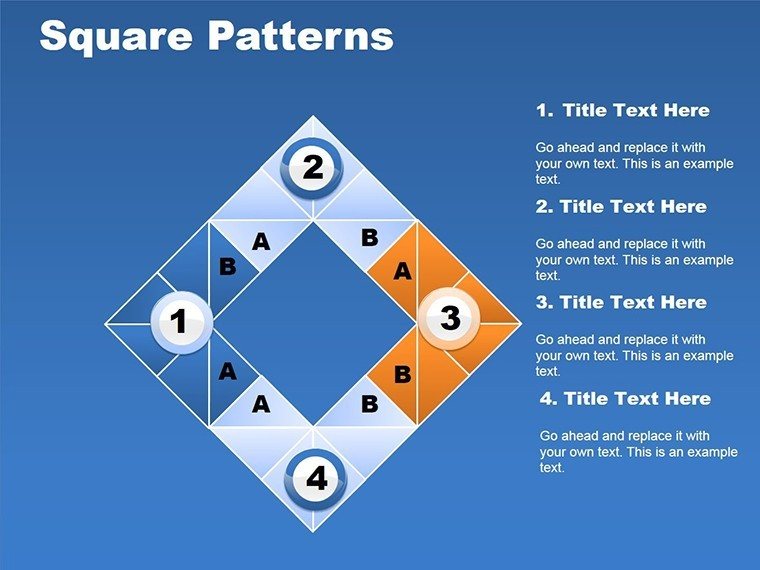
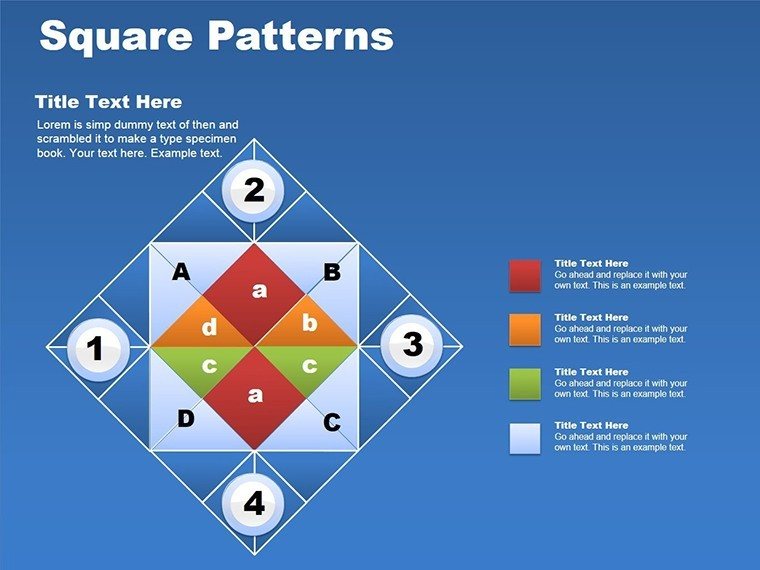
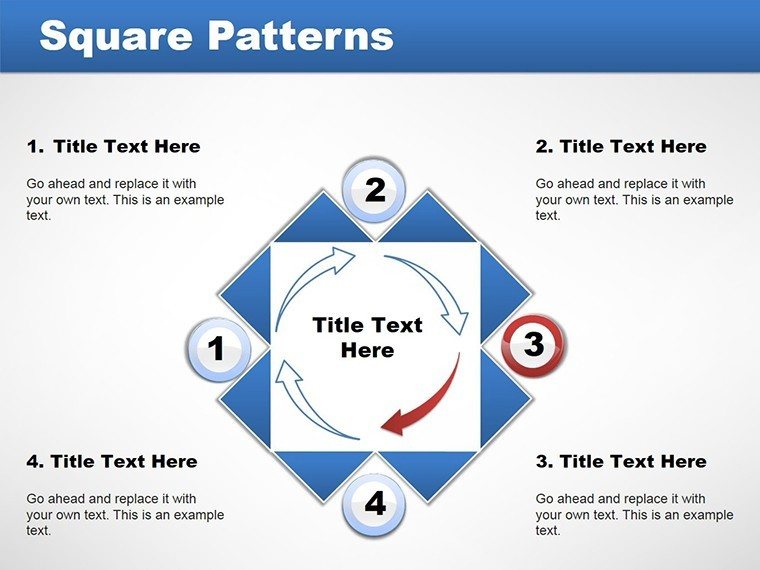
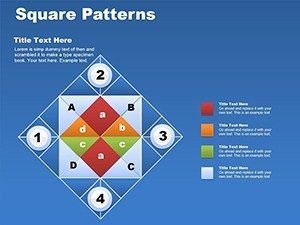
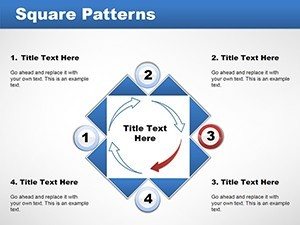
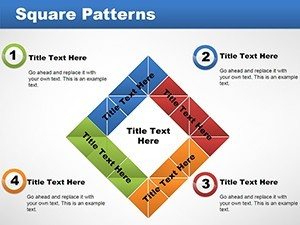
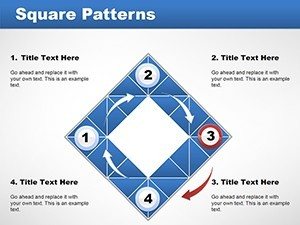
Imagine turning complex datasets into visually stunning narratives that captivate your audience from the first slide. Our Matrix Square Patterns PowerPoint Charts Template is crafted for strategists, educators, and marketers who crave innovative ways to present comparisons, relationships, and multidimensional data. Featuring 14 editable slides, this template draws from geometric precision to offer matrix layouts, cube representations, spherical models, and puzzle integrations - all compatible with PowerPoint and Google Slides. Whether you're dissecting market segments in a boardroom or explaining conceptual frameworks in a classroom, these patterns provide a fresh perspective on data visualization. Say goodbye to bland grids; embrace designs that mimic real-world puzzles, helping your viewers connect dots effortlessly. This template isn't just about aesthetics - it's about enhancing comprehension, sparking discussions, and driving decisions in fields like business analysis or creative brainstorming.
Exploring the Versatility of Matrix Designs
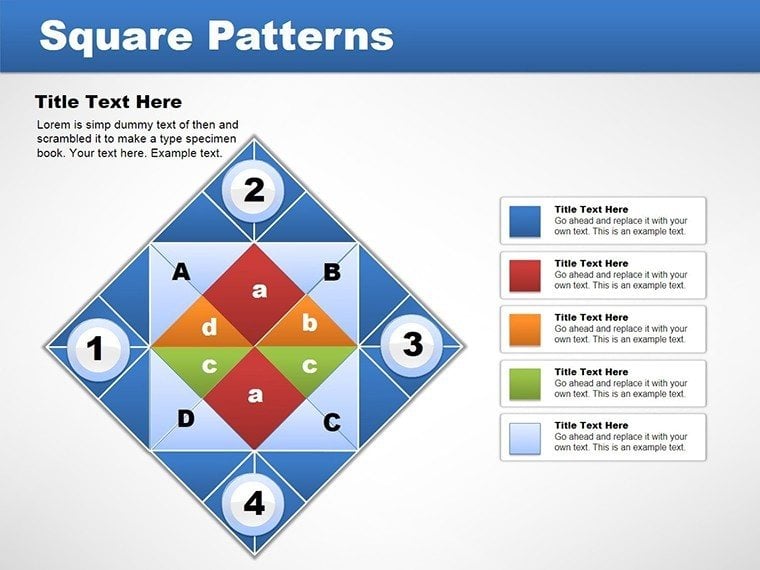
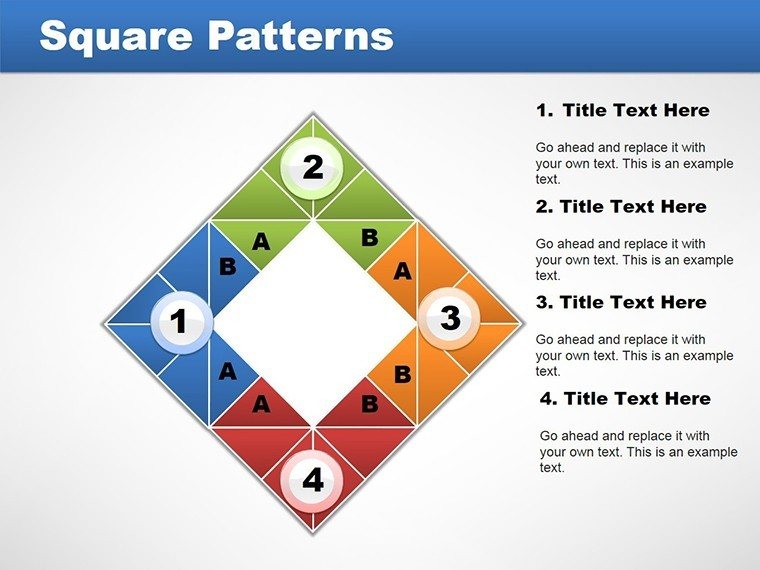
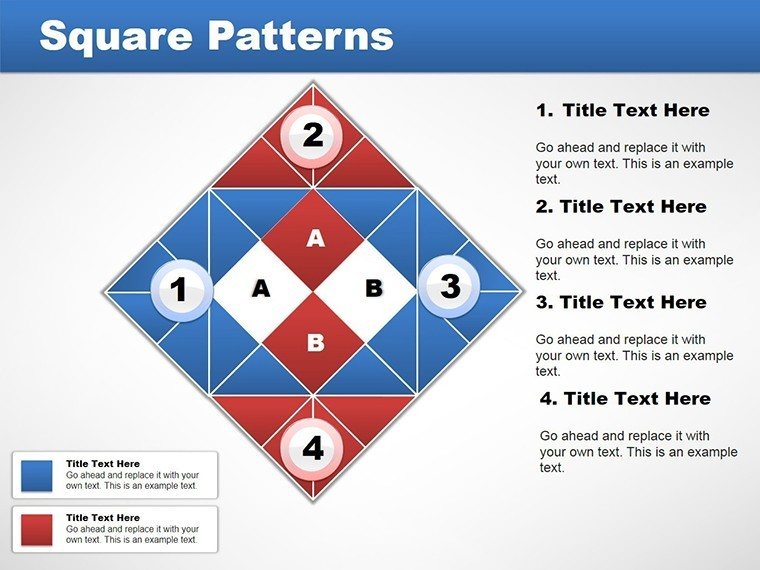
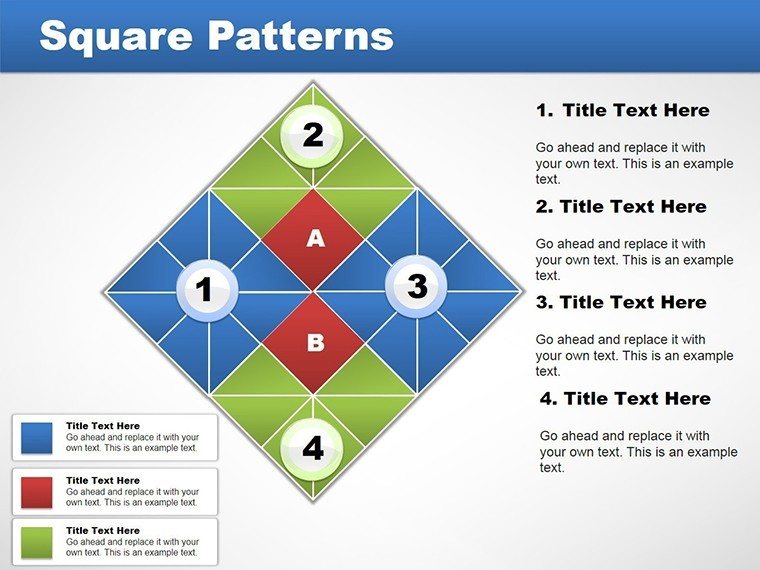
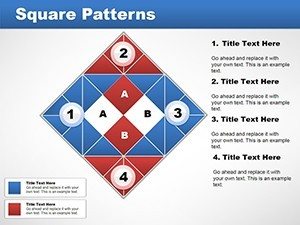
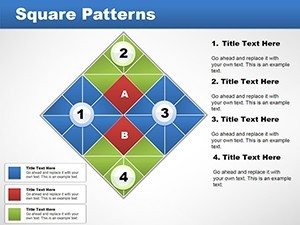
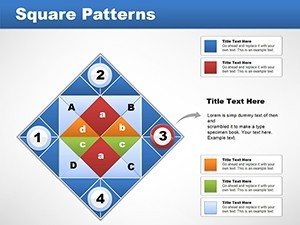
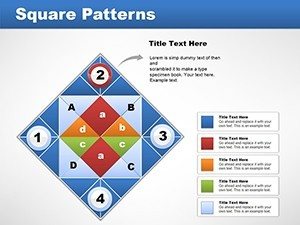
Matrix square patterns excel in illustrating intersections, such as SWOT analyses or product portfolios, inspired by tools like the Boston Consulting Group matrix. Cube elements add depth for 3D modeling, perfect for volume-based metrics, while spheres represent holistic views, like global market shares. Puzzles symbolize interconnected ideas, ideal for innovation workshops.
Standout Features for Professional Polish
- Customizable Patterns: Modify squares, cubes, and spheres with drag-and-drop ease, adapting to your color schemes or themes.
- Diverse Layouts: From simple 2x2 matrices to intricate puzzle assemblies, covering business models and visual metaphors.
- Animation Ready: Built-in slots for animations that reveal patterns layer by layer, keeping audiences engaged.
- High-Resolution Graphics: Vector-based for sharp scaling, ensuring quality on any screen size.
- Cross-Platform Support: Seamless use in PowerPoint (.potx) or Google Slides for team collaborations.
These features solve typical issues like static presentations, offering dynamic alternatives that align with modern design trends from sources like AIGA standards.
In-Depth Slide Overviews and Practical Uses
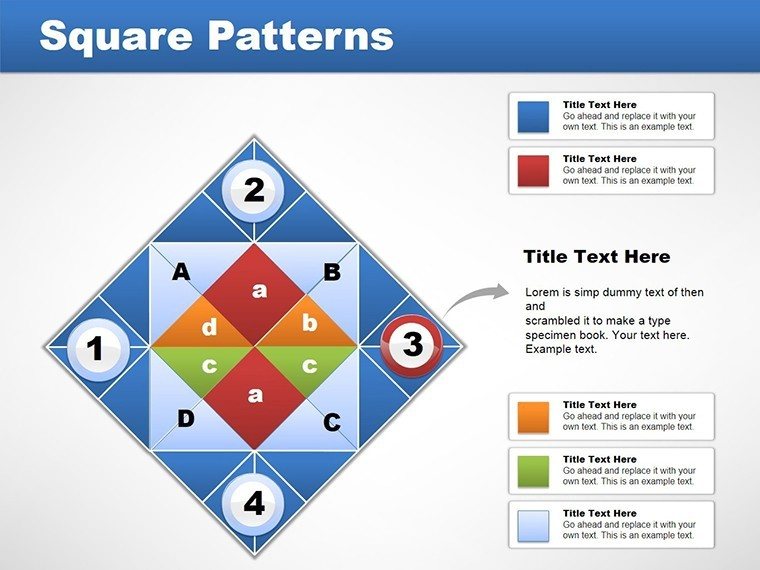
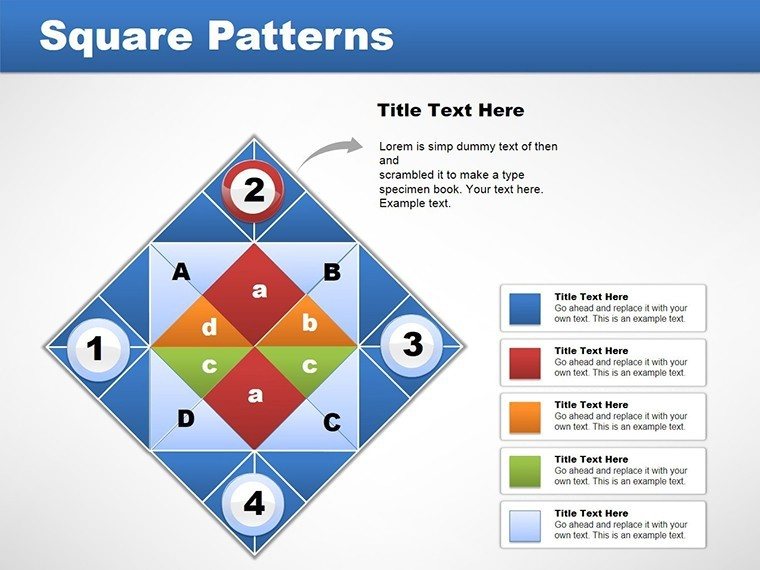
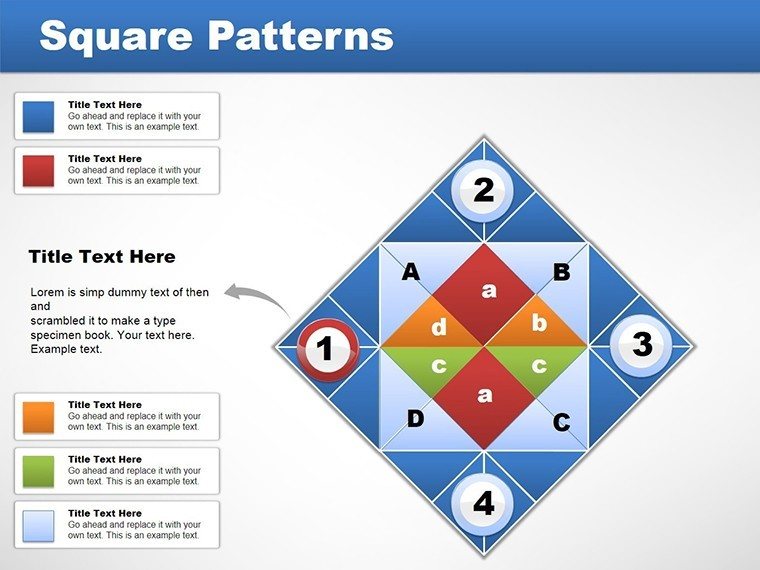
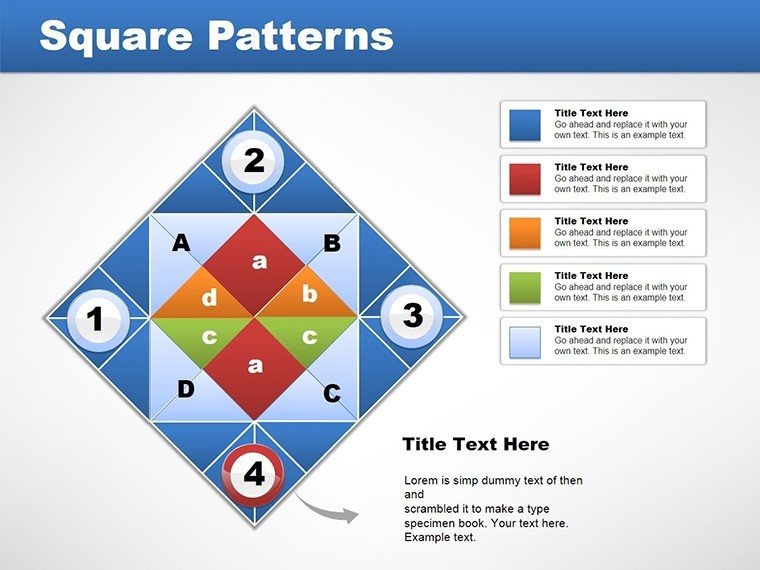
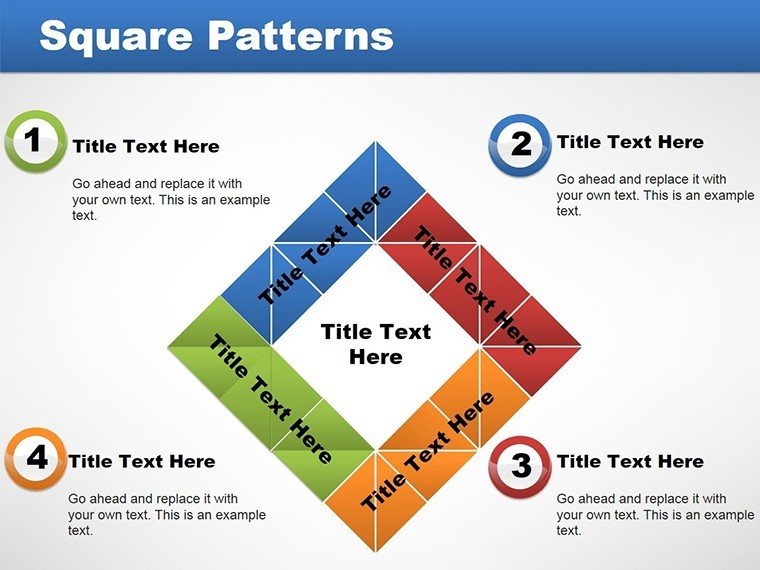
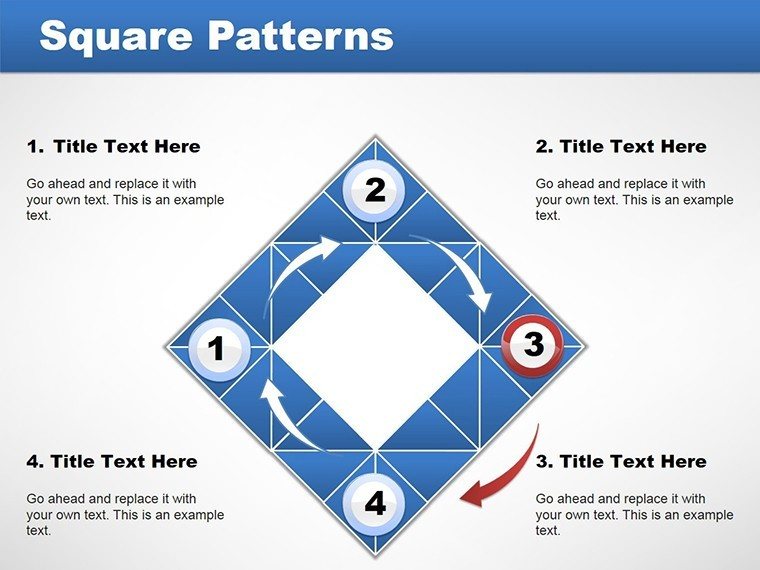
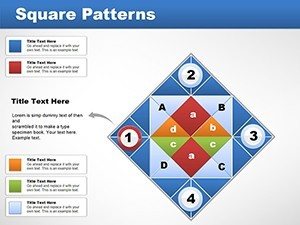
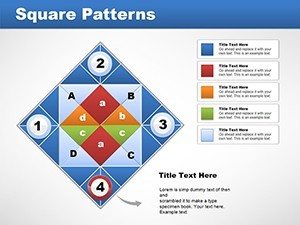
Slide 1 kicks off with a basic matrix square for quick comparisons, like competitor analysis. In a marketing case, a brand used it to map features vs. price, clarifying positioning strategies.
Slides 2-5 delve into cube patterns: Slide 2 builds 3D cubes for volume data, such as sales by region over time. Slide 3 rotates cubes for multi-angle views, useful in product design pitches. Slide 4 stacks them for hierarchical data, Slide 5 explodes them for breakdowns.
Spherical models in Slides 6-8: Slide 6 shows orbiting spheres for relational data, like ecosystem mappings. Slide 7 segments spheres into pies, Slide 8 animates rotations for emphasis.
Puzzle integrations (Slides 9-11): Slide 9 assembles pieces for team-building visuals, Slide 10 interlocks for process flows, Slide 11 highlights missing pieces for gap analyses.
Business model hybrids in Slides 12-14: Combine matrices with puzzles for strategic canvases, ending with summary slides for calls to action.
A startup leveraged these in a pitch deck, using cube patterns to visualize growth projections, securing funding by making abstract concepts tangible.
Strategic Applications and Expert Tips
For consultants, use matrix slides to frame client problems, then puzzles to propose solutions. Educators can animate spheres to teach orbital mechanics or business ecosystems.
Tips: Layer data gradually with animations to avoid overwhelm. Pair with tools like Tableau for live data feeds. Ensure accessibility with alt text on images and high-contrast colors.
In creative industries, these patterns mimic artistic compositions, as seen in design case studies from Behance, adding flair to portfolios.
Integrating into Your Presentation Flow
Start with a matrix overview, build with cubes, connect with puzzles, and conclude with spheres for big-picture insights. This flow mirrors storytelling arcs, enhancing retention.
Versus standard PowerPoint, our template's pre-built patterns cut creation time in half, allowing focus on insights over setup.
Backed by design experts, this template ensures your presentations stand out with authority and innovation.
Elevate Your Visual Storytelling Today
With Matrix Square Patterns, transform data into art that informs and inspires. Don't settle for ordinary - customize this template and captivate your next audience.
Frequently Asked Questions
What makes these patterns unique?
They combine geometric shapes for multidimensional data views, beyond flat grids.
Can I add my own data easily?
Yes, placeholders allow quick integration from spreadsheets.
Are animations included?
Yes, customizable animations enhance engagement.
Suitable for which industries?
Business, education, marketing, and creative fields.
How many customization options?
Unlimited colors, fonts, and layouts for full personalization.
Compatible with older PowerPoint versions?
Yes, works with PowerPoint 2010 and later.

