Dynamic Business Silhouettes PPT Charts Template | Fully Editable Slides for Board Meetings


Type: PowerPoint Charts template
Category: Relationship, Organizational, Illustrations, Silhouettes & People
Sources Available: .pptx
Product ID: PC00034
Template incl.: 19 editable slides
Professional Slide Overview
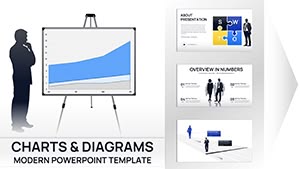
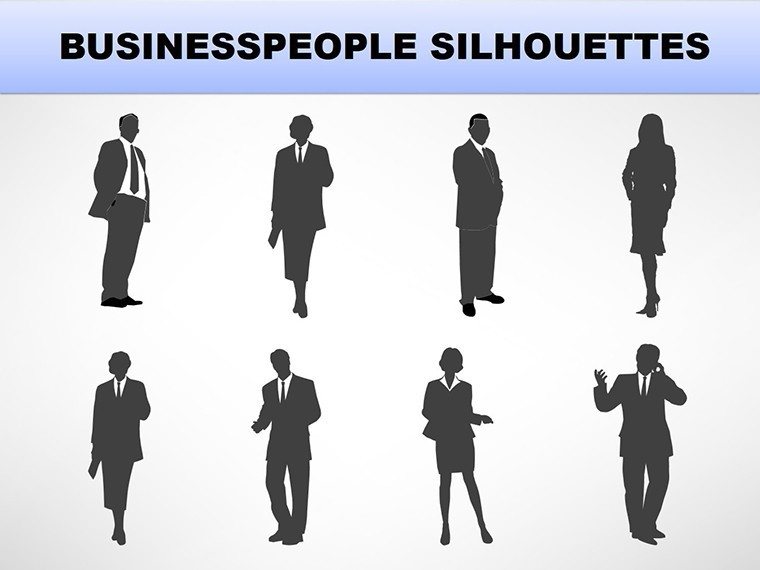
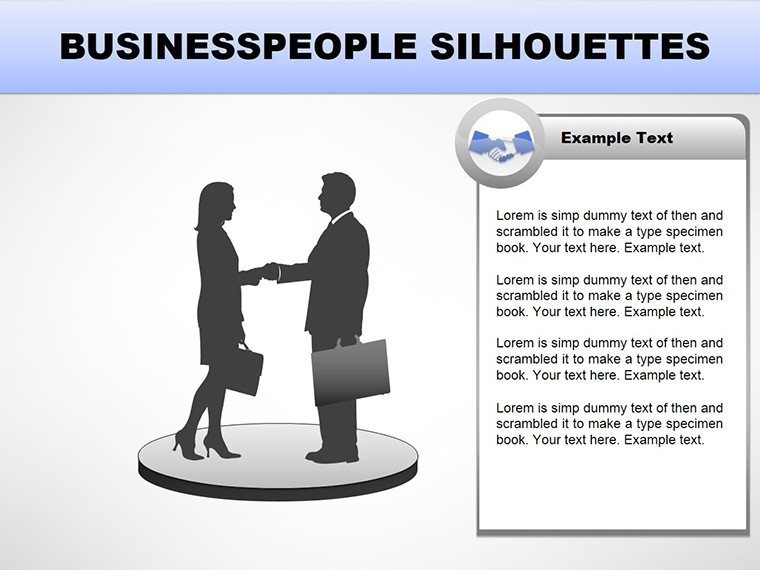
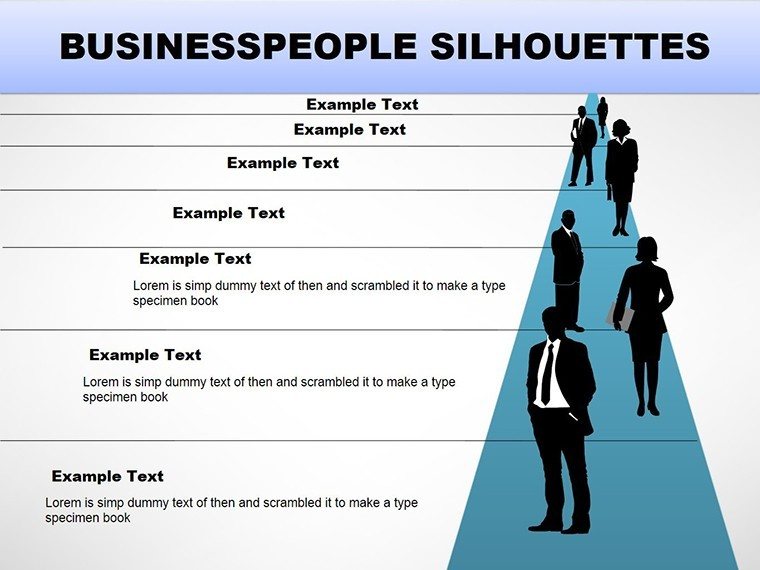
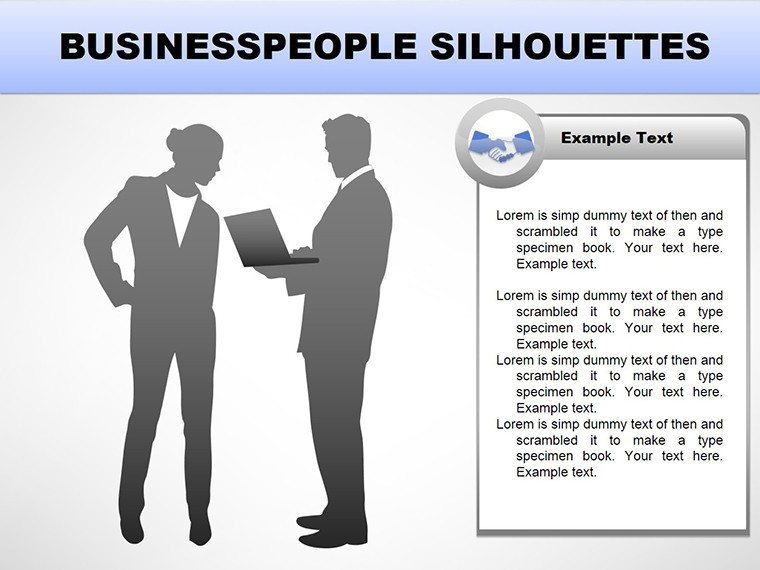
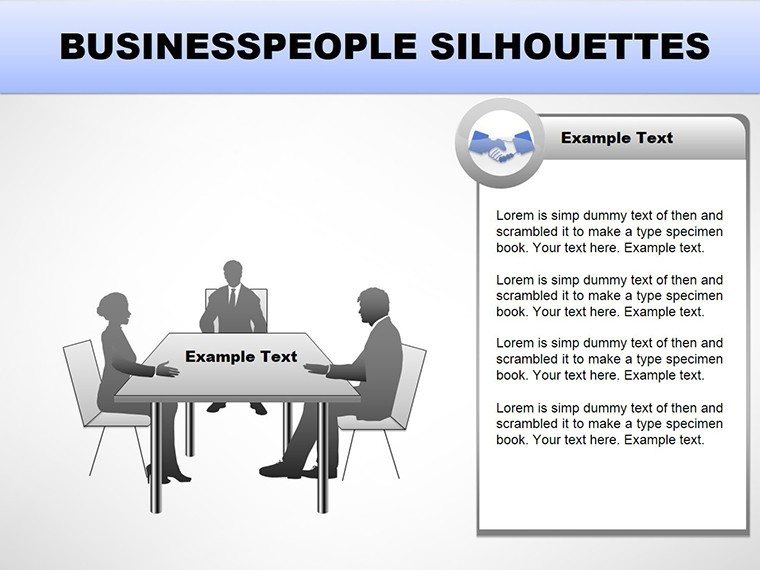
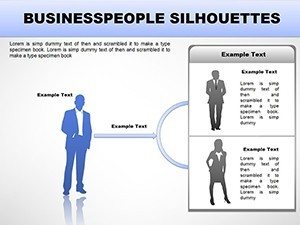
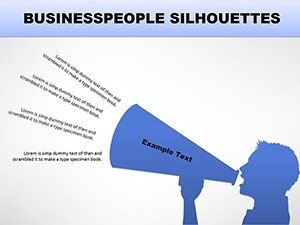
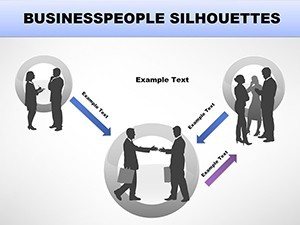
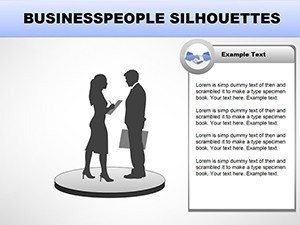
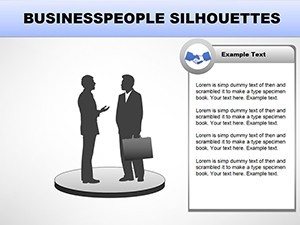
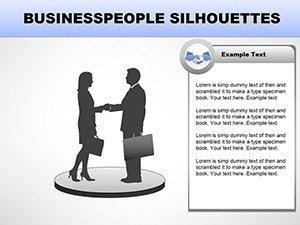
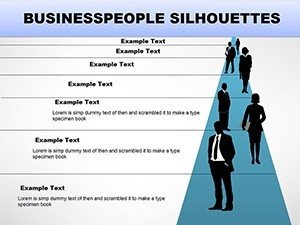
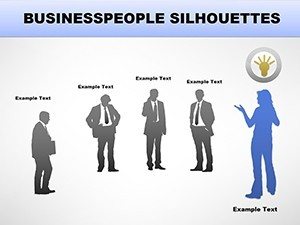
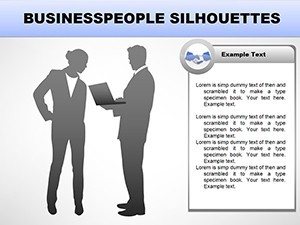
This Dynamic Business Silhouettes PPT Charts Template provides 25 fully editable slides featuring modern business silhouettes and chart layouts. Perfect for presenting organizational structures, workflow analysis, and team performance visually. Use these slides to create executive decks, internal strategy reviews, or investor updates without starting from scratch.
Template Features & Slide Breakdown
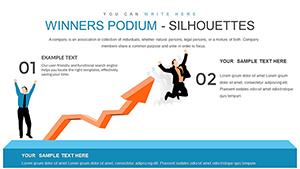
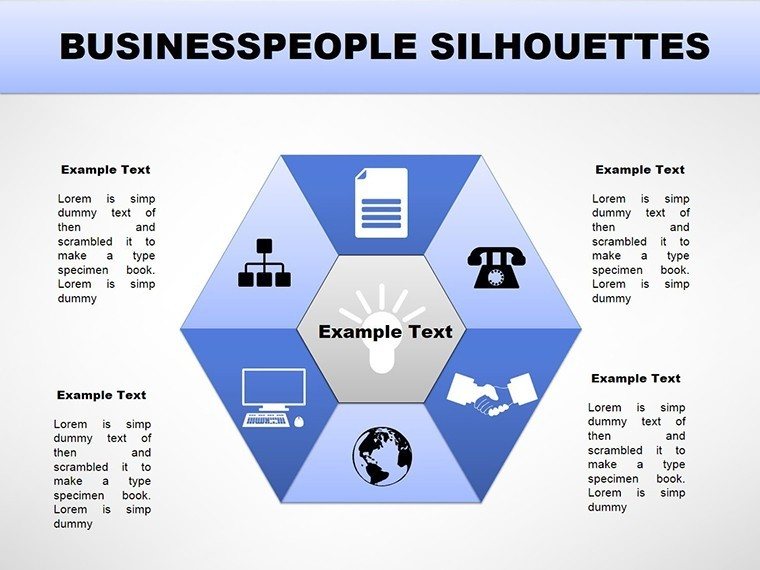
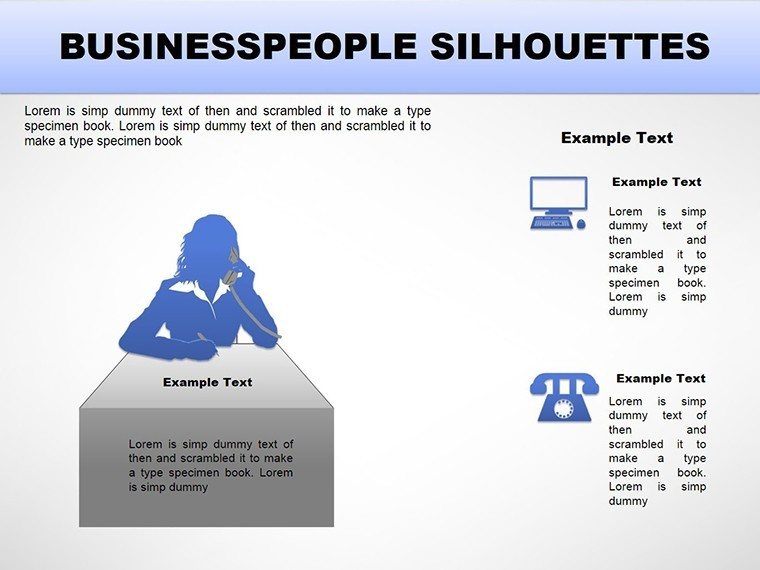
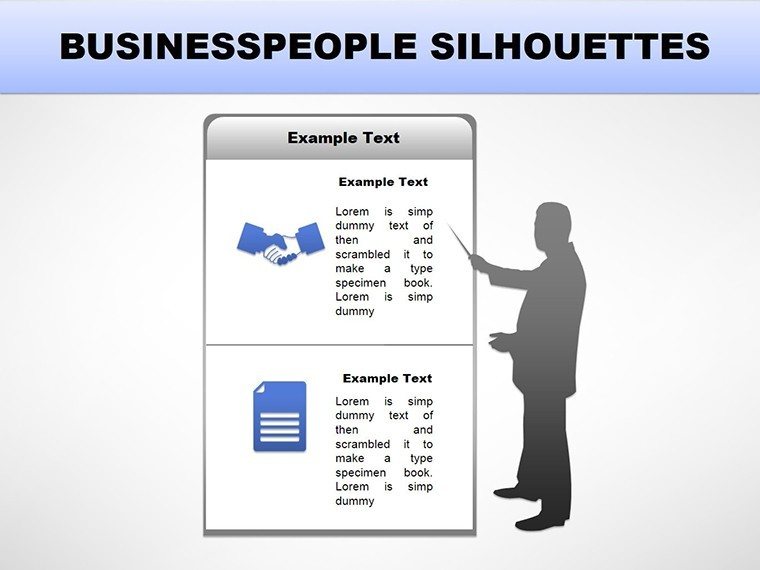
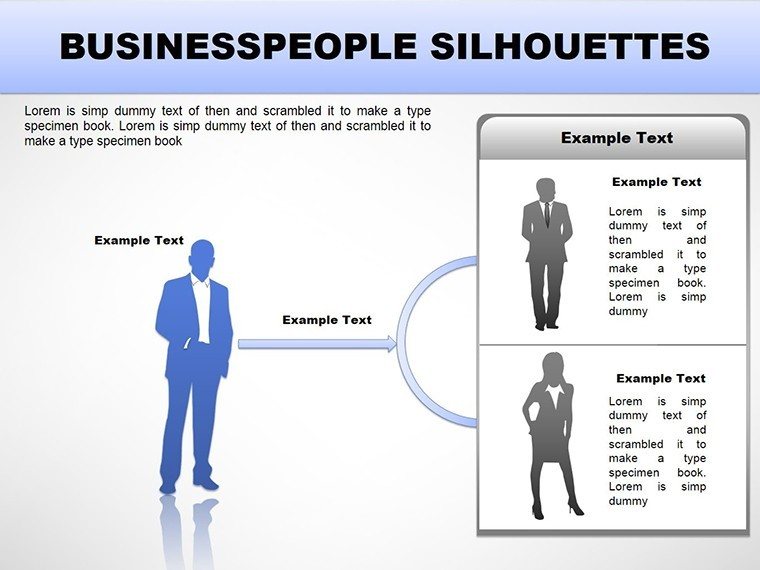
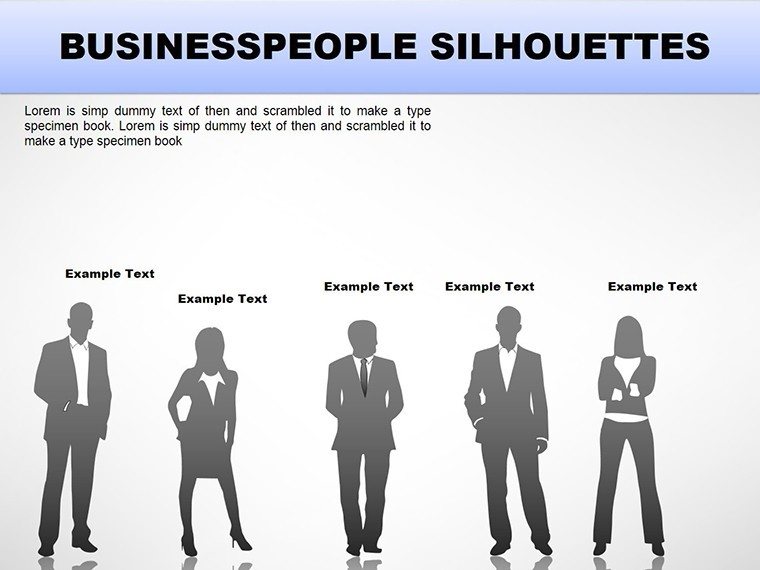
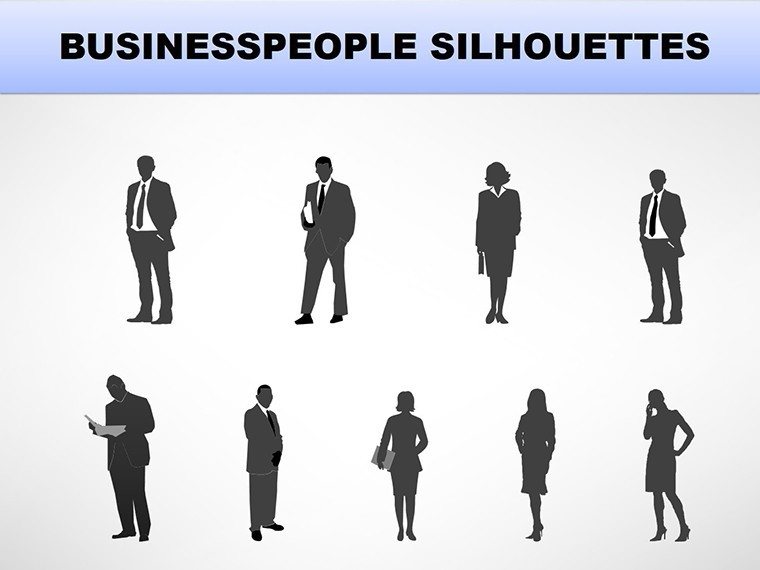
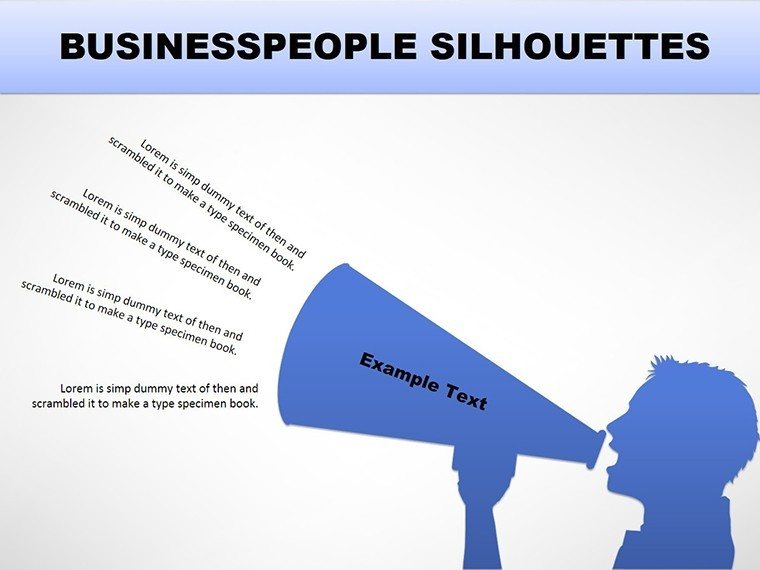
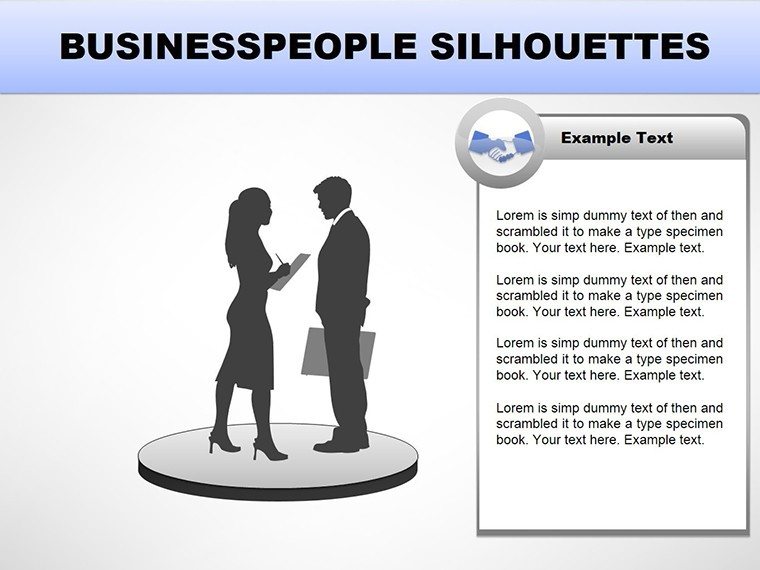
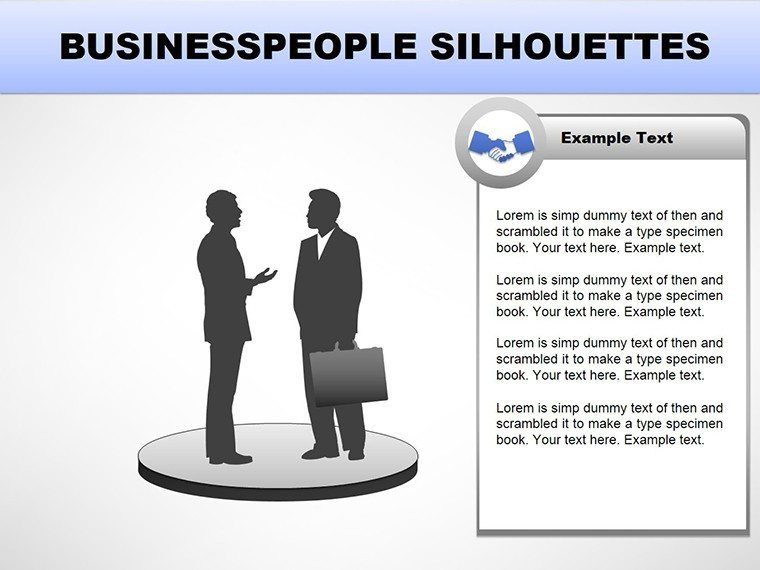
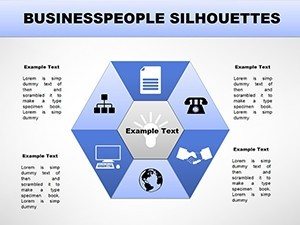
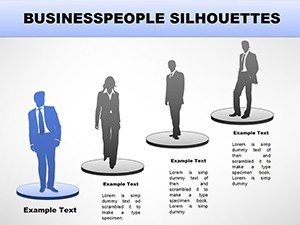
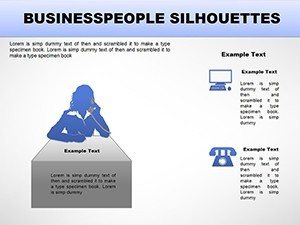
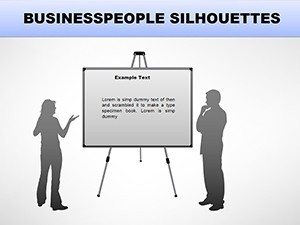
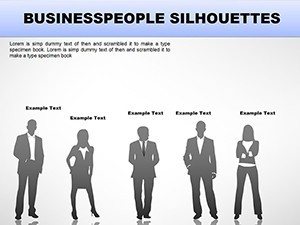
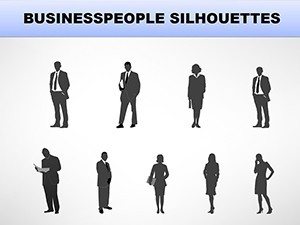
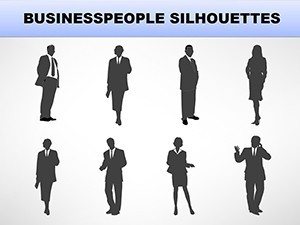
- Editable business silhouette graphics
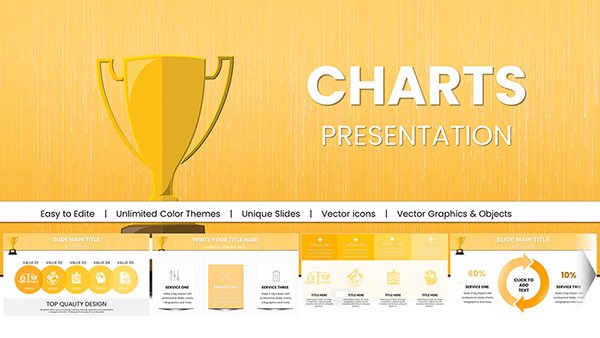
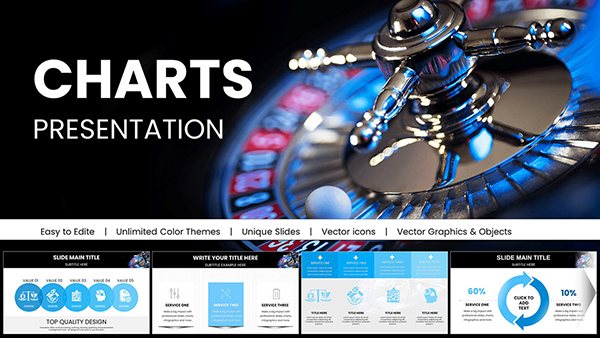
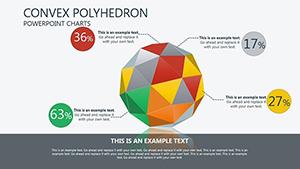
- Multiple chart types (bar, line, pie)
- Clean, professional layouts for executives and stakeholders
- PowerPoint-ready animations and transitions
Professional Use Cases
- Board meeting presentations
- Team performance reviews
- Investor pitch decks
- Annual business reports
Workflow Integration
Simply insert your data into pre-designed charts, replace placeholder text, and adjust silhouette illustrations to match your branding. Compatible with PowerPoint 2016+ and fully editable for seamless workflow integration.
Real-World Scenarios
Visualize team growth trends in quarterly meetings, showcase department performance during strategy reviews, or illustrate company-wide workflow in investor presentations. This template ensures clarity and professionalism in every slide.
Internal Comparison Table
| Slide Type | Audience | Outcome |
|---|---|---|
| Silhouette Infographics | Executives, managers | Clear visual communication of team structures |
| Charts & Graphs | Stakeholders, investors | Quick insight into performance metrics |
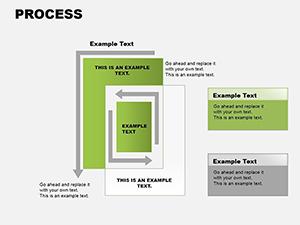
| Workflow Diagrams | Project teams | Enhanced understanding of processes |
Industry Applications
Applicable for corporate presentations, HR reports, consulting projects, and any professional setting requiring clear, visual communication of business data and organizational structures.
Frequently Asked Questions
When is this template most effective?
Ideal for internal reviews, board meetings, and investor presentations where visual clarity and professional design are essential.
Can I customize the silhouettes and charts?
Yes, all graphics, charts, and text are fully editable to match your brand and presentation needs.
Which PowerPoint versions are supported?
Compatible with PowerPoint 2016, 2019, 2021, and Microsoft 365 on Windows and Mac.