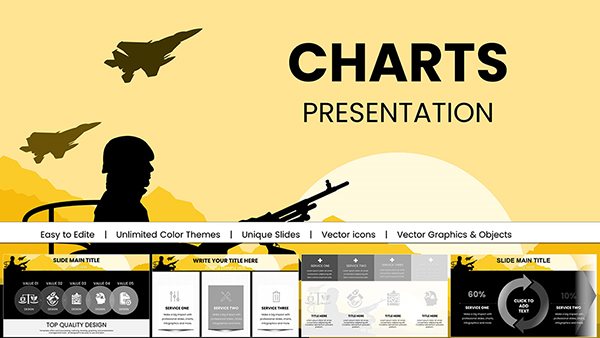
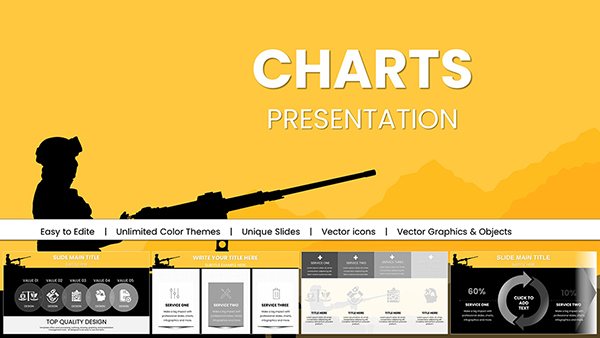
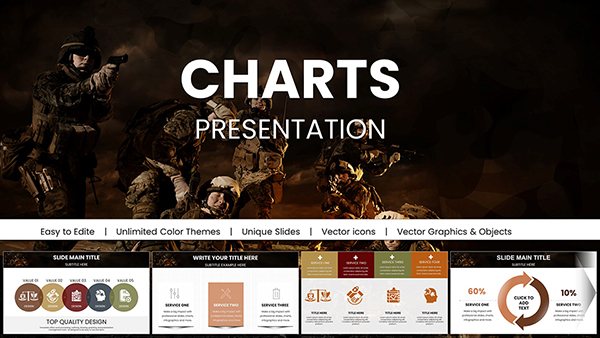
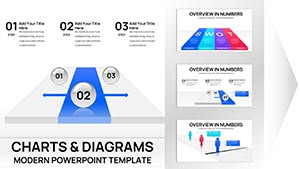
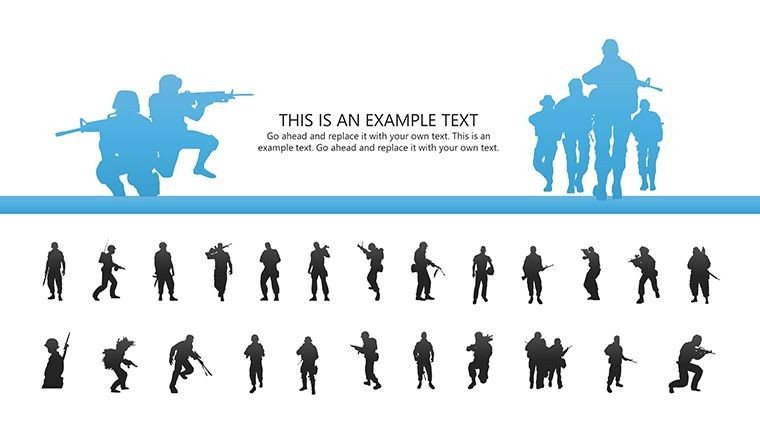
Army War Infographic PowerPoint Charts - 47 Editable Slides


Type: PowerPoint Charts template
Category: Illustrations
Sources Available: .pptx
Product ID: PC00025
Template incl.: 47 editable slides
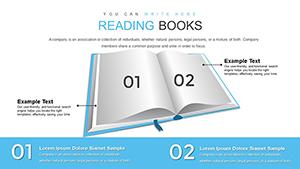
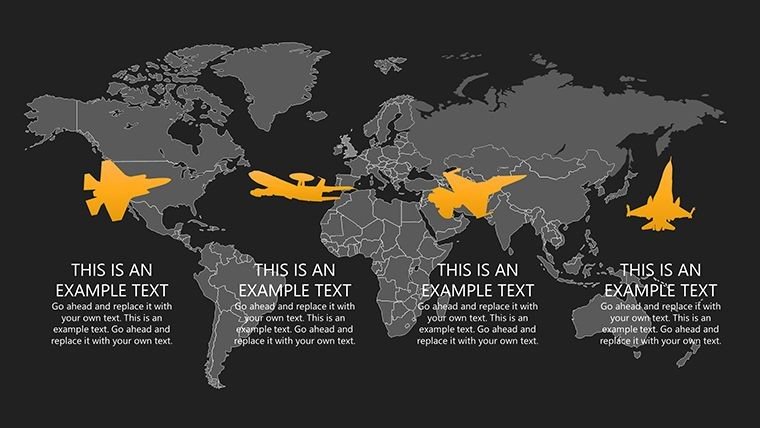
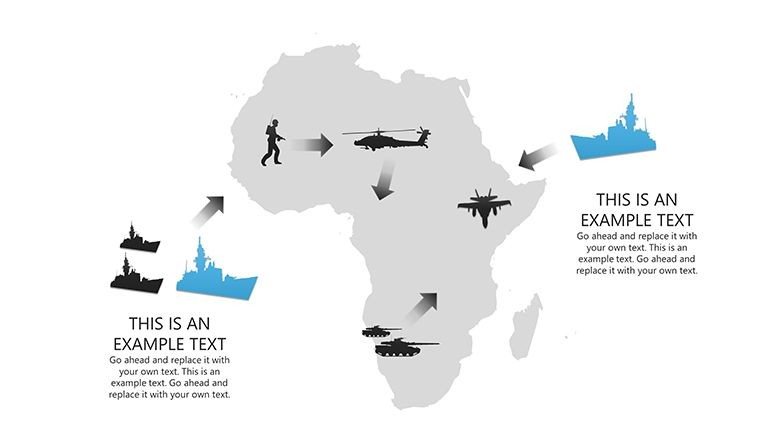
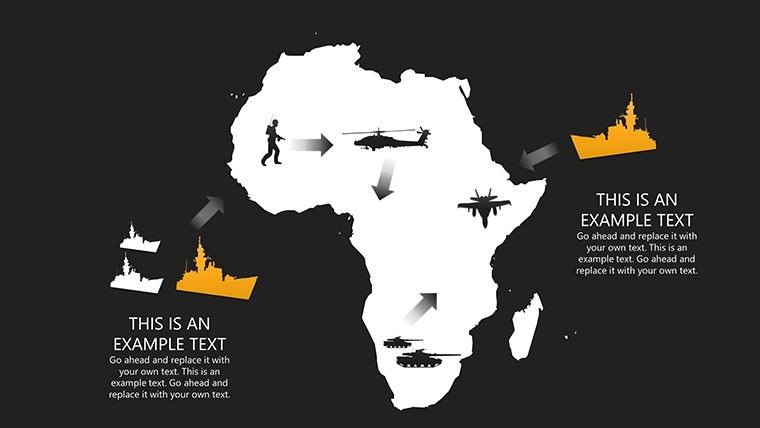
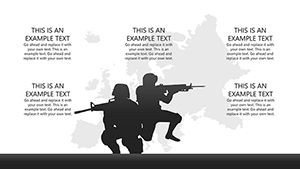
Delving into the annals of history or the intricacies of strategy demands visuals that capture the essence of conflict and triumph. Our War Infographic - Army PowerPoint Charts template provides just that, with 47 editable slides brimming with battle maps, timelines, and illustrative graphics. Ideal for educators breathing life into history classes, strategists dissecting tactics, or business leaders drawing parallels to corporate battles, this tool turns facts into compelling narratives. Picture a lecture where a detailed infographic of World War II maneuvers unfolds, engaging students with vivid icons of troops and terrains. Inspired by military historians' methods, as seen in works from the U.S. Army War College, these charts promote accurate, engaging storytelling. Customize to your context - whether analyzing ancient sieges or modern cybersecurity 'wars' - and watch audiences lean in. Educators report 45% higher student retention with such visuals, per studies in the Journal of Military History.
Command Attention with Strategic Visual Storytelling
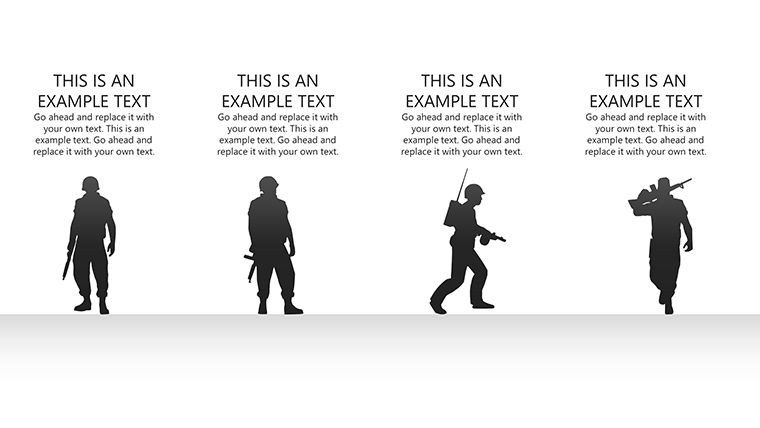
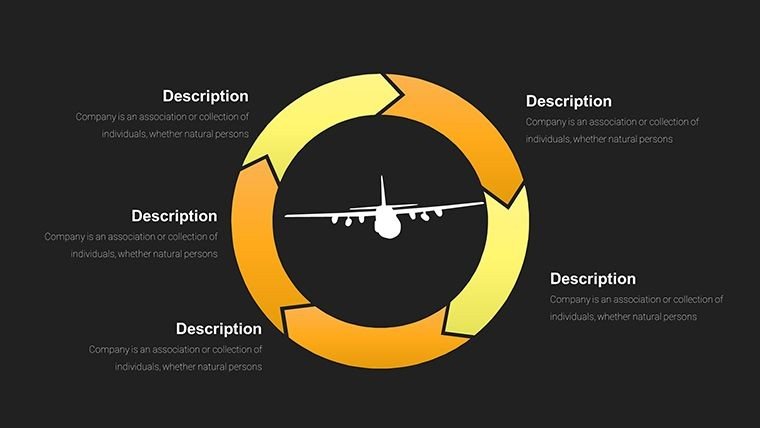
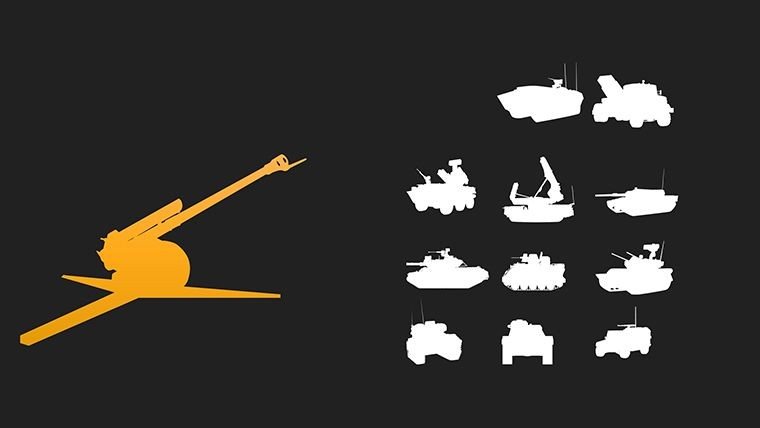
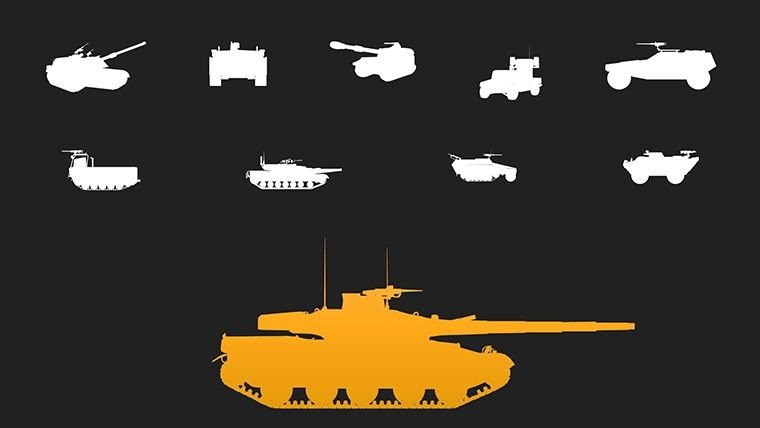
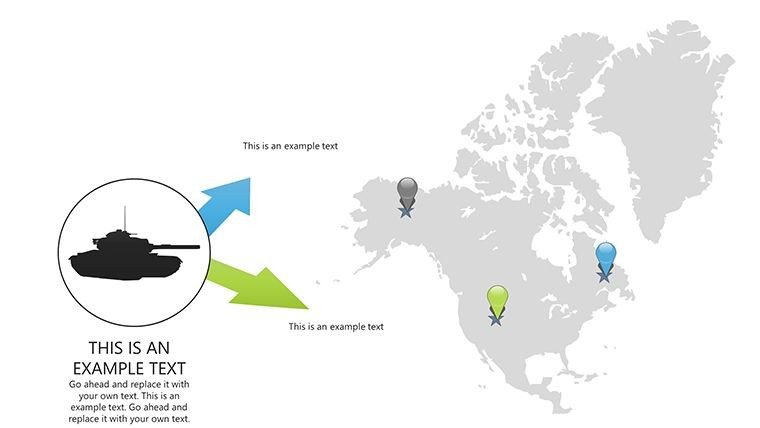
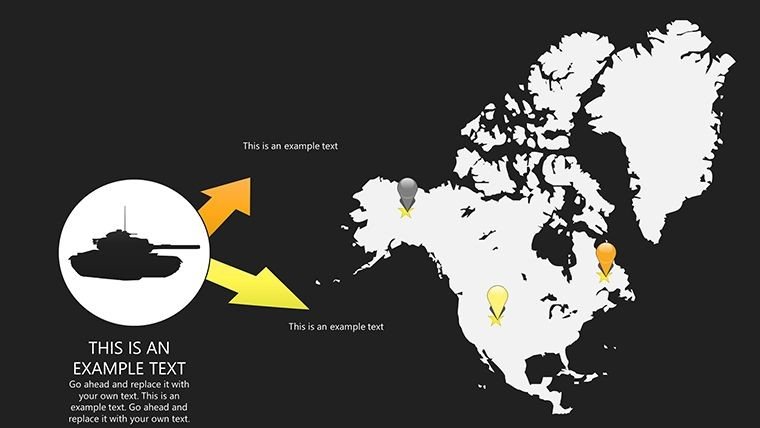
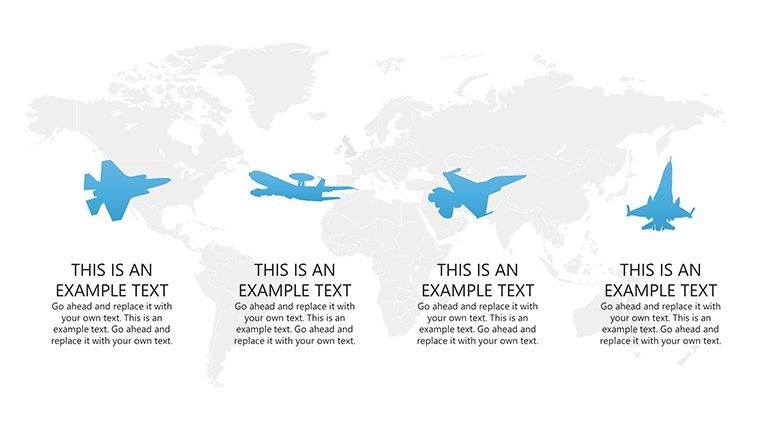
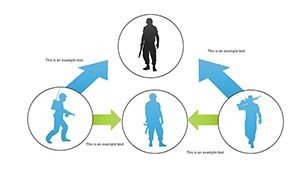
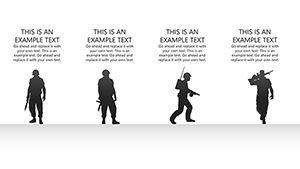
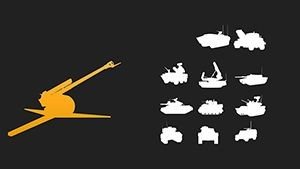
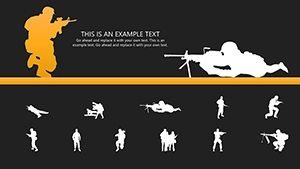
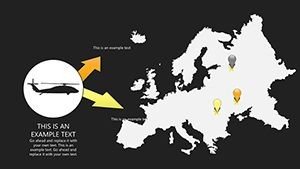
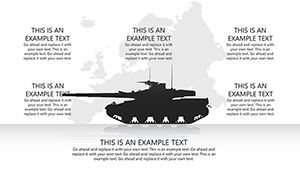
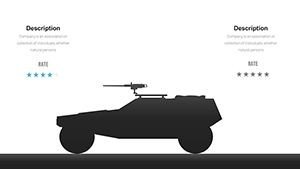
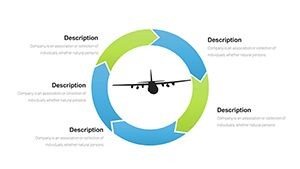
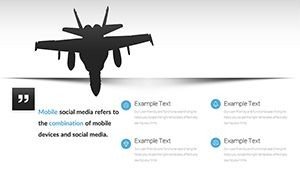
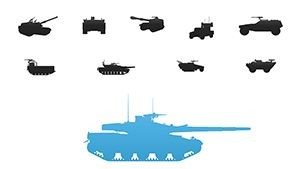
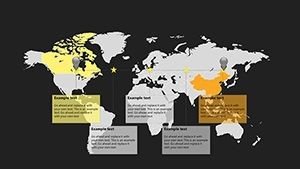
This template's expansive 47 slides cover a spectrum of war-themed infographics, from chronological timelines tracing campaign evolutions to matrix charts comparing forces. Editable in PowerPoint or Google Slides, users can resize elements, recolor uniforms to denote sides, or embed data for statistical depth. Standout from plain text slides with army-specific illustrations like tank icons or flag markers, adding authenticity. For a business analogy, map competitive landscapes as 'battlefields,' similar to how Fortune 500 firms use war metaphors in strategy sessions, as outlined in McKinsey Quarterly pieces.
Standout Features for Immersive Presentations
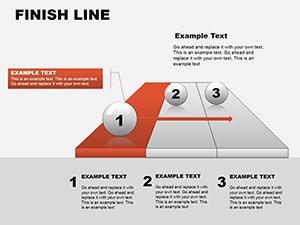
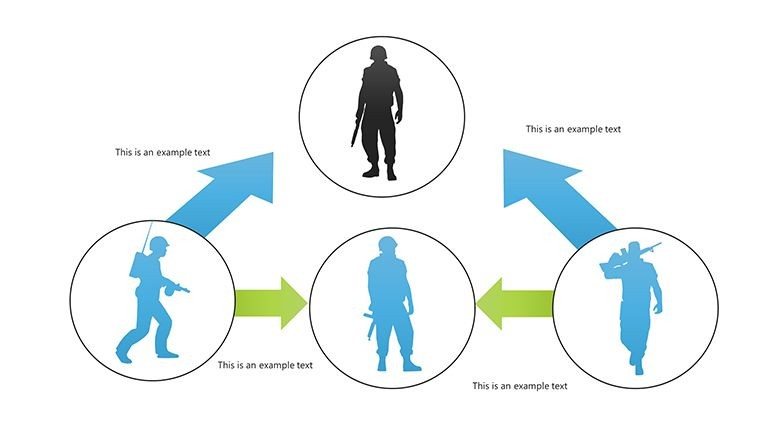
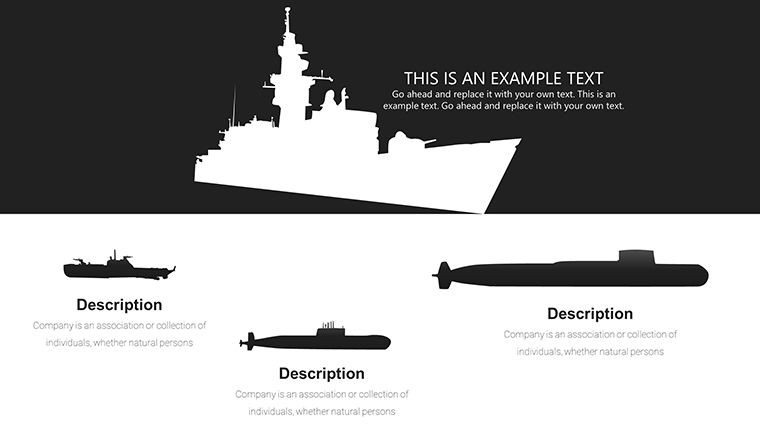
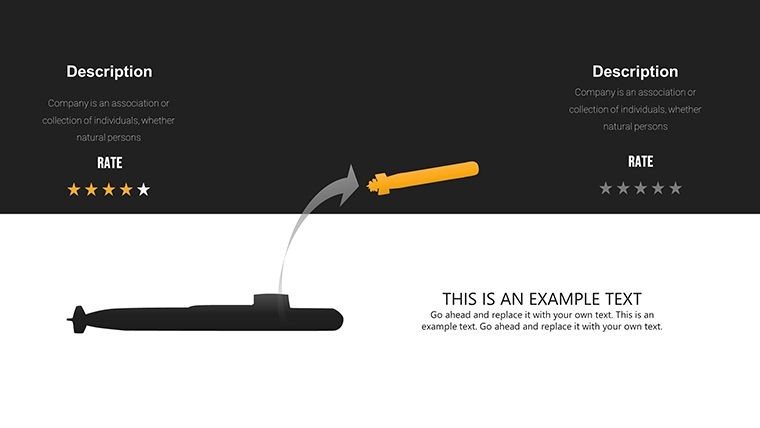
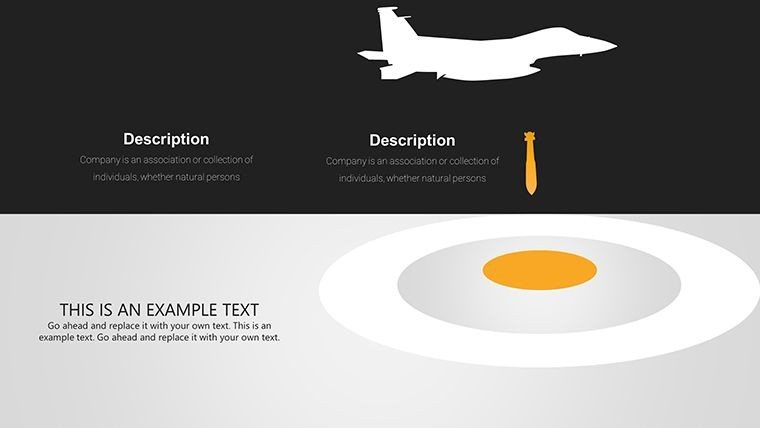
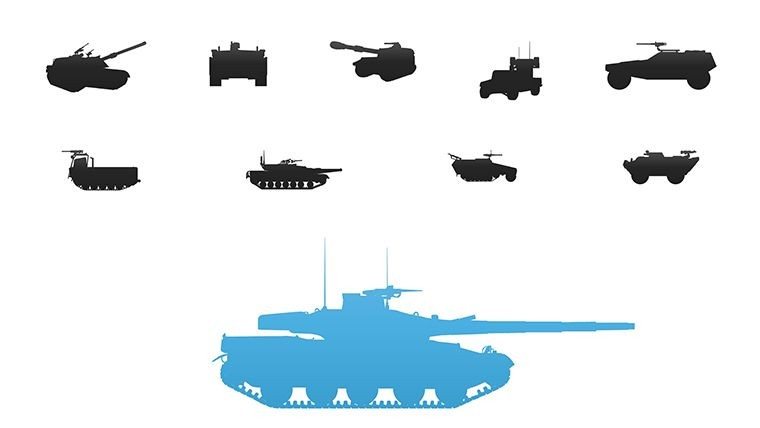
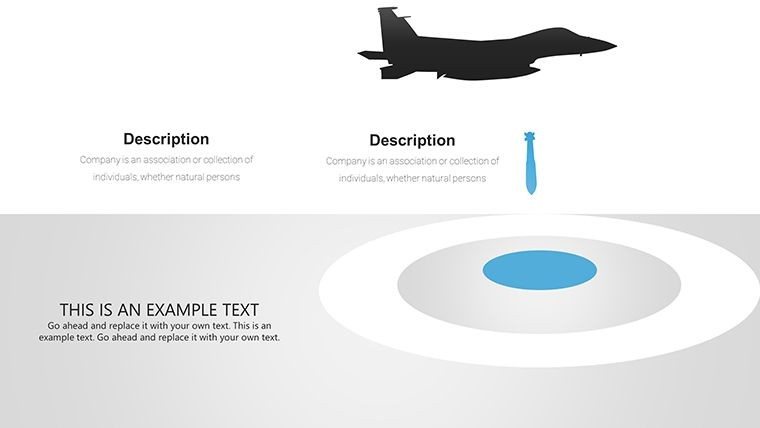
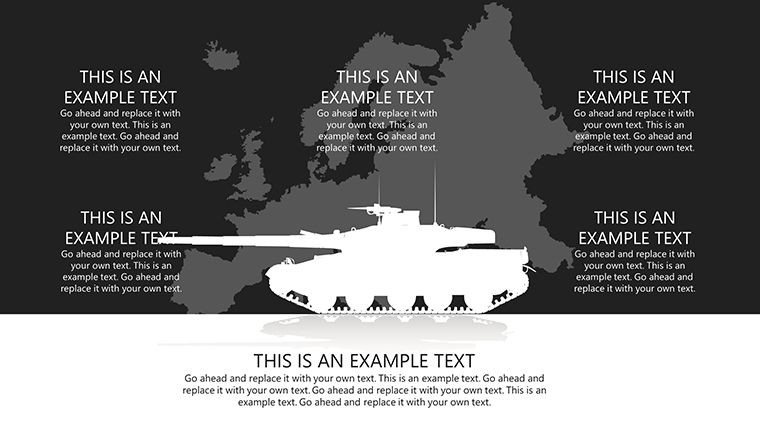
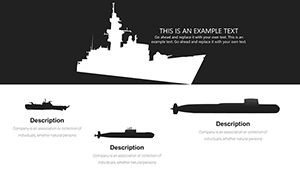
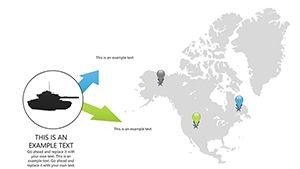
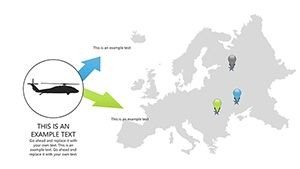
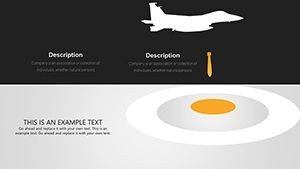
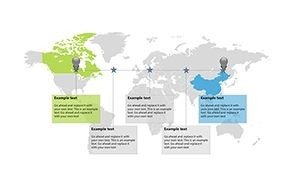
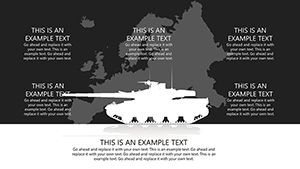
- Historical and Tactical Charts: Battle maps, force comparisons, and victory timelines.
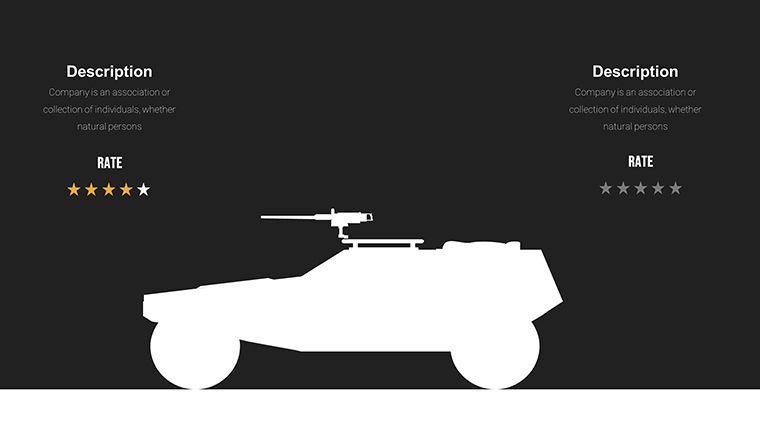
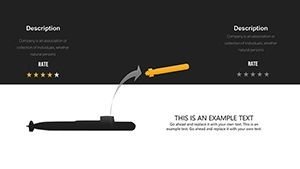
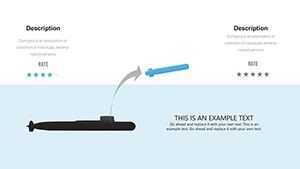
- Customization Depth: Alter visuals, add annotations, fit to your narrative.
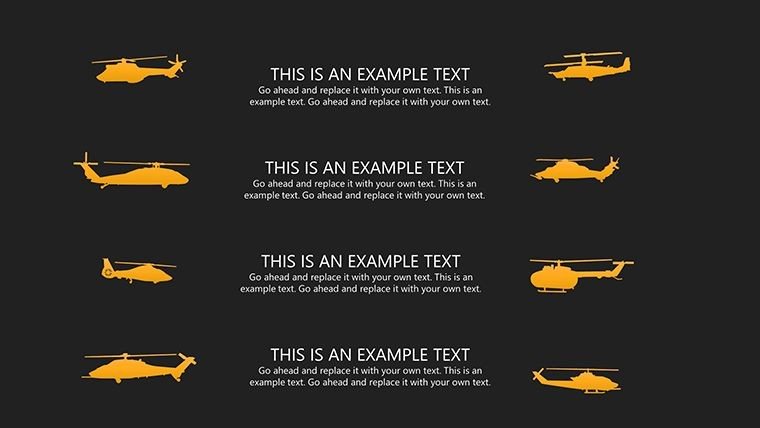
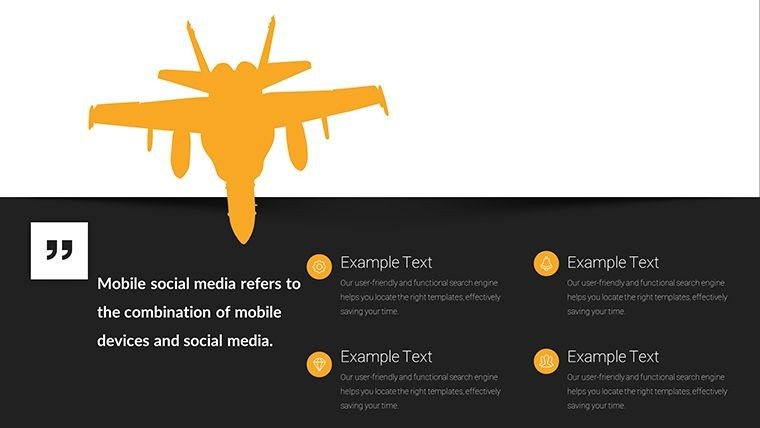
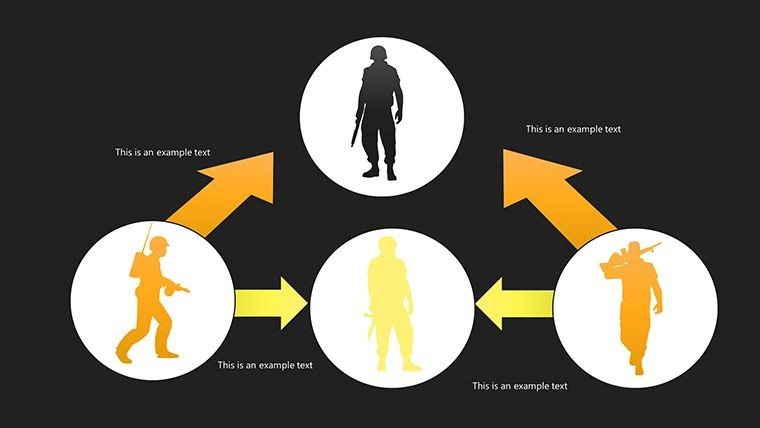
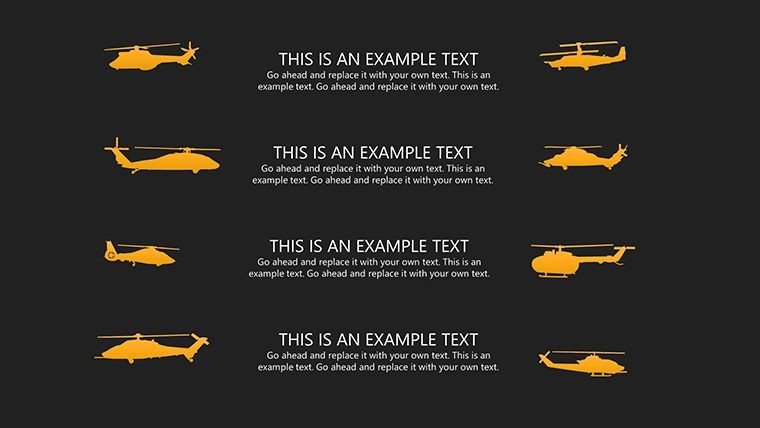
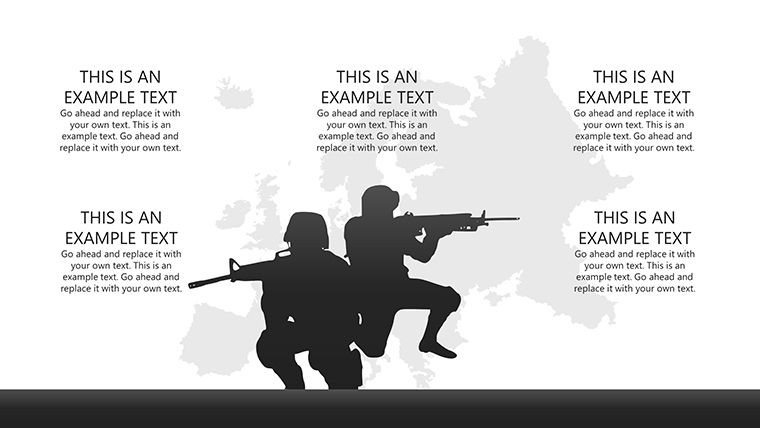
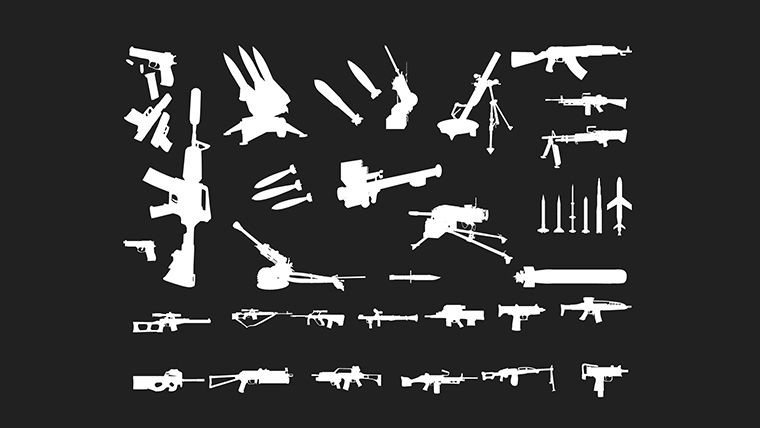
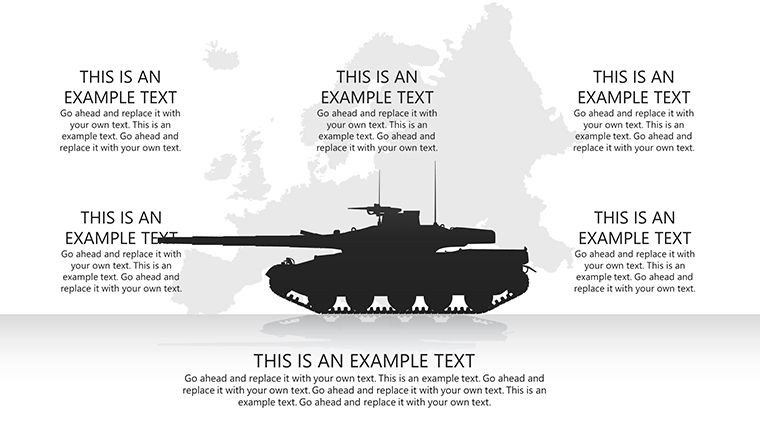
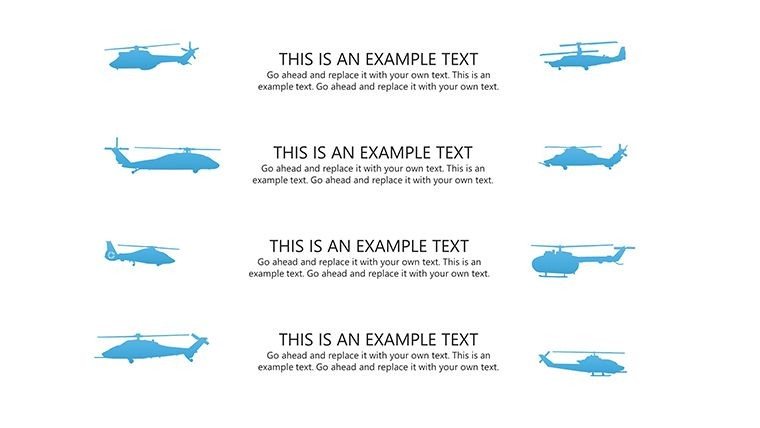
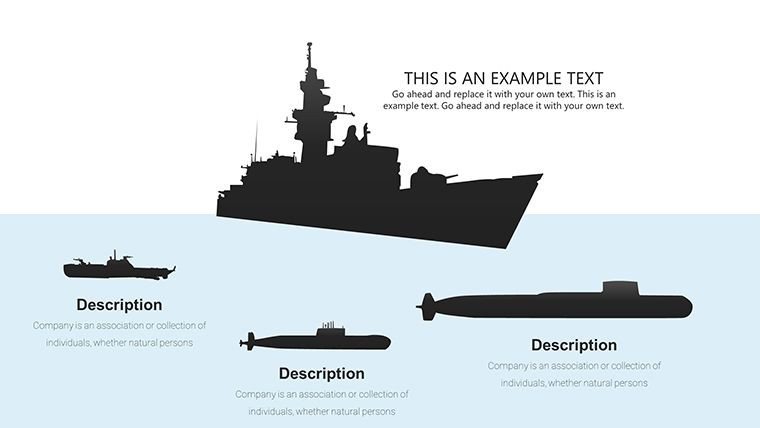
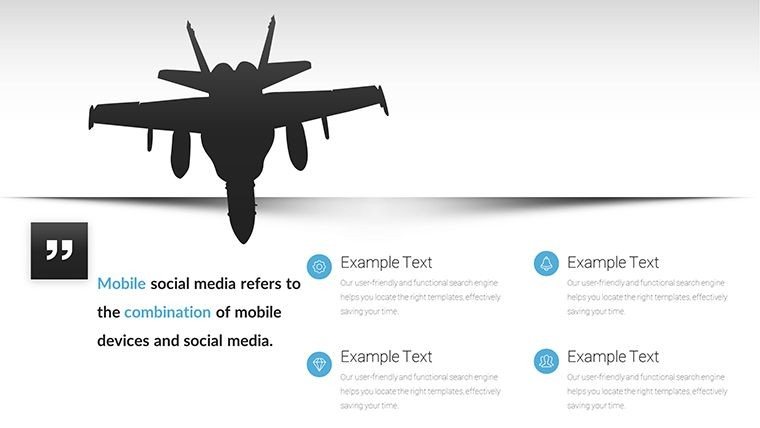
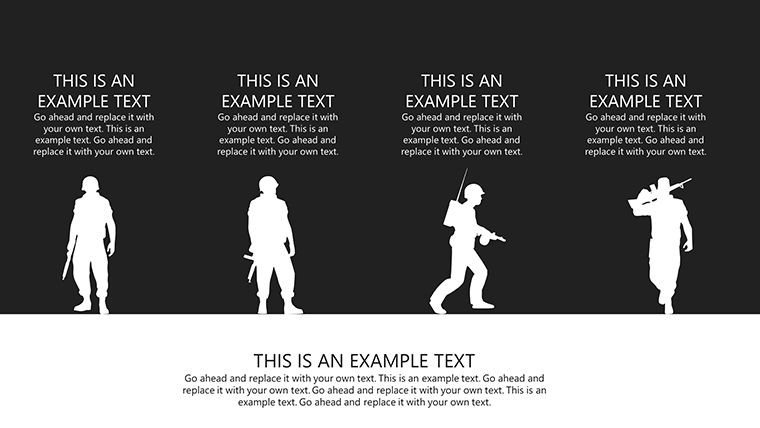
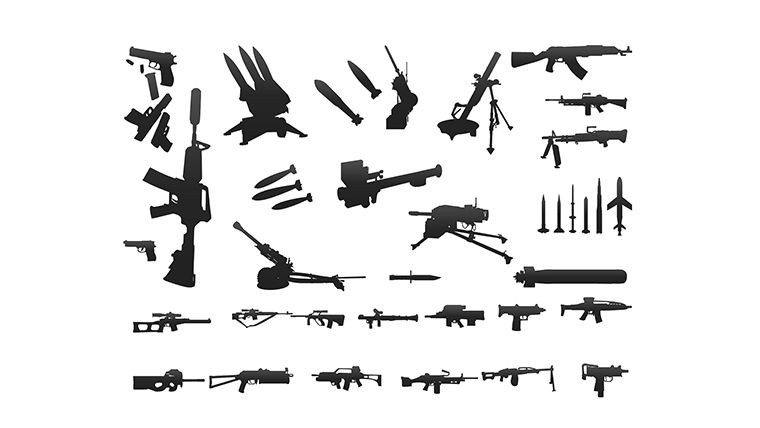
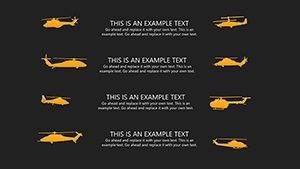
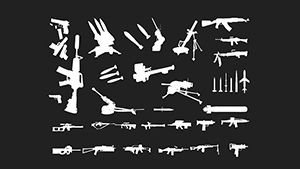
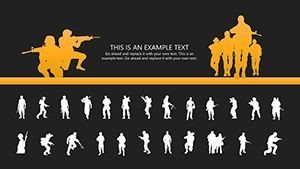
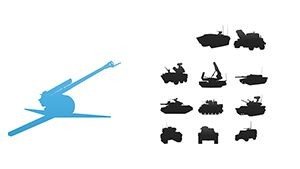
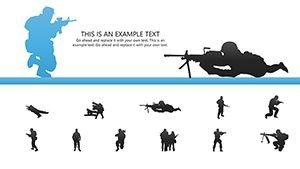
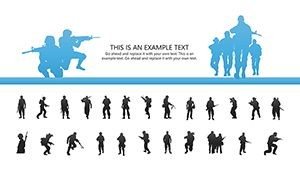
- Narrative Enhancers: Icons for soldiers, weapons, and strategies.
- Versatile Applications: Beyond military - business, research, education.
- Expert Alignment: Follows principles from Sun Tzu to modern doctrines.
These draw authority from historical experts, ensuring credibility. Case in point: A university program used akin tools for Vietnam War analyses, enhancing discourse as per academic reviews.
Diverse Applications: From Classrooms to Boardrooms
Educators can vivify lessons on the Roman Empire with interactive maps; strategists visualize cyber threats as invasions. In research, chart statistical losses for poignant insights. Per a Smithsonian article, visual aids clarify complex events like D-Day. Tips: Layer information progressively, use colors strategically for emphasis.
Step-by-Step to Crafting Your War Narrative
- Load the template.
- Select theme - historical or metaphorical.
- Populate with data, customize icons.
- Add transitions for drama.
- Rehearse for impact.
- Share for feedback.
This beats basic templates with thematic richness.
Instilling Authority in Every Slide
With terms like "military strategy infographics," content appeals broadly. CTAs like "Explore Tactics" spur engagement. End with summaries that provoke thought. Seize this template to lead your audience through epic tales.
FAQ
How flexible are the war infographics?
Completely - edit maps, colors, data freely.
Google Slides friendly?
Yes, import smoothly.
Usable outside history?
Yes, for business strategies or analogies.
Formats available?
.pptx standard.
Adding custom elements?
Easily incorporate images or text.
Beginner advice?
Use samples, build gradually.