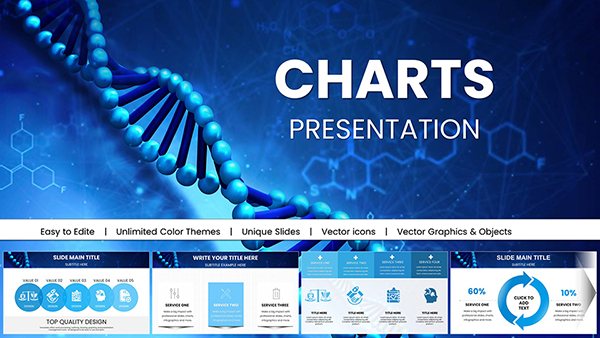
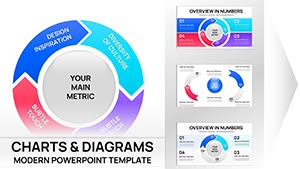
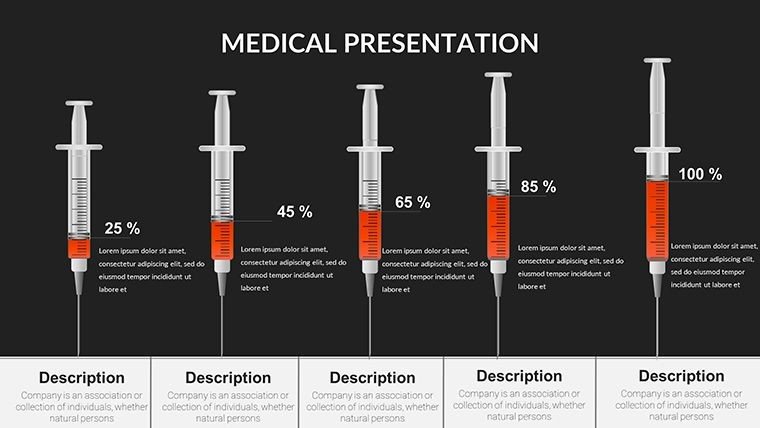
Medical Infographic PowerPoint Charts Template - 37 Editable Slides


Type: PowerPoint Charts template
Category: Medicine - Pharma, Illustrations
Sources Available: .pptx
Product ID: PC00024
Template incl.: 37 editable slides
In the intricate realm of healthcare, where precision meets compassion, conveying medical information effectively can bridge gaps between knowledge and action. Our Infographic Medicine PowerPoint Charts template rises to this challenge, providing 37 editable slides that turn dense statistics, research findings, and clinical data into vibrant, understandable visuals. Tailored for doctors, researchers, educators, and healthcare administrators, this tool helps you craft presentations that not only inform but also inspire confidence in your audience. Envision a conference where your slide on disease progression uses flowing timelines and icon-enhanced graphs to illustrate patient outcomes, drawing nods of understanding from peers. Grounded in medical communication best practices from organizations like the American Medical Association (AMA), these charts emphasize clarity to reduce misinterpretation risks. With customizable elements, you adapt to specific fields - be it oncology trends or public health metrics - ensuring your message lands with impact. Healthcare professionals using visual aids like these see engagement soar, with studies from the Journal of Medical Internet Research showing improved retention by 50% in educational settings.
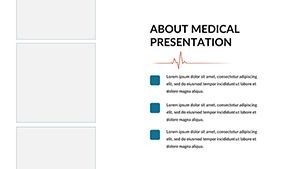
Elevate Healthcare Communication with Dynamic Visuals
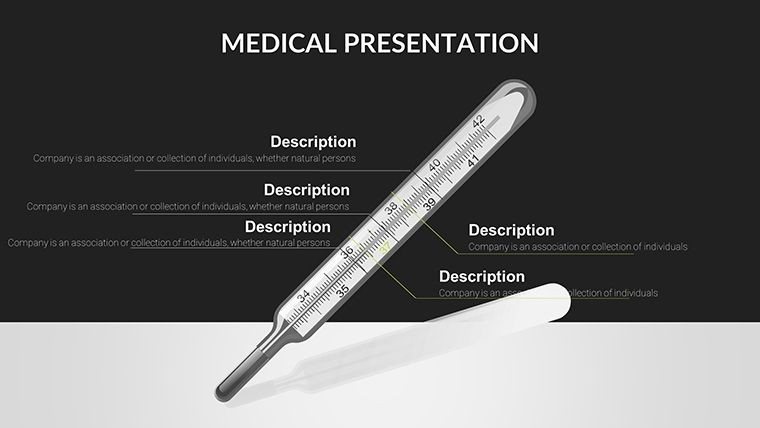
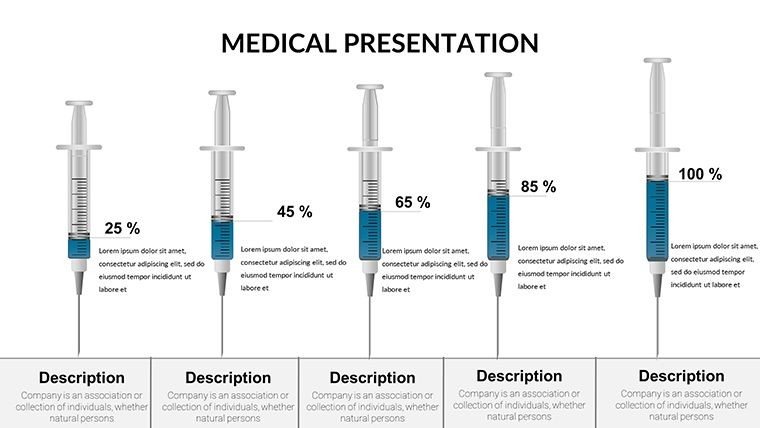
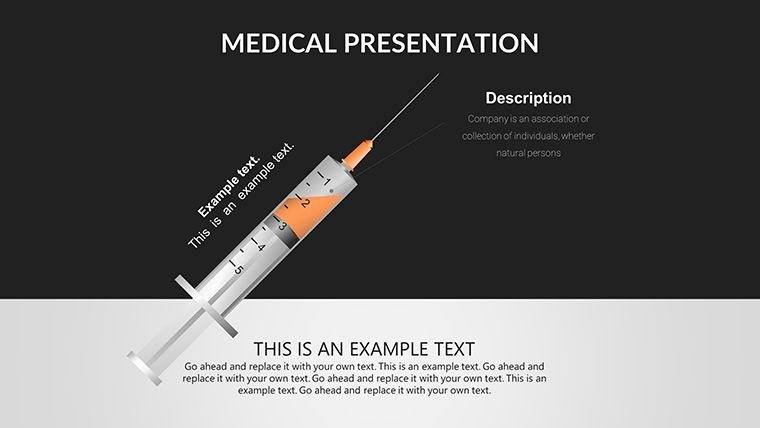
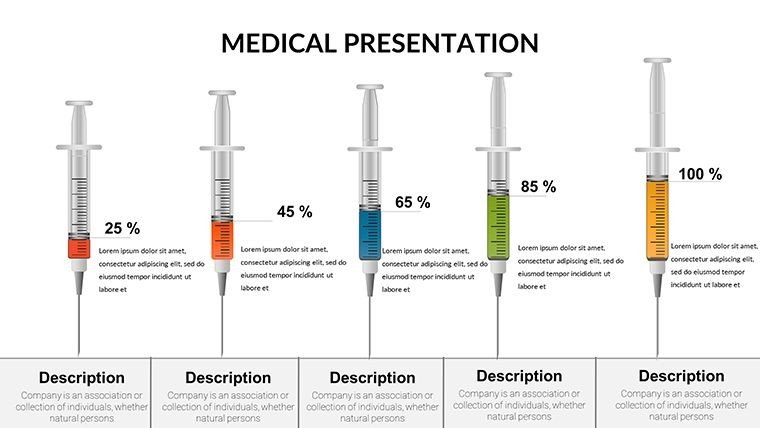
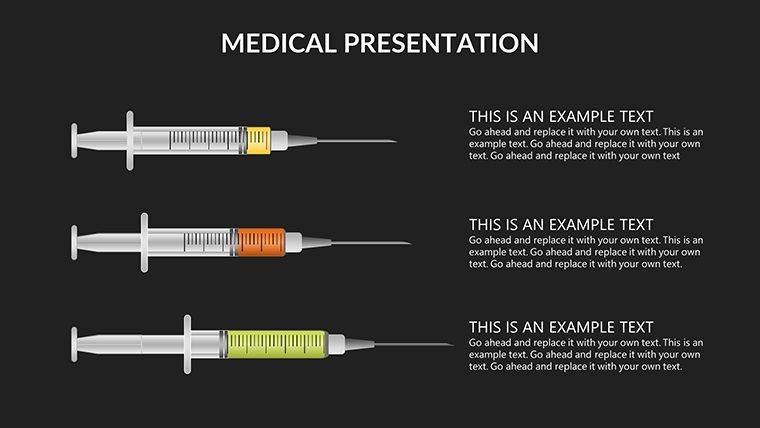
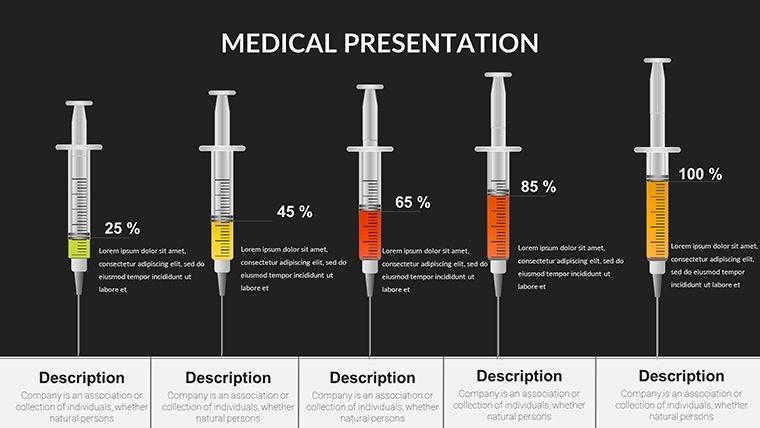
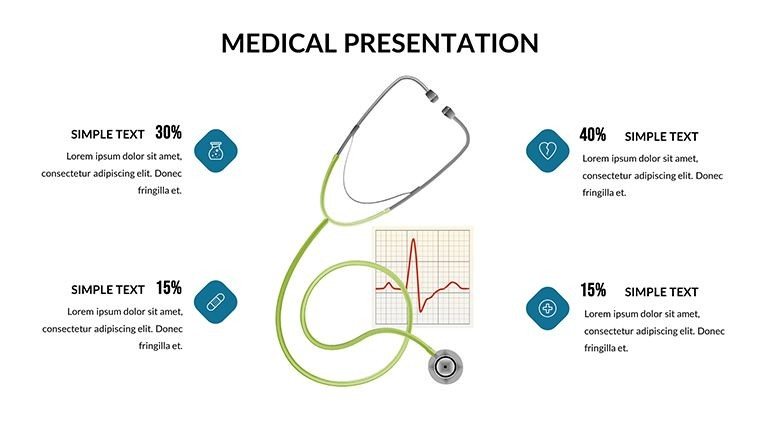
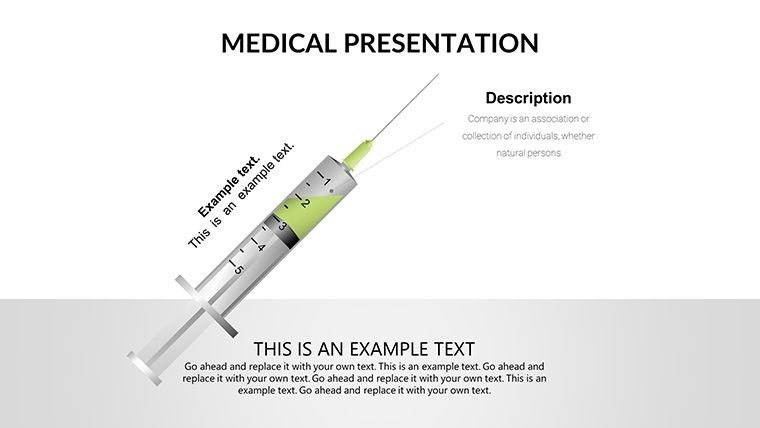
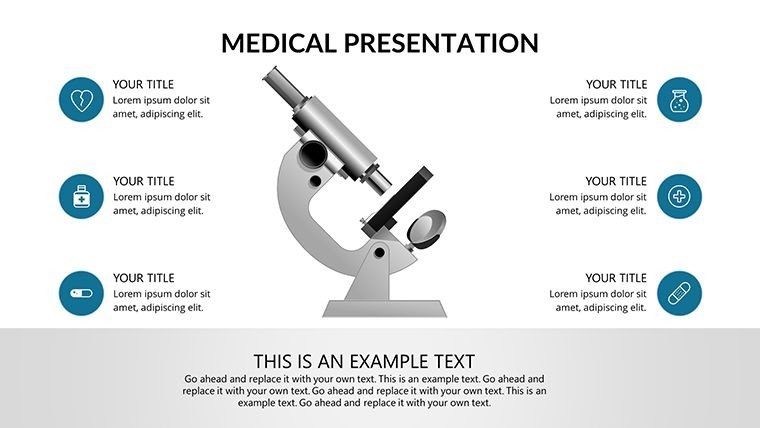
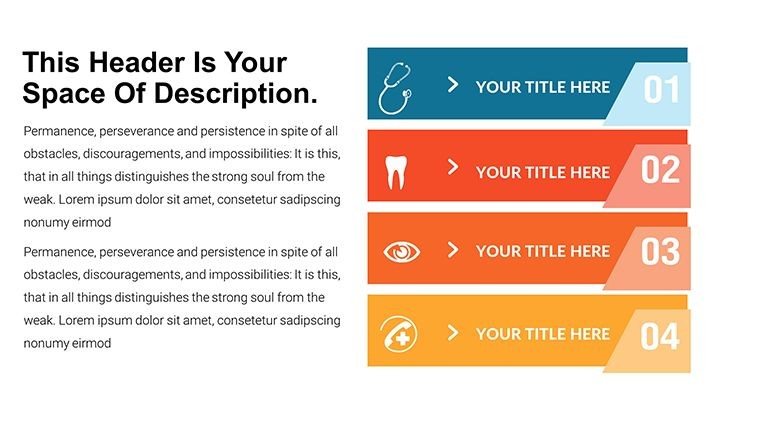
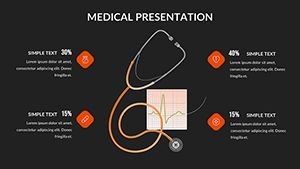
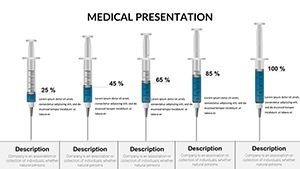
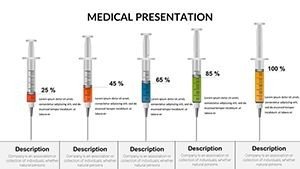
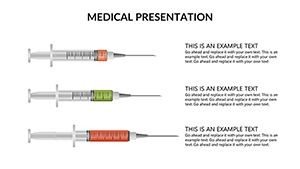
This template's strength lies in its ability to demystify complex medical concepts through infographics that integrate data with narrative. Spanning 37 slides, it includes specialized charts like anatomical diagrams, statistical bar graphs for trial results, and pie charts for demographic breakdowns. Fully compatible with PowerPoint and Google Slides, editing is straightforward - swap in your datasets, alter color palettes to denote severity (e.g., blue for calm stats, red for alerts), and add annotations for context. Unlike rudimentary slides, these feature pharma-themed illustrations, such as pill icons or heartbeat lines, enhancing relevance. For instance, in a cardiology update, utilize line graphs to track blood pressure trends over time, akin to visualizations in New England Journal of Medicine articles that clarified treatment efficacies for broader audiences.
Core Features for Medical Professionals
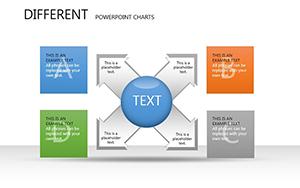
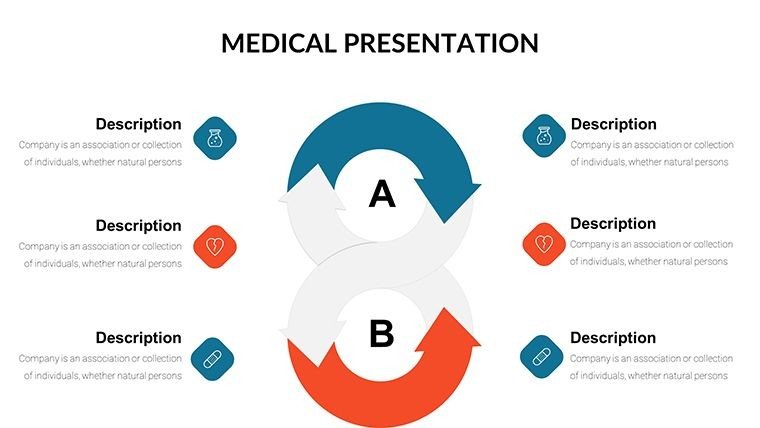
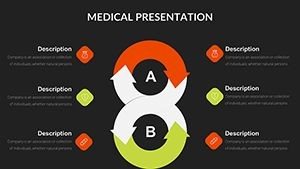
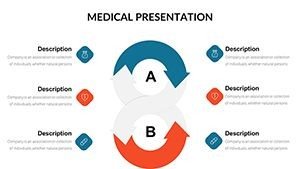
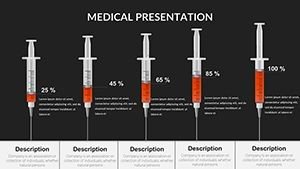
- Specialized Medical Charts: From flowcharts depicting treatment pathways to scatter plots for correlation studies.
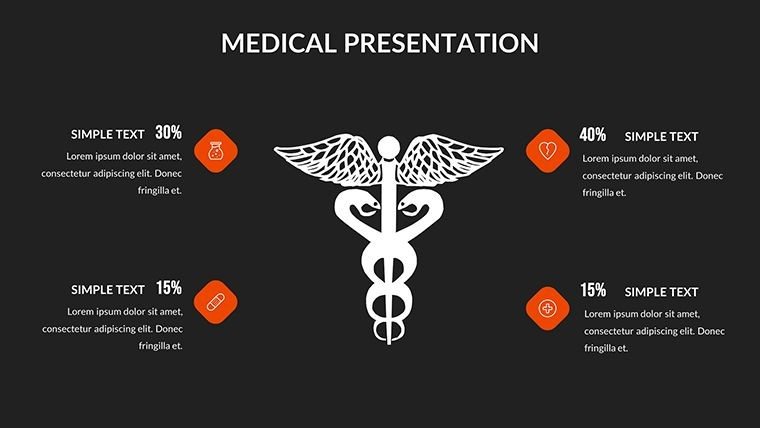
- Customizable Aesthetics: Modify schemes and styles to align with institutional branding or topic sensitivity.
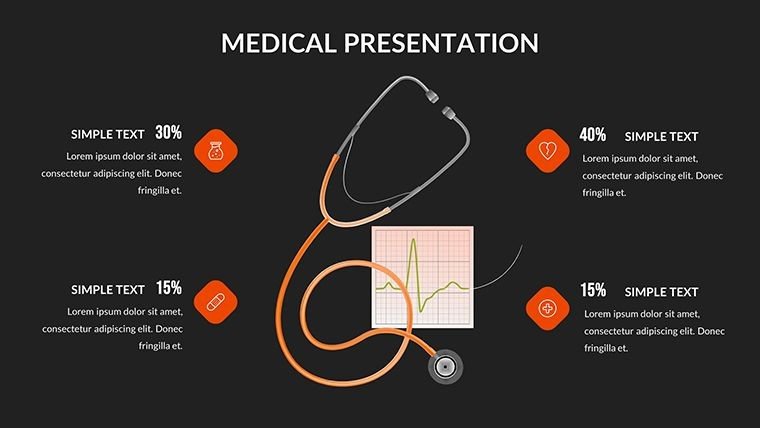
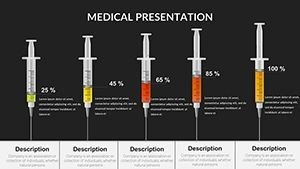
- Data-Driven Flexibility: Input clinical metrics seamlessly, with auto-adjusting visuals for accuracy.
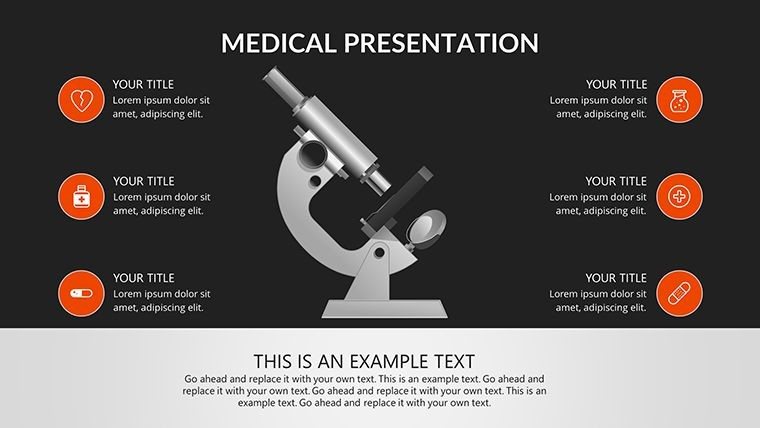
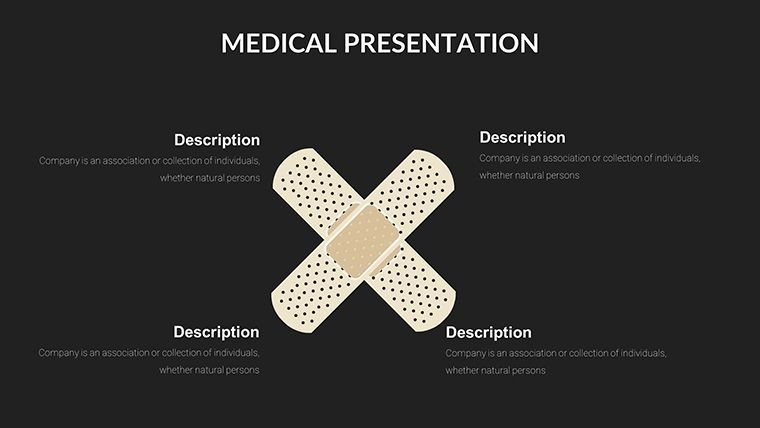
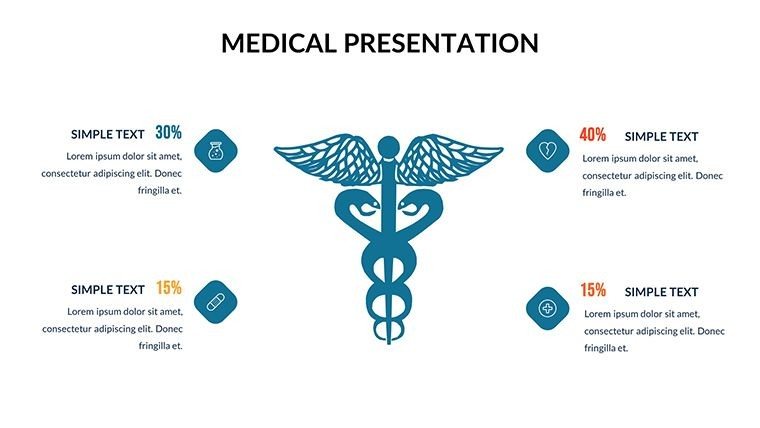
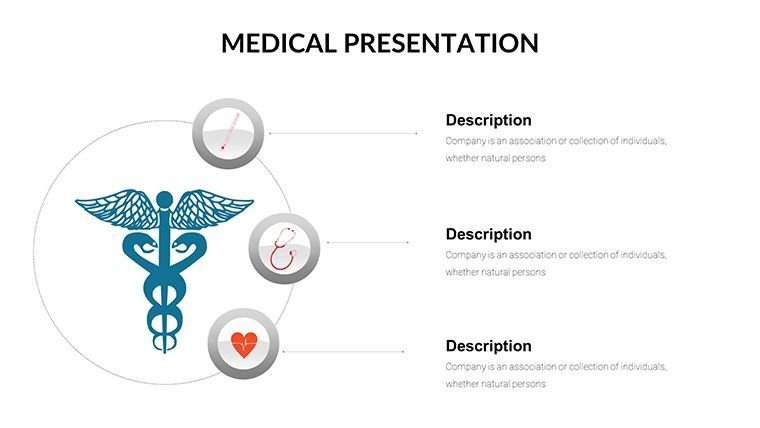
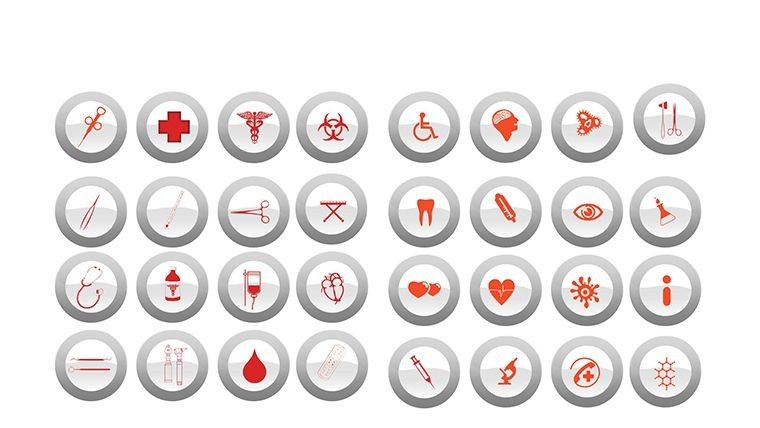
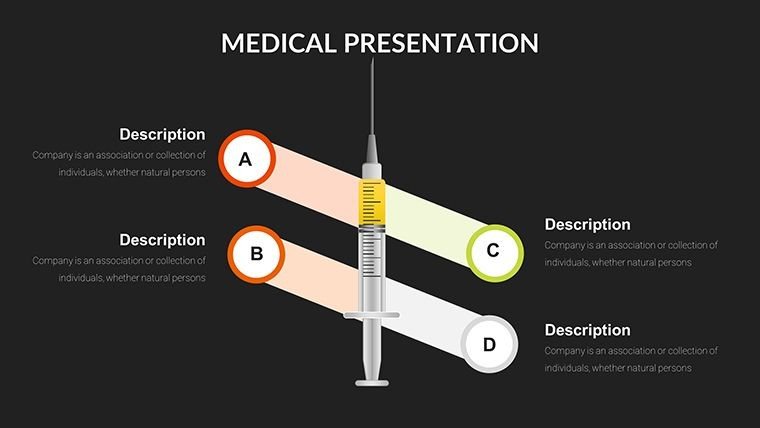
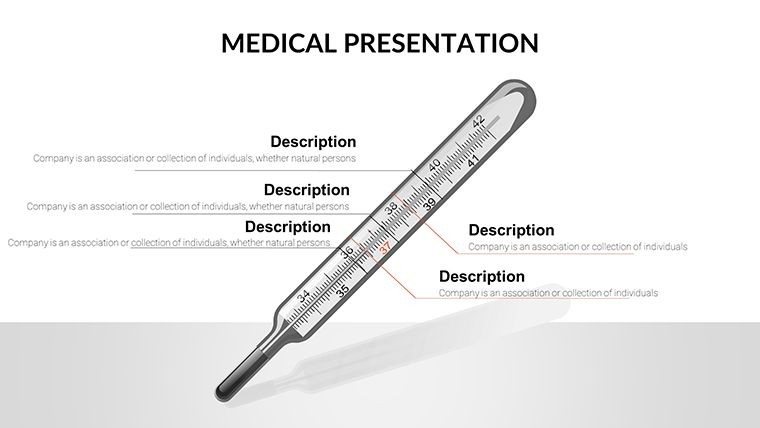
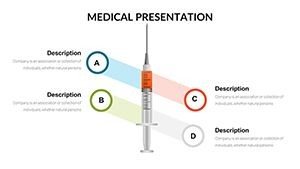
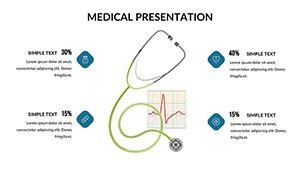
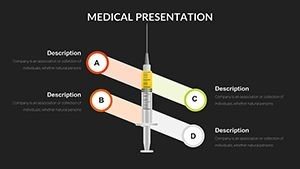
- Illustrative Elements: Built-in icons for organs, procedures, and health symbols to enrich storytelling.
- Compliance-Ready Design: Adheres to HIPAA-inspired privacy cues and AMA guidelines for ethical presentation.
These elements reflect expertise from medical illustrators, ensuring trustworthiness. A real-world example: In a Mayo Clinic-inspired case, similar infographics streamlined patient education on diabetes management, boosting adherence rates as per their published outcomes.
Applications Across Medical and Educational Landscapes
From bustling hospitals to quiet classrooms, this template adapts to diverse needs. Researchers can present trial data with bar charts highlighting efficacy rates, facilitating peer reviews. Educators might use illustrated slides to teach anatomy, making abstract concepts tangible for students. In patient sessions, simplify explanations of conditions with visual aids, improving comprehension and empowerment. Drawing from a Lancet study on visual health communication, such tools reduced misunderstanding by 35% in multicultural settings. Workflow tips: Begin with your key takeaway, select complementary charts, and incorporate subtle transitions for flow. Address pain points like jargon overload by pairing data with relatable icons, fostering inclusivity.
Guided Process for Creating Impactful Medical Slides
- Open the template in your preferred software.
- Outline your content - focus on one idea per slide.
- Choose charts: E.g., use timelines for disease progression.
- Personalize: Add data, tweak visuals, ensure accessibility.
- Practice delivery to gauge audience reaction.
- Refine based on feedback for ongoing improvements.
This structured approach outperforms ad-hoc designs, offering a professional edge in time-sensitive environments.
Fostering Trust in Medical Narratives
Authoritativeness shines through in every slide, with designs that prioritize evidence-based visuals. Weave in terms like "clinical data infographics" naturally for better discoverability. CTAs like "Learn More About Treatment" encourage deeper dives. For conferences, these charts stand out, as seen in TEDMED talks where visuals amplified messages. Conclude presentations by recapping insights, prompting questions, and reinforcing calls to action. Embrace this template to make your medical stories not just heard, but remembered and acted upon.
FAQ
How editable are the medical charts?
Fully - alter data, colors, and elements to suit your presentation.
Compatible with Google Slides?
Yes, upload and edit without issues.
Suitable for non-medical uses?
Yes, adaptable for general science or education.
File formats provided?
.pptx for PowerPoint compatibility.
Integrating custom images?
Easily insert your own for personalized touches.
Tips for beginners?
Start simple; use included samples as guides.