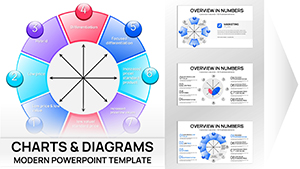
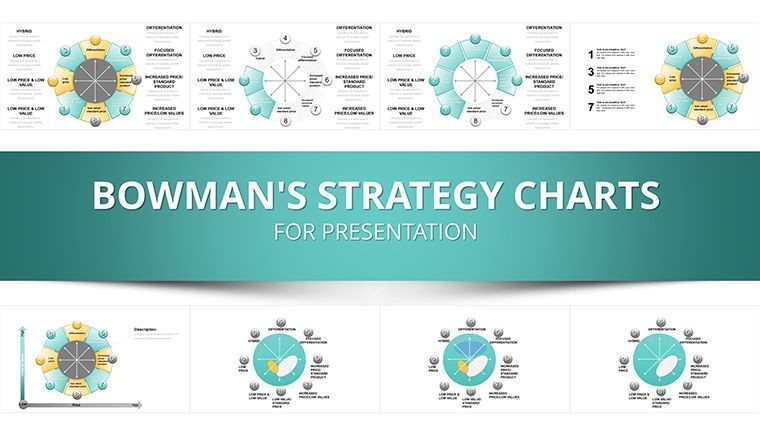
Bowman's Strategy Clock PowerPoint Template - Fully Editable & Instant Download


Type: PowerPoint Charts template
Category: Cycle, Business Models, Pie
Sources Available: .pptx
Product ID: PC00019
Template incl.: 35 editable slides
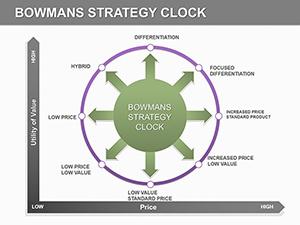
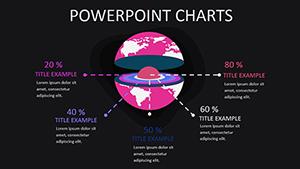
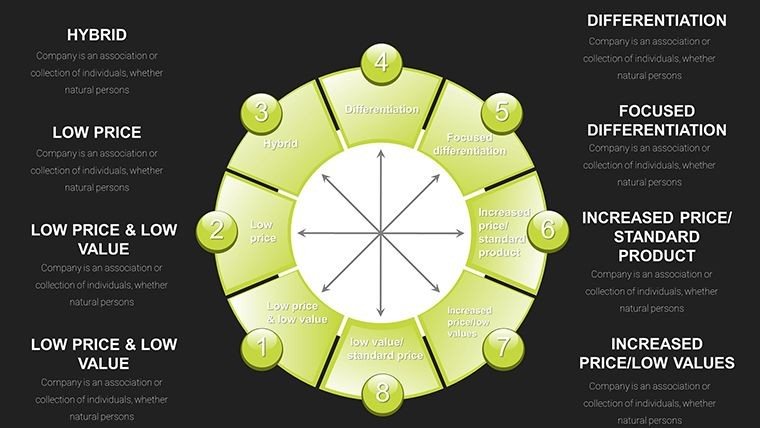
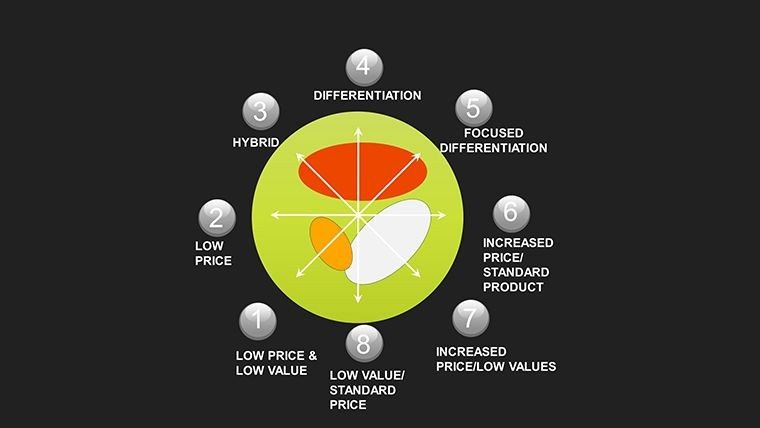
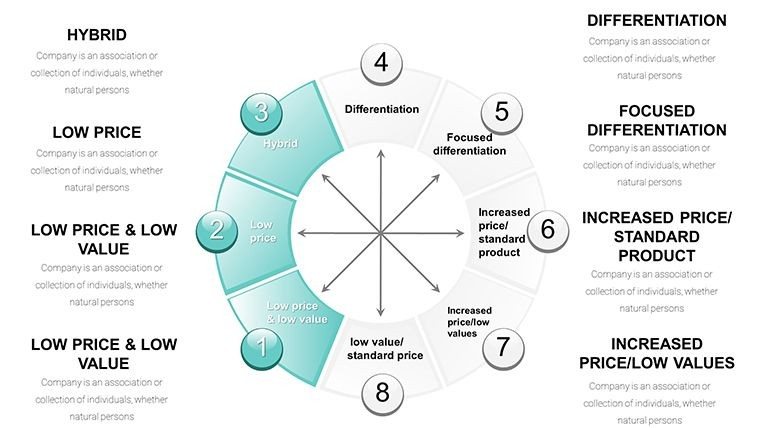
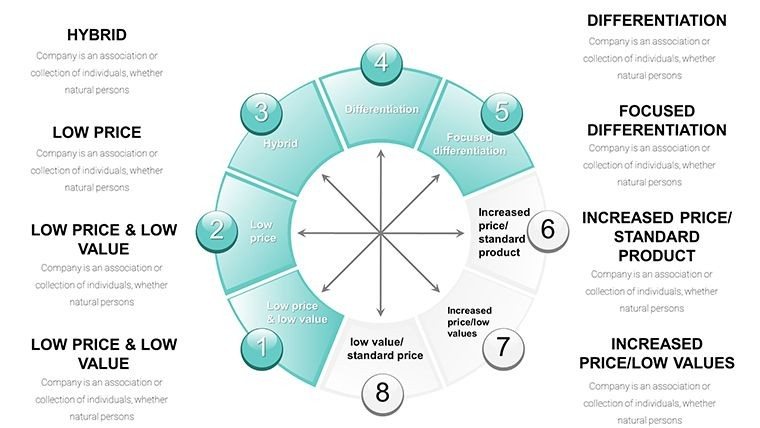
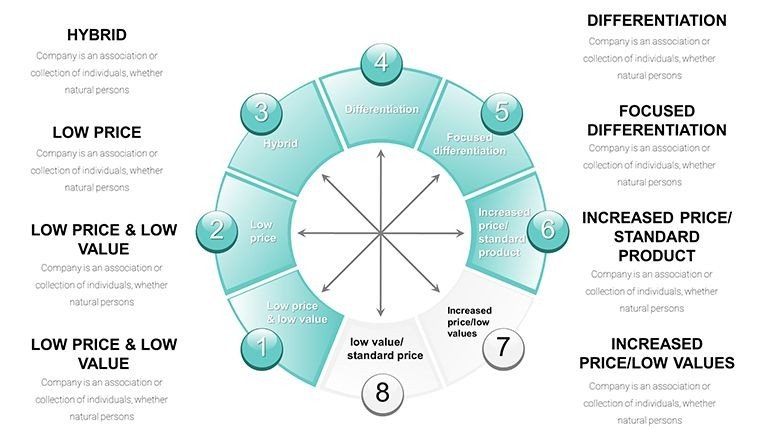
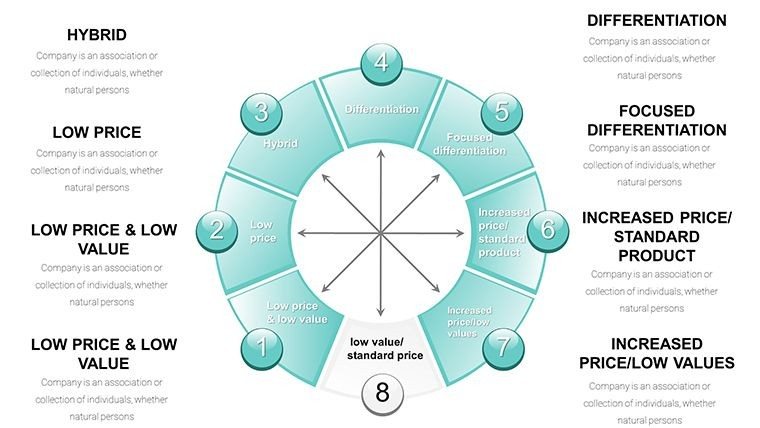
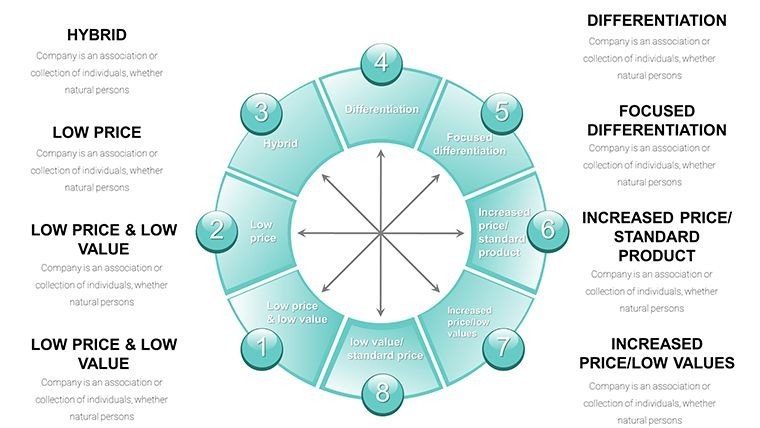
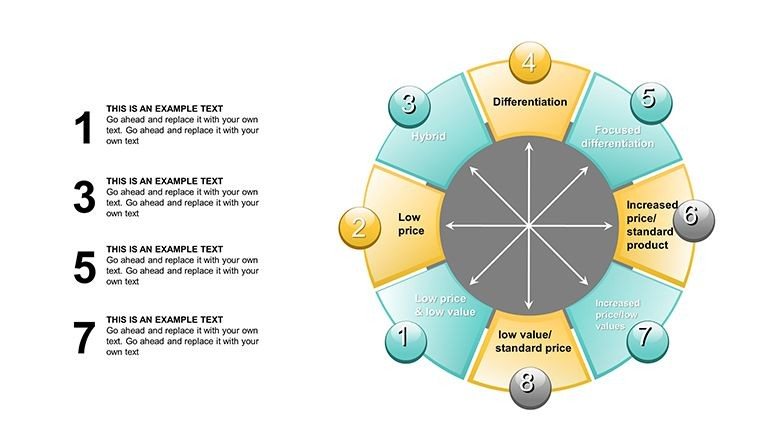
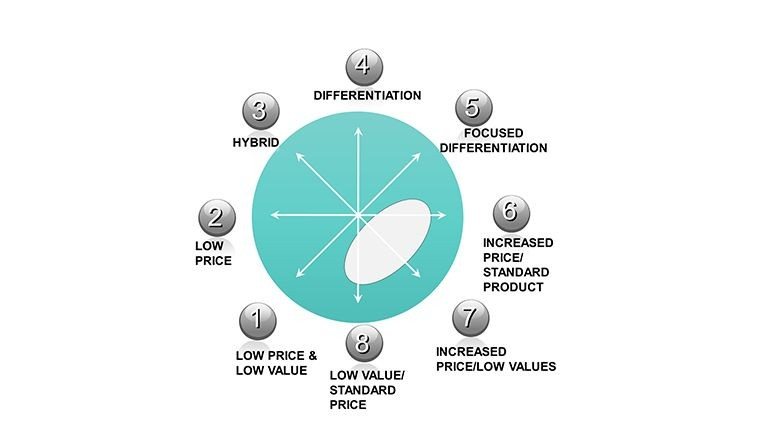
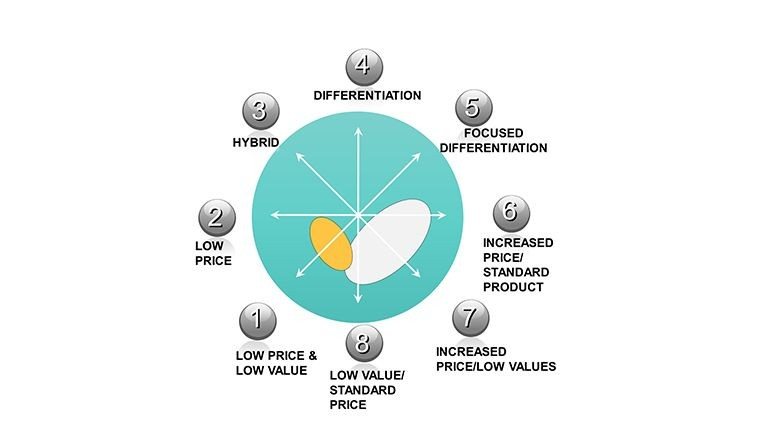
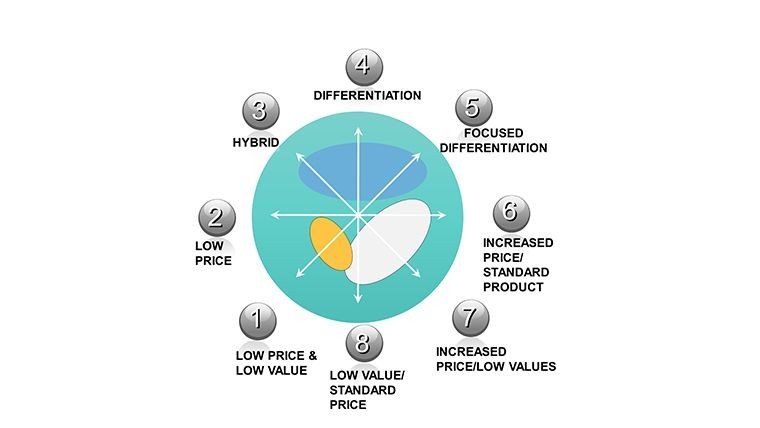
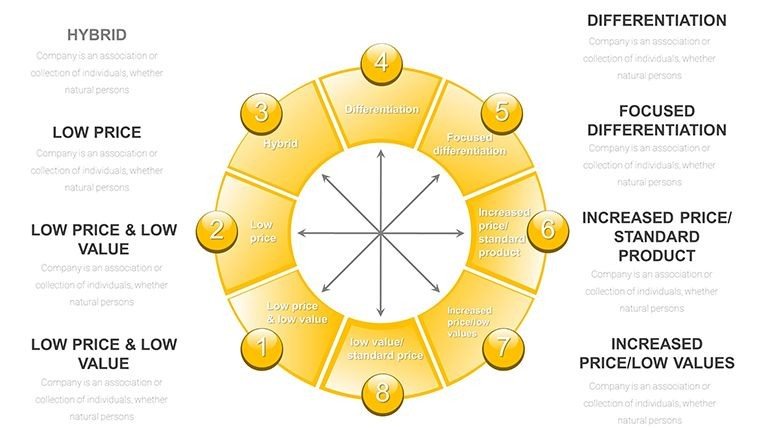
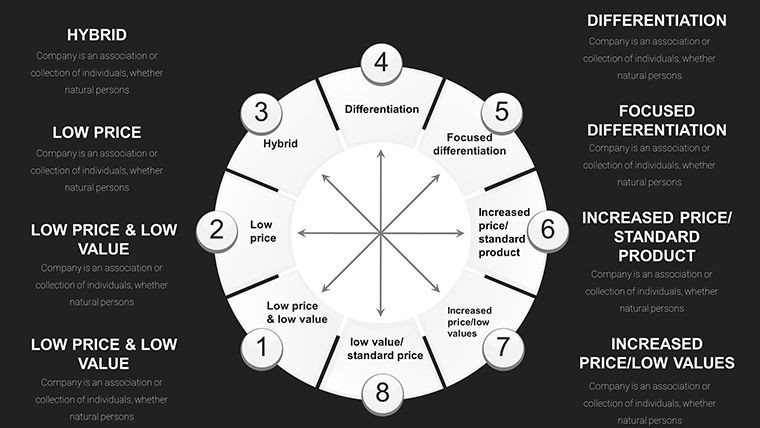
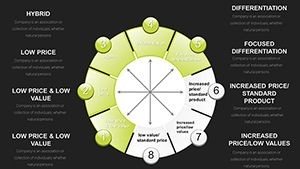
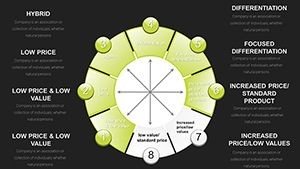
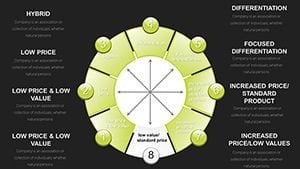
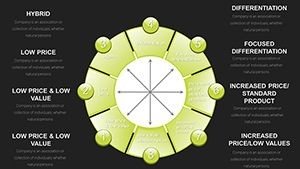
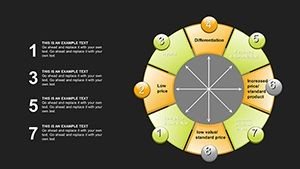
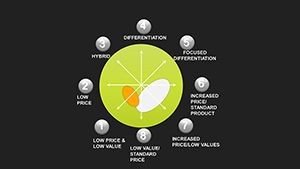
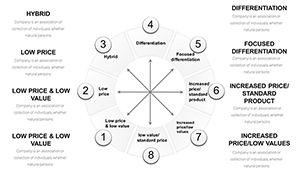
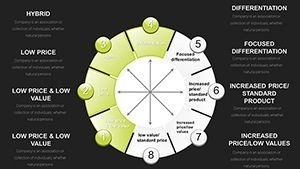
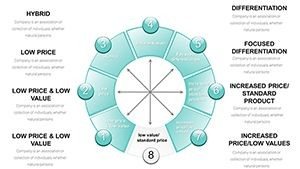
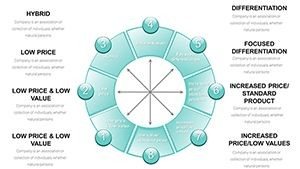
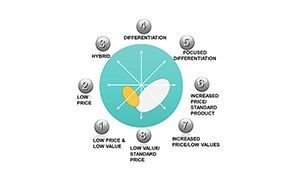
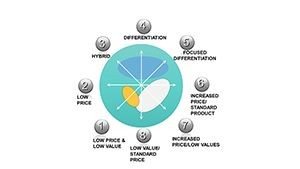
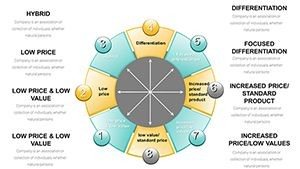
Explore Competitive Positioning with Bowman's Strategy Clock
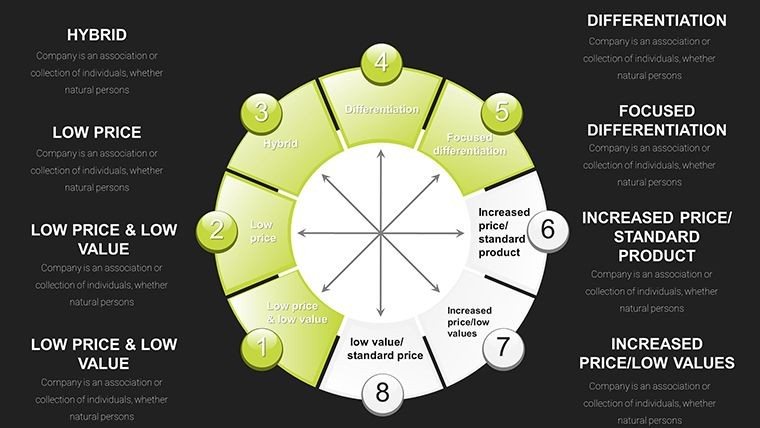
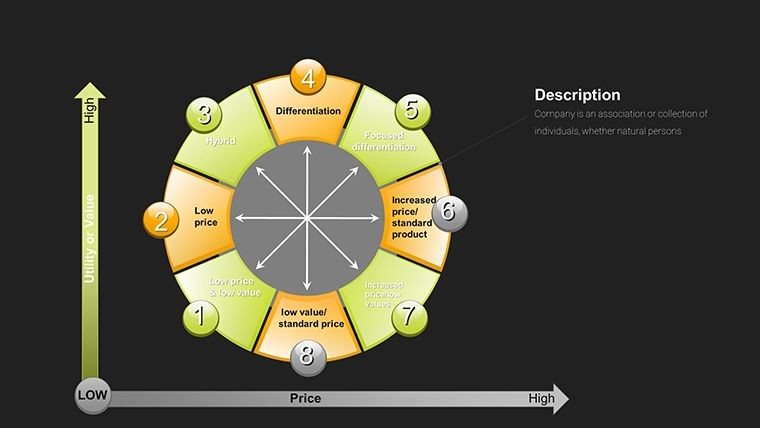
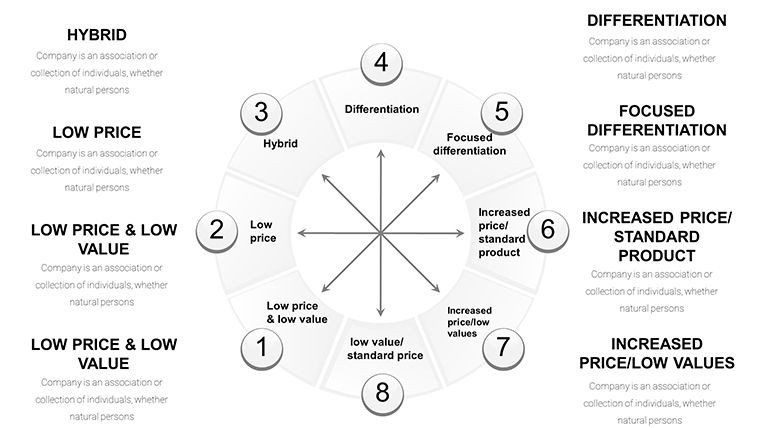
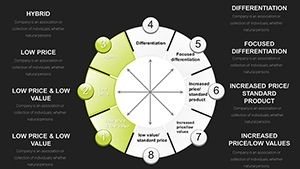
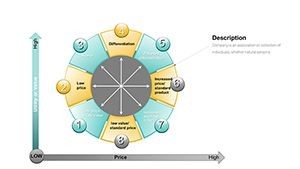
Developing effective competitive strategies requires evaluating perceived value against price across multiple positions. This Bowman's Strategy Clock PowerPoint template provides 35 comprehensive slides with detailed clock diagrams that illustrate all eight strategic options clearly. Strategy teams use these visuals to facilitate discussions and align on positioning decisions.
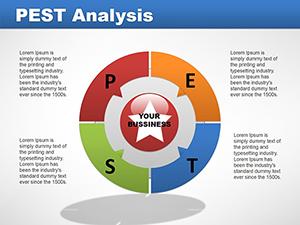
The template supports in-depth analysis of differentiation, cost leadership, and hybrid approaches, helping organizations identify viable paths forward in competitive markets.
Key Features
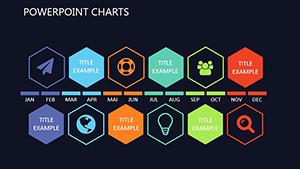
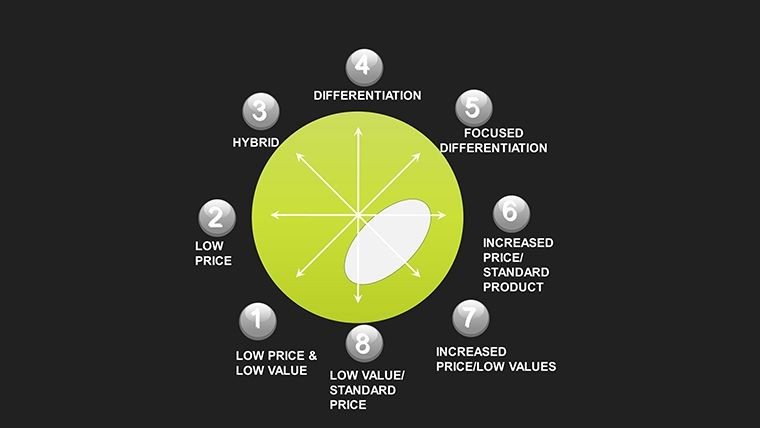
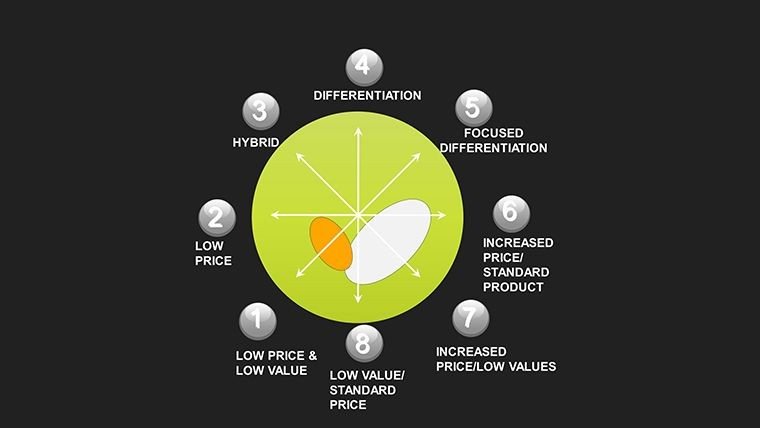
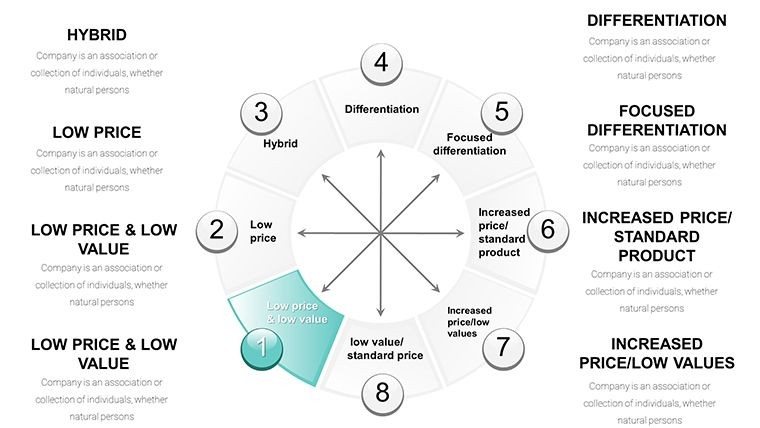
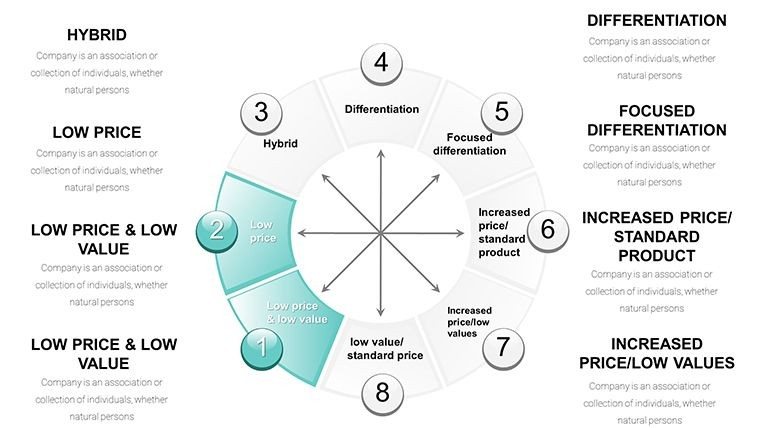
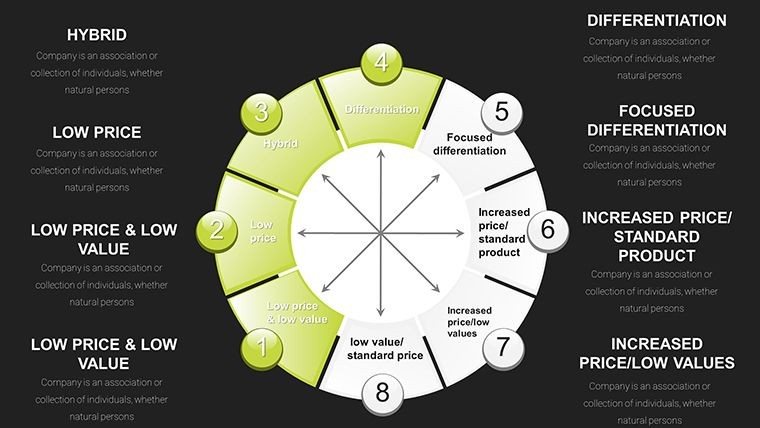
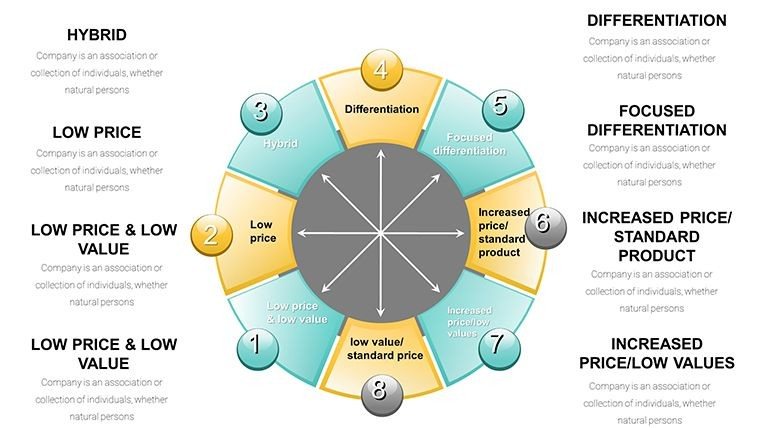
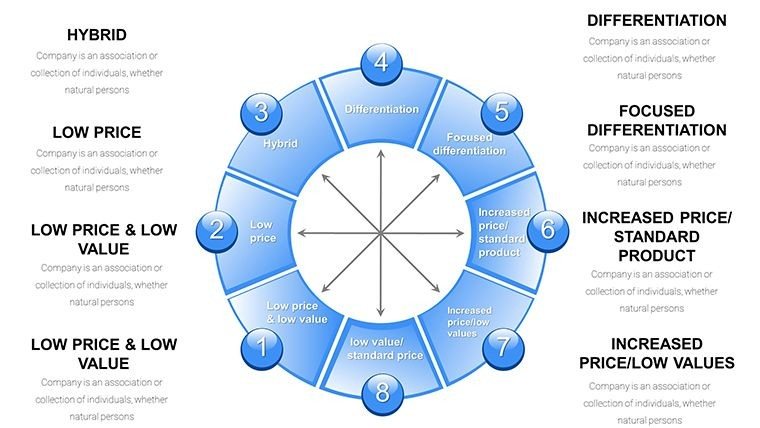
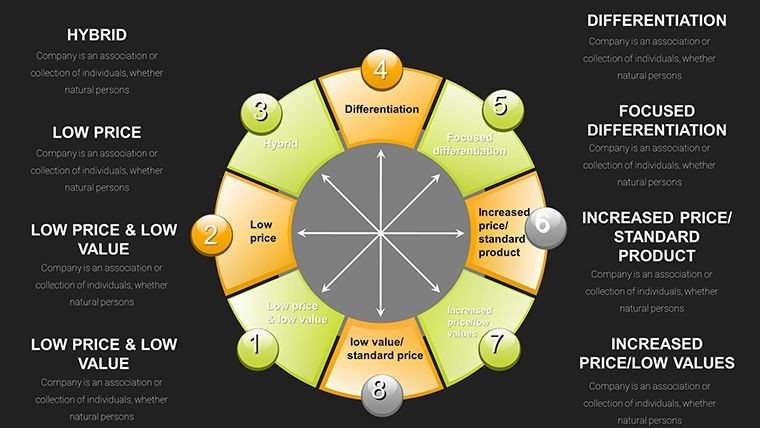
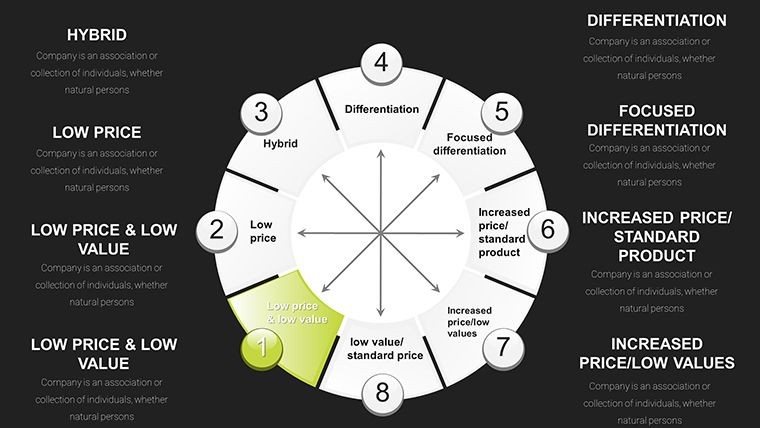
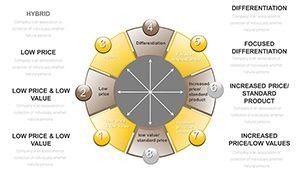
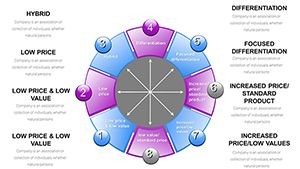
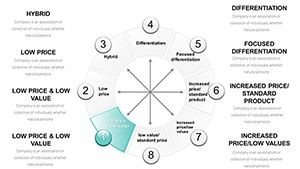
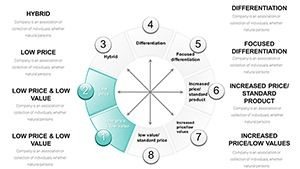
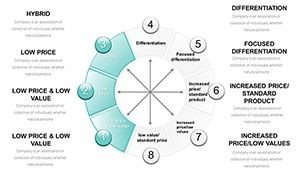
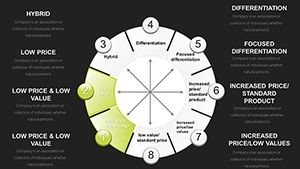
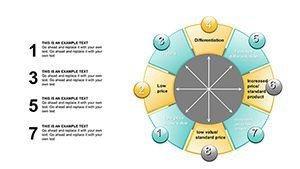
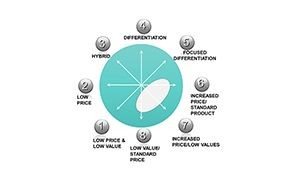
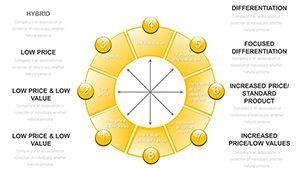
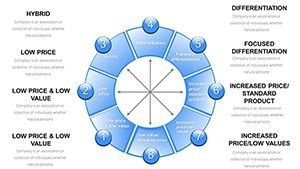
- 35 unique slides with variations of the strategy clock
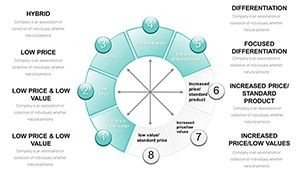
- Fully editable positions, labels, and supporting charts
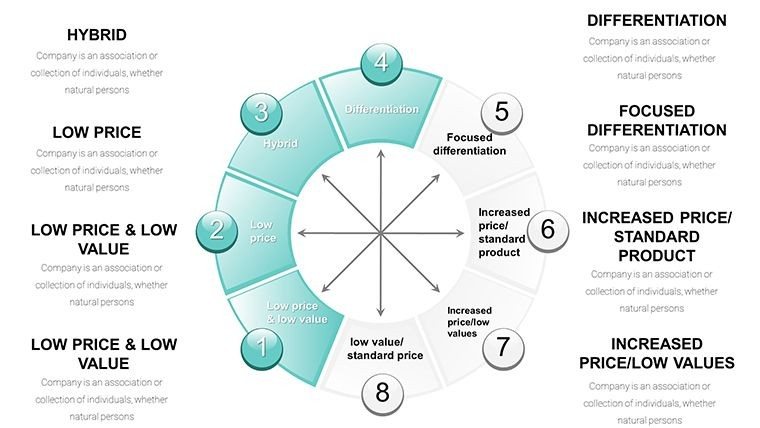
- Modern design with gradient fills and clear segmentation
- Compatible with PowerPoint and Google Slides
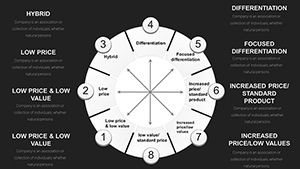
How to Customize This Template
After download, open the file and update each clock position with your company's data or analysis. Adjust colors, add annotations, or include supporting graphs. The flexible layout accommodates detailed explanations of each strategic option.
Professional Applications
Consultants guide clients through positioning workshops. Marketing teams evaluate brand strategies against competitors. Executives present options during planning sessions, while business students analyze case studies using the framework.
Download this template today to refine your competitive strategy.
Frequently Asked Questions
What software do I need to edit?
The template is compatible with Microsoft PowerPoint and Google Slides.
How many slides are included?
The template contains 35 fully editable slides centered on Bowman's Strategy Clock.
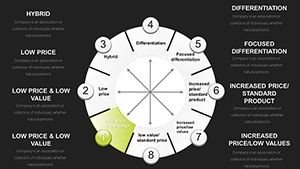
Are the clock diagrams customizable?
Yes, every element—including segments, text, and colors—is fully editable.
Can I use this for commercial purposes?
Yes, the template is suitable for business, consulting, education, and commercial use.
Is instant download available?
Yes, you get immediate access to the file after purchase.