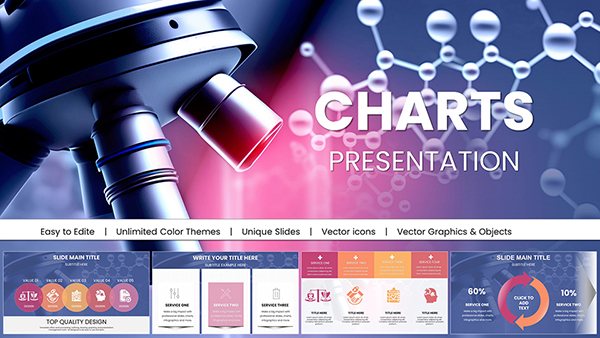
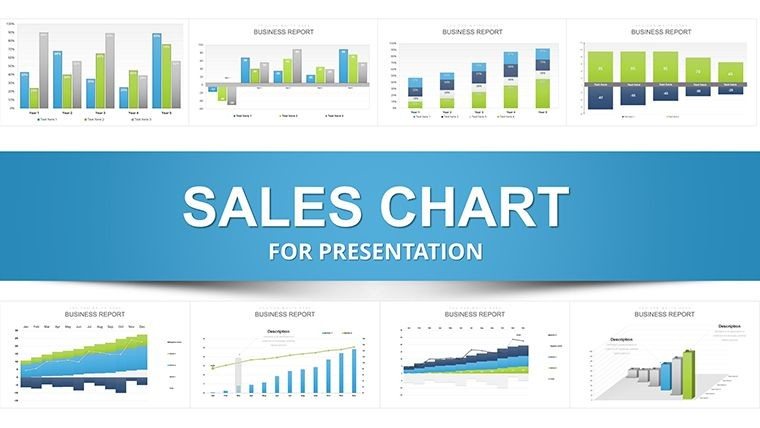
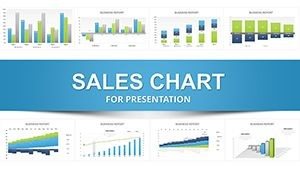
Sales Infographic PowerPoint Template - 47 Slides


In high-stakes sales presentations, raw numbers often fall flat with executives who need quick insights to make decisions. This sales infographic PowerPoint charts template changes that by blending precise data visualization with engaging infographic elements, helping you turn quarterly figures into persuasive stories that drive approval and action.
I've used similar layouts in dozens of client decks for Fortune 500 sales teams, where clear trend lines and pipeline funnels have shortened meeting times and boosted buy-in. With 47 fully editable slides, this template provides the exact tools to showcase revenue growth, client segment comparisons, and forecast projections without starting from blank charts.
Professionals rely on it because the pre-built animations and color palettes ensure your message lands sharply, whether in boardrooms or virtual pitches.
Exploring the Core Layouts in This Sales Infographic Collection
The template organizes slides into logical sections that mirror real sales reporting flows, making it simple to drop in your data and present confidently.
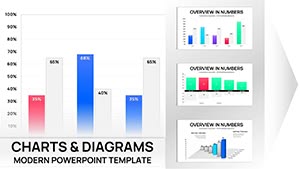
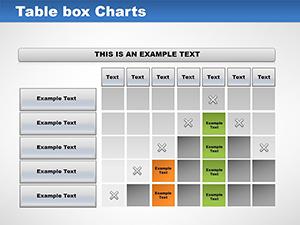
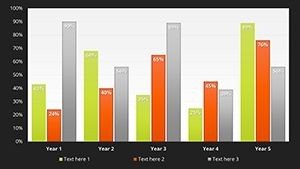
- Opening metrics slides: Feature pie charts integrated into clean tables to highlight key performance indicators like market share or revenue breakdown by region.
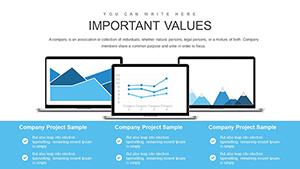
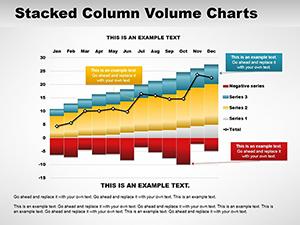
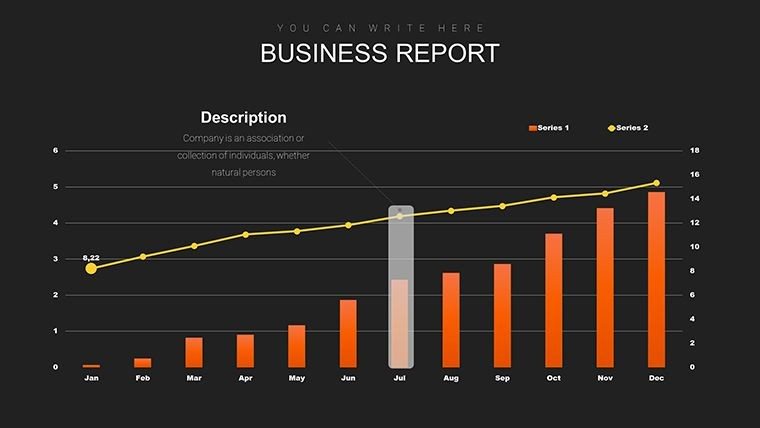
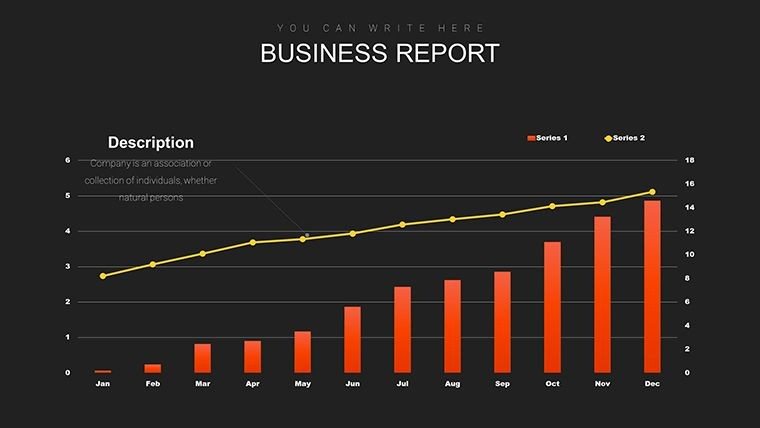
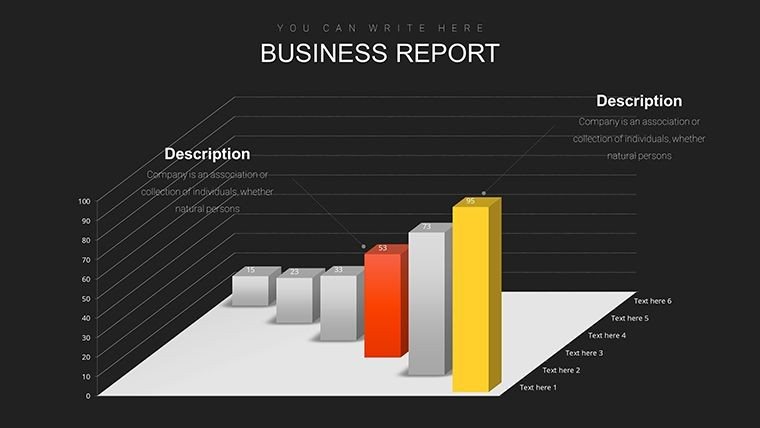
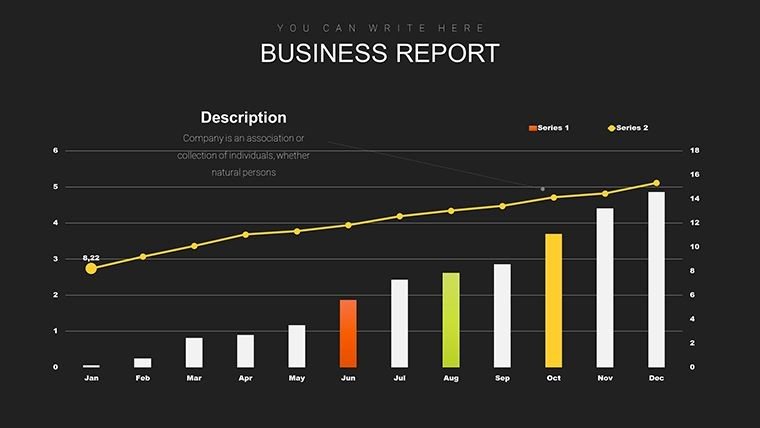
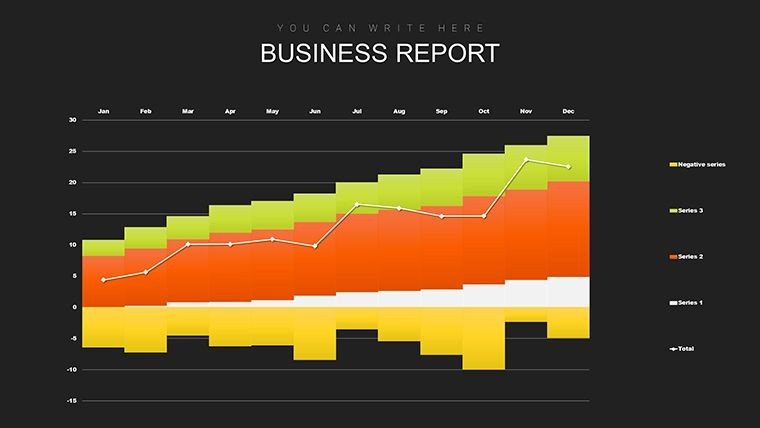
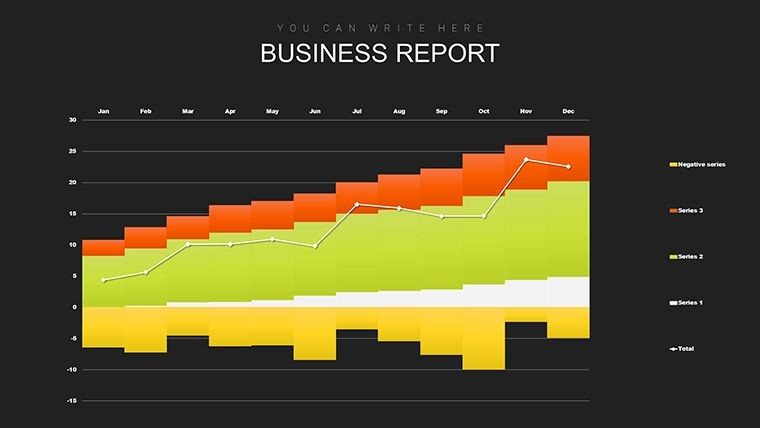
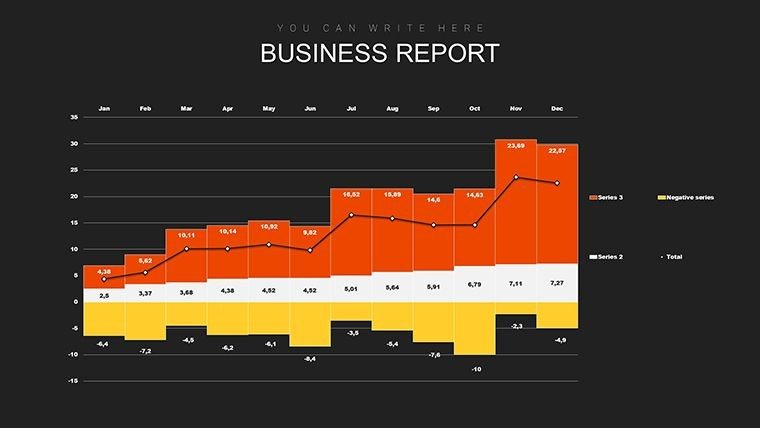
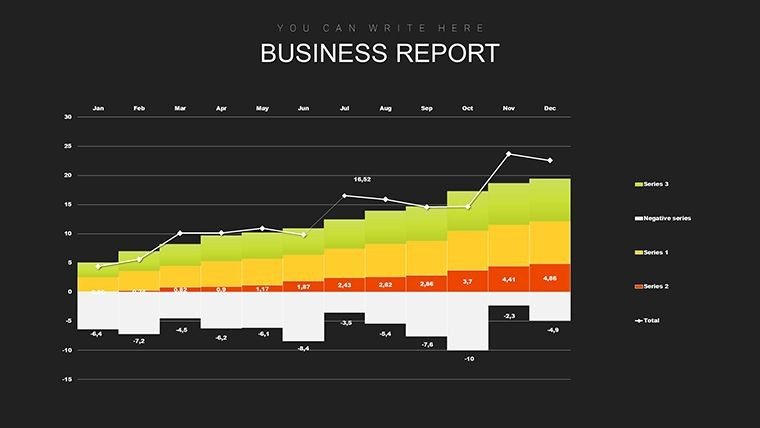
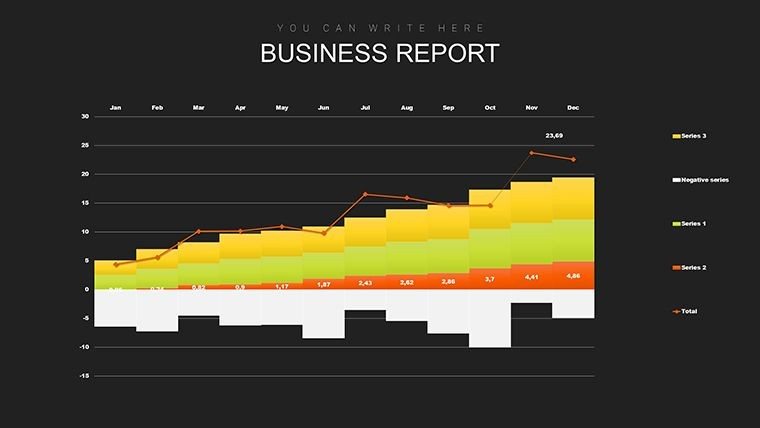
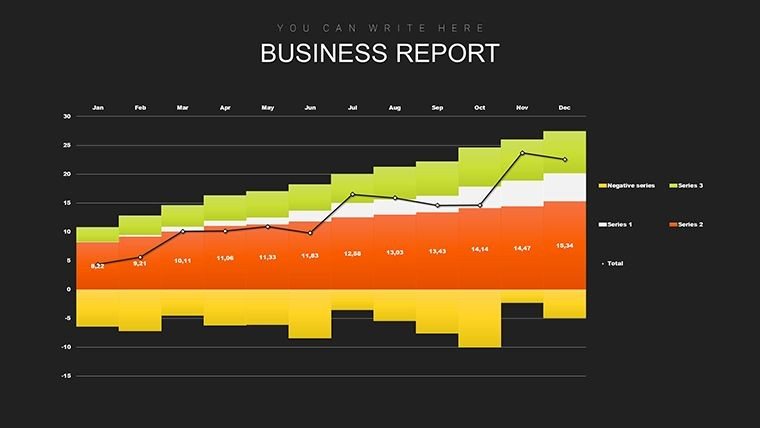
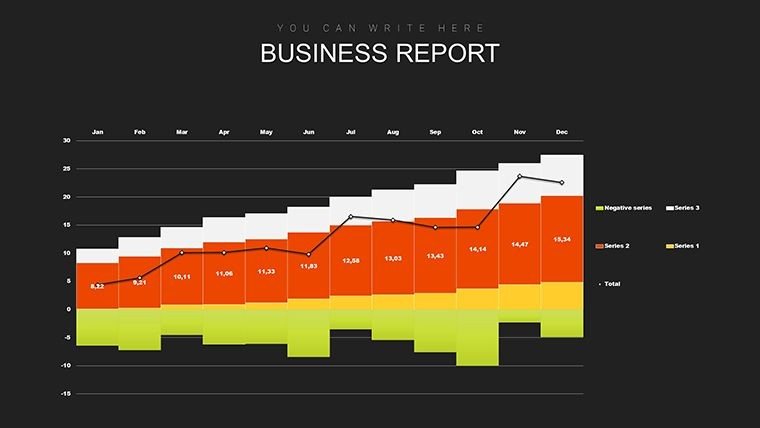
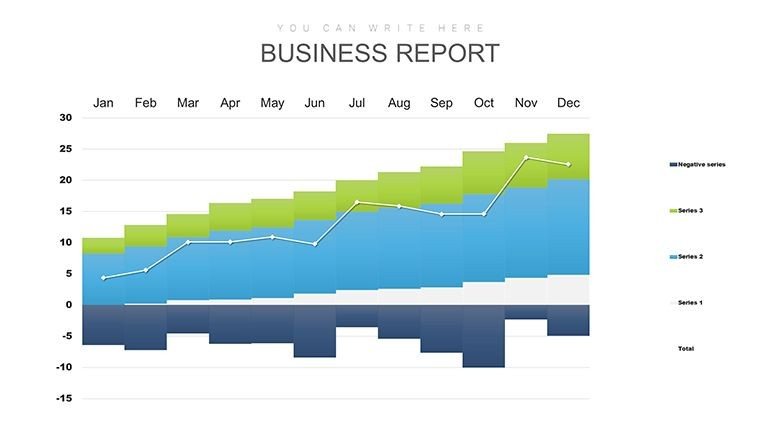
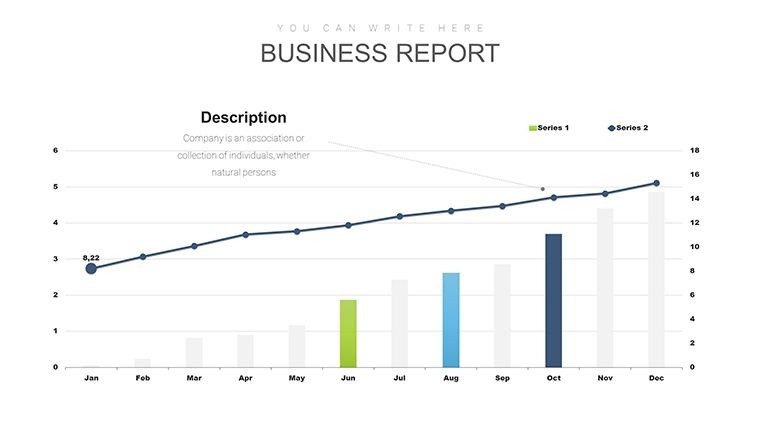
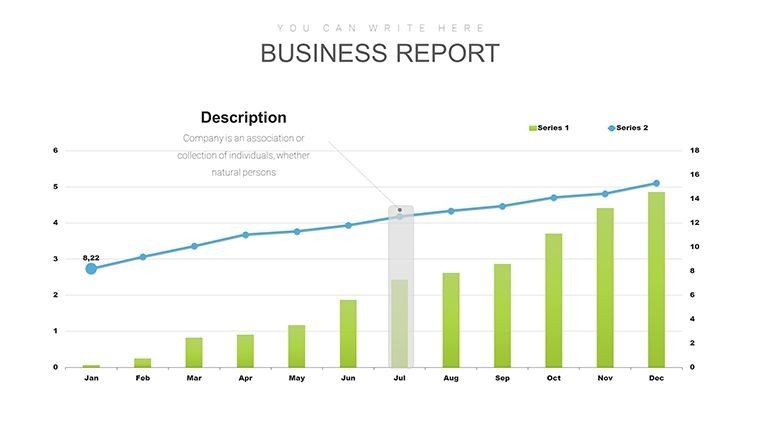
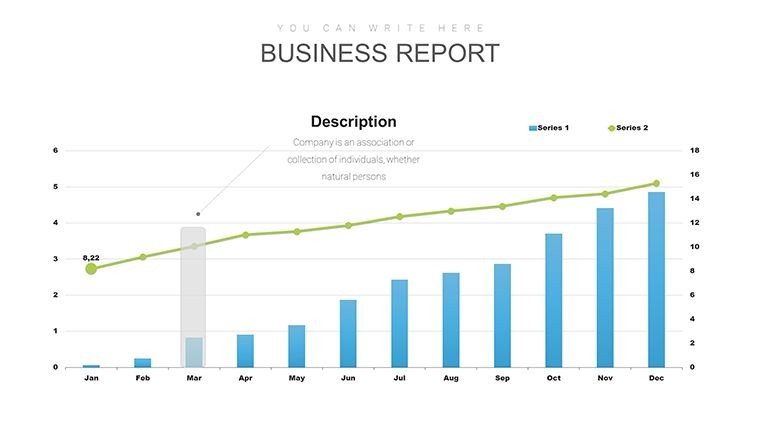
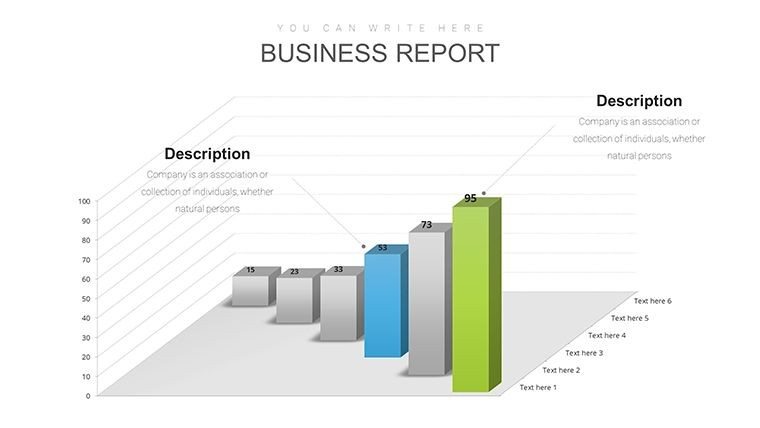
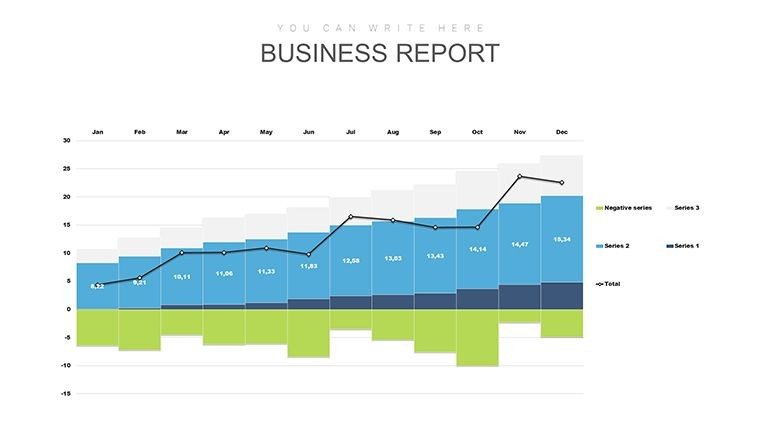
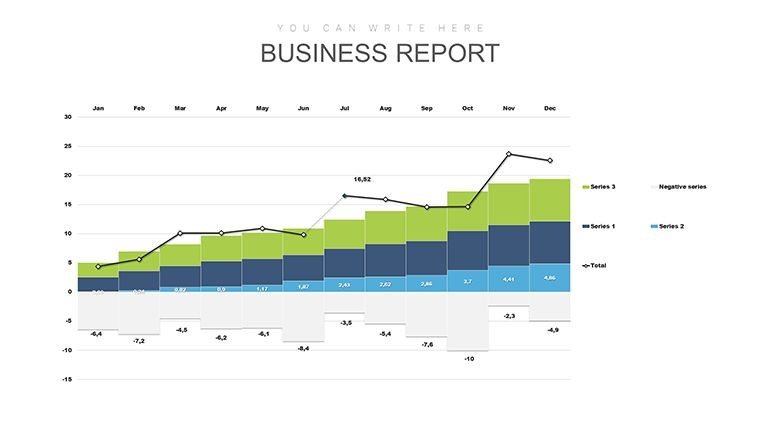
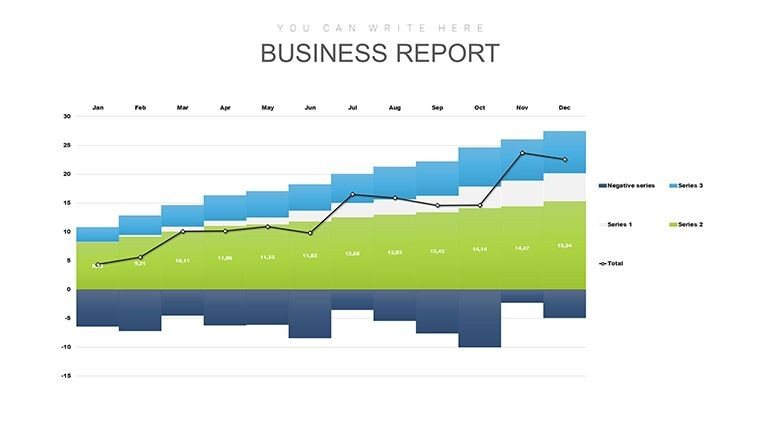
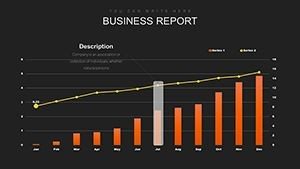
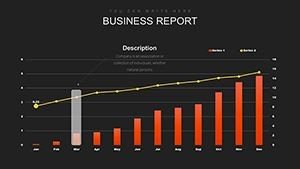
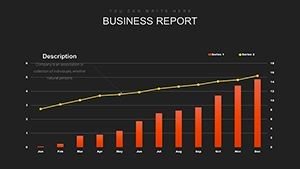
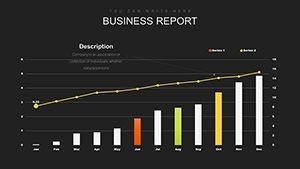
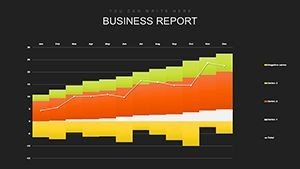
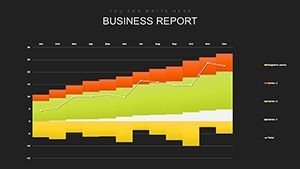
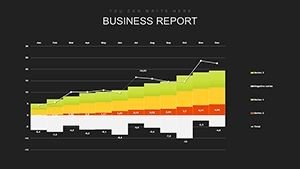
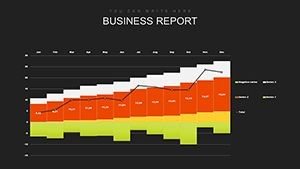
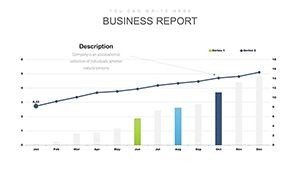
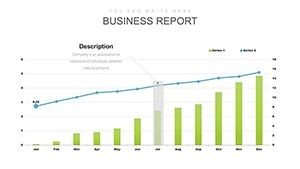
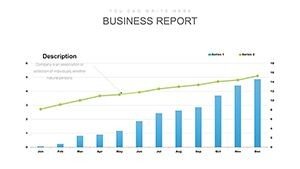
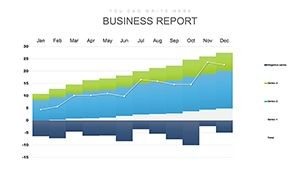
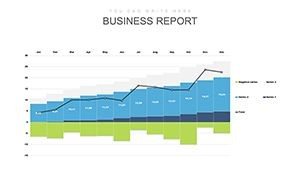
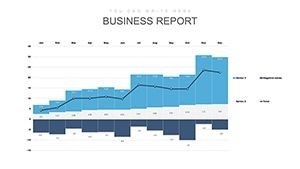
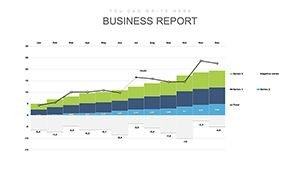
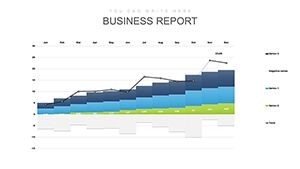
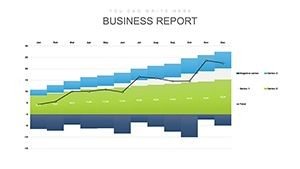
- Trend analysis layouts: Multi-line graphs track monthly or yearly progress, with space for annotations that explain spikes or dips in activity.
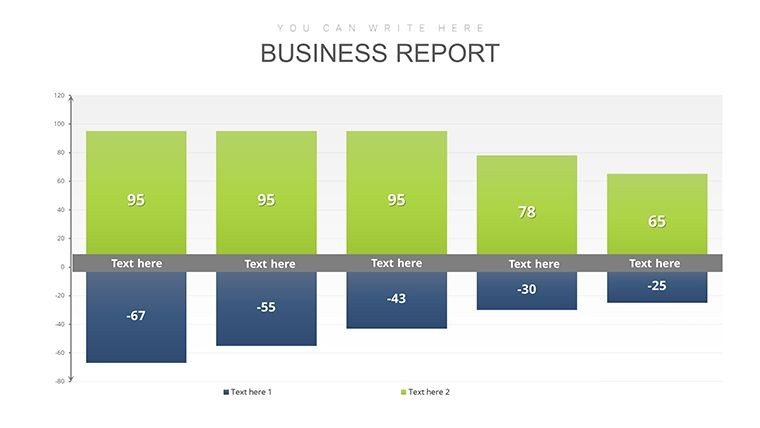
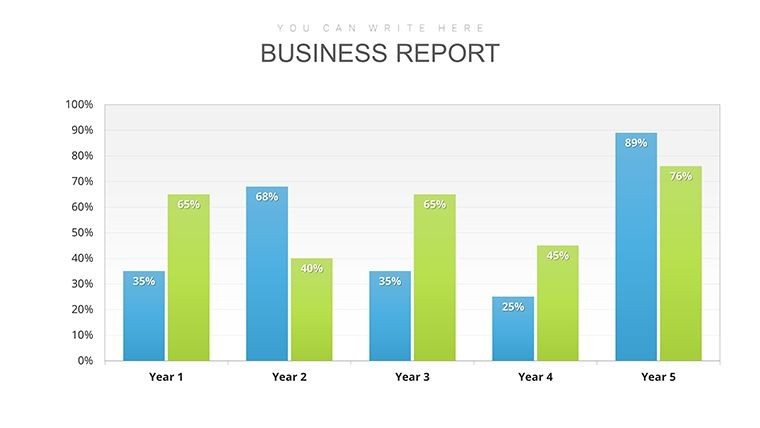
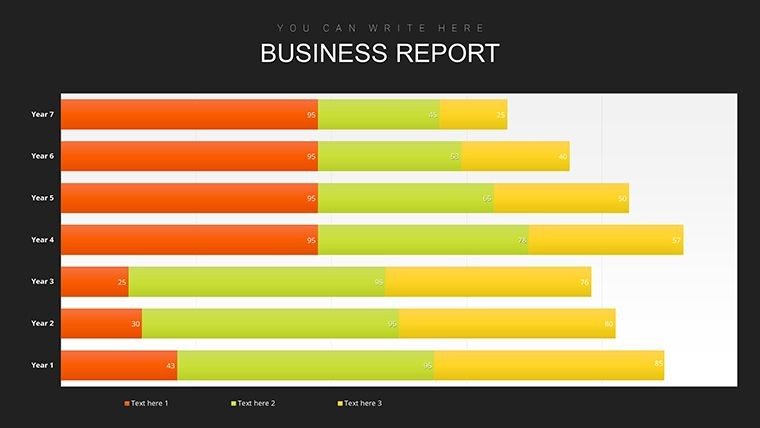
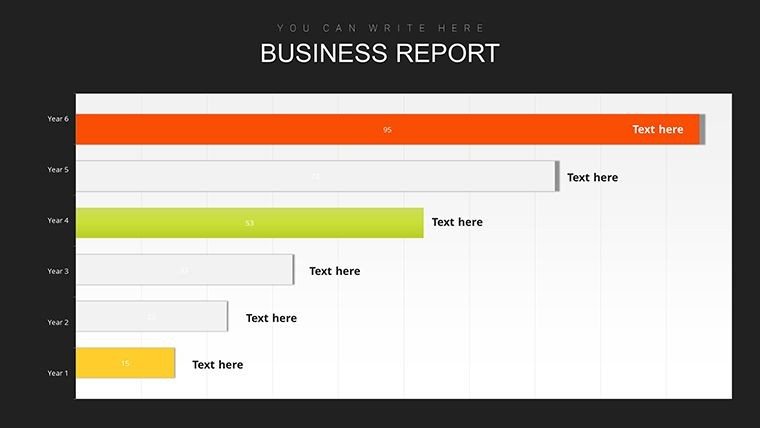
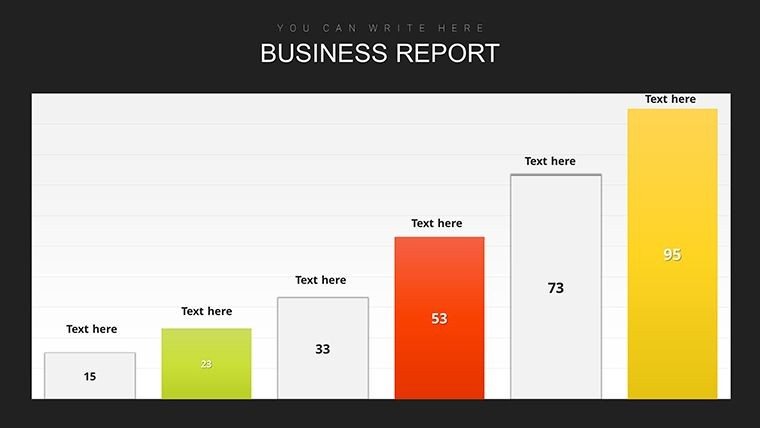
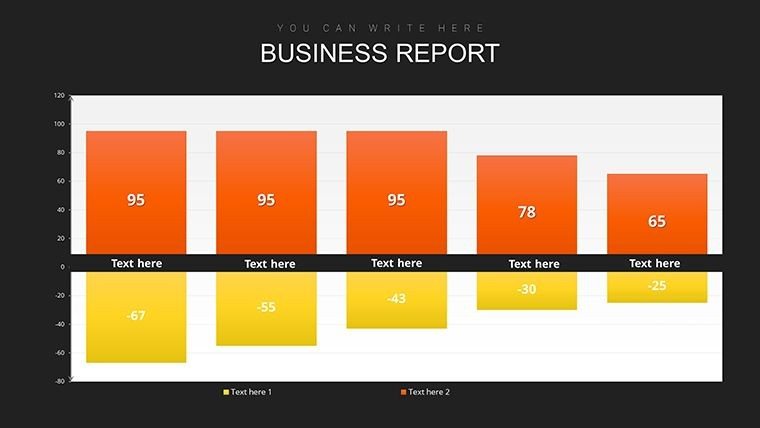
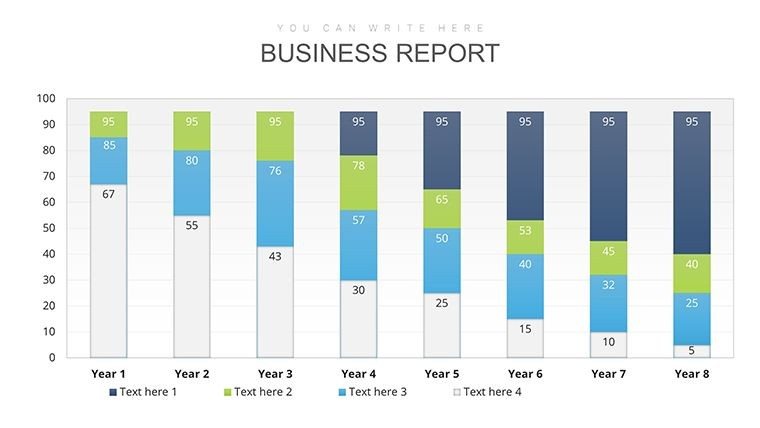
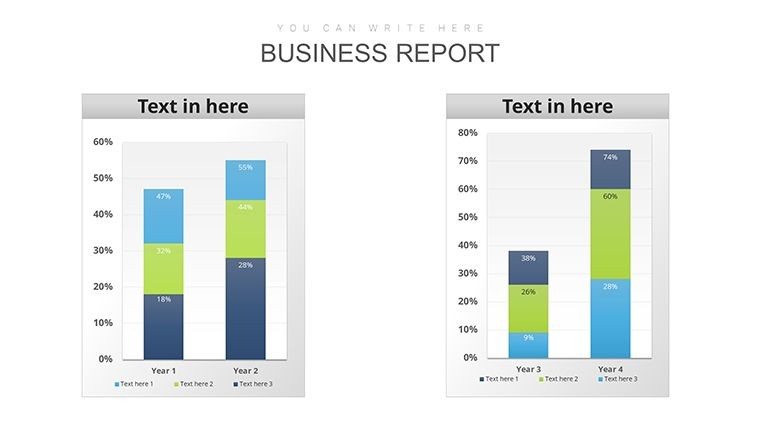
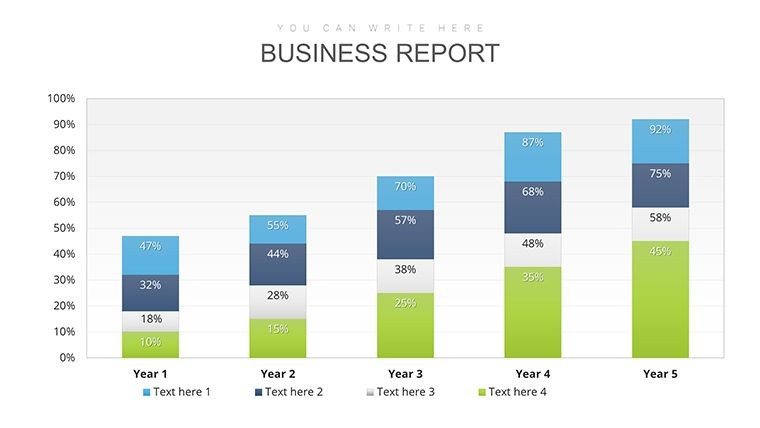
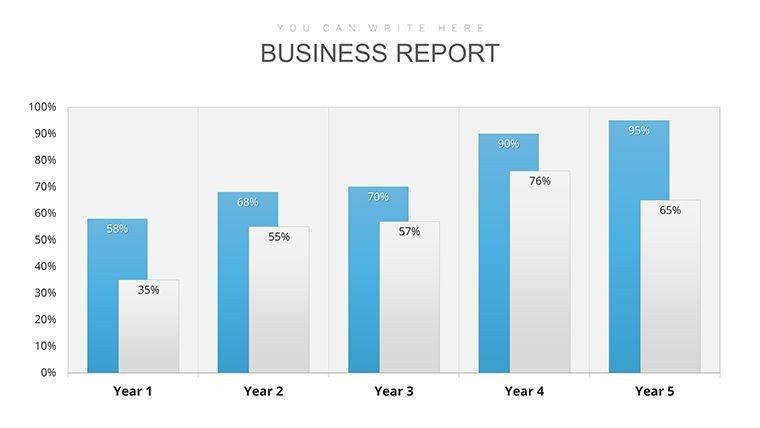
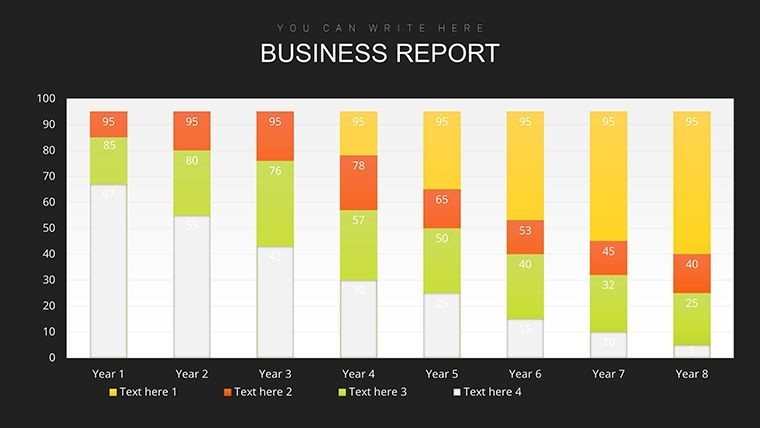
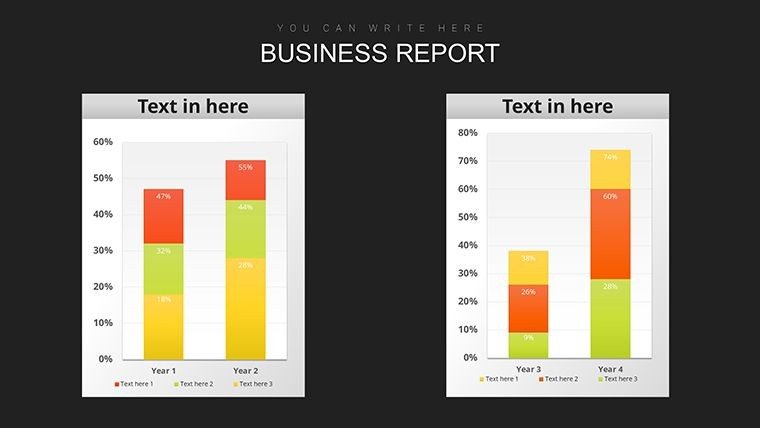
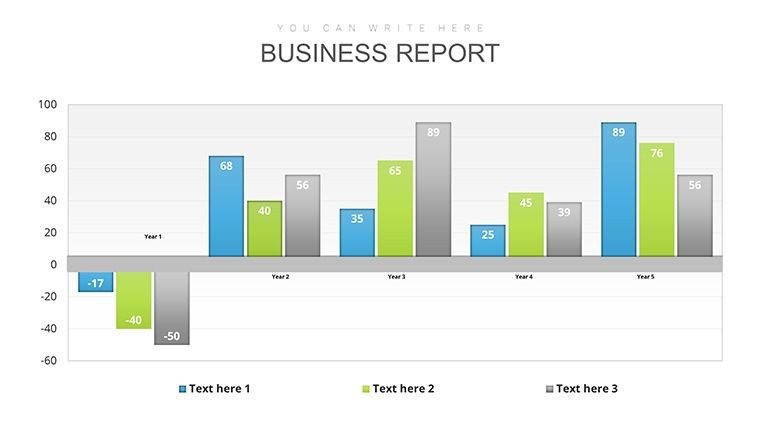
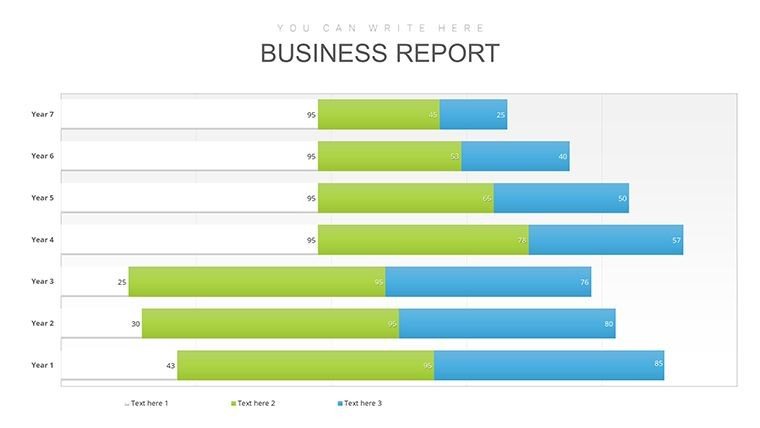
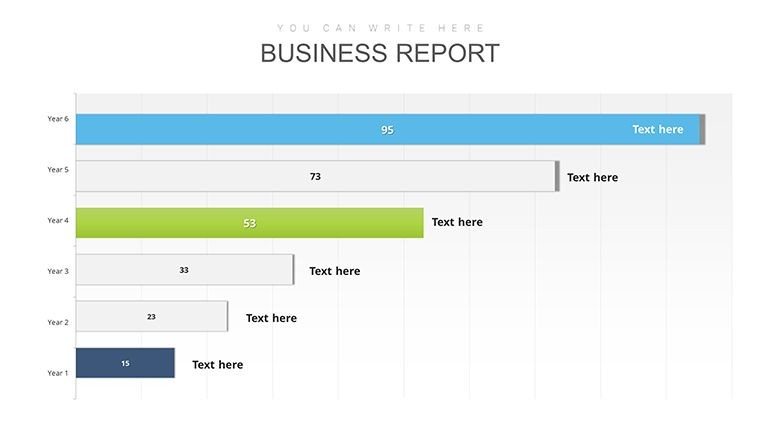
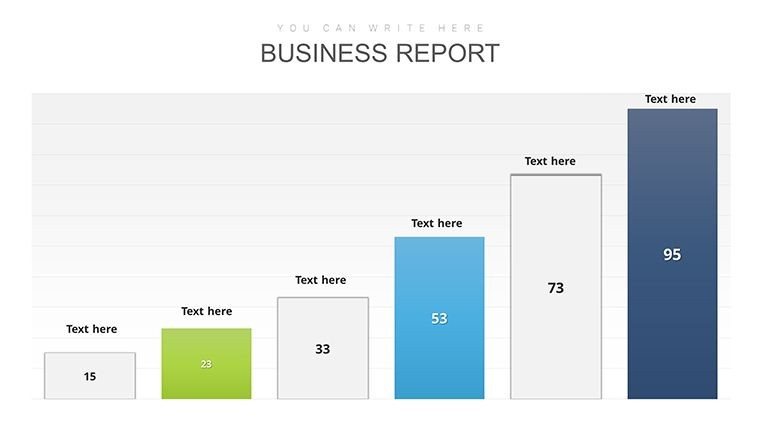
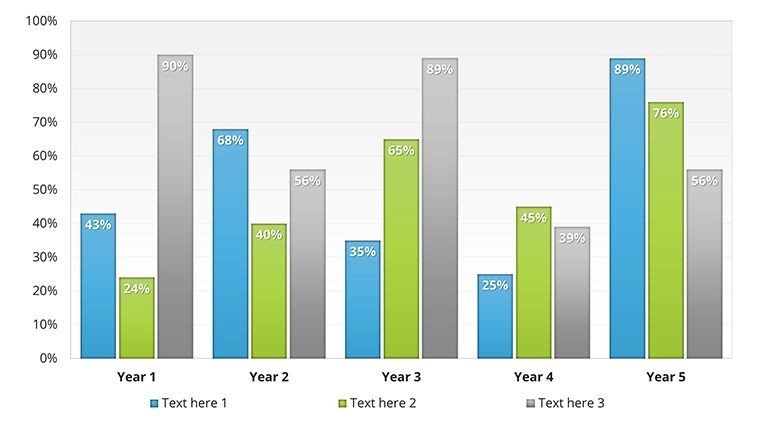
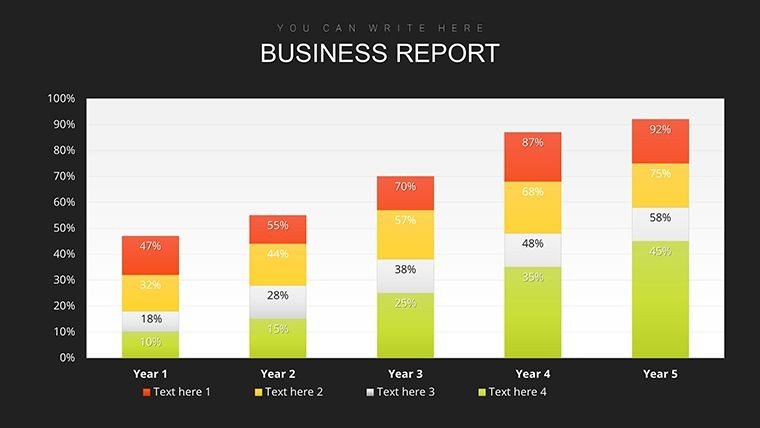
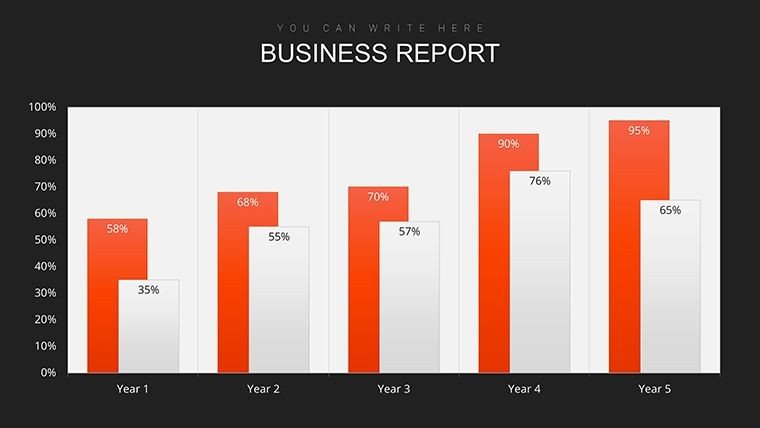
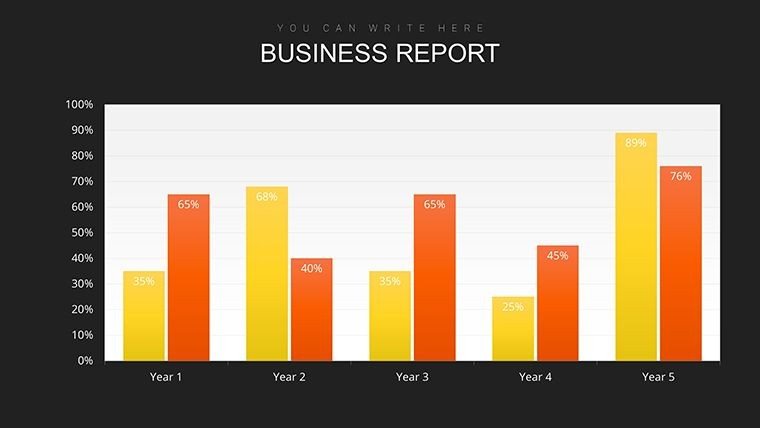
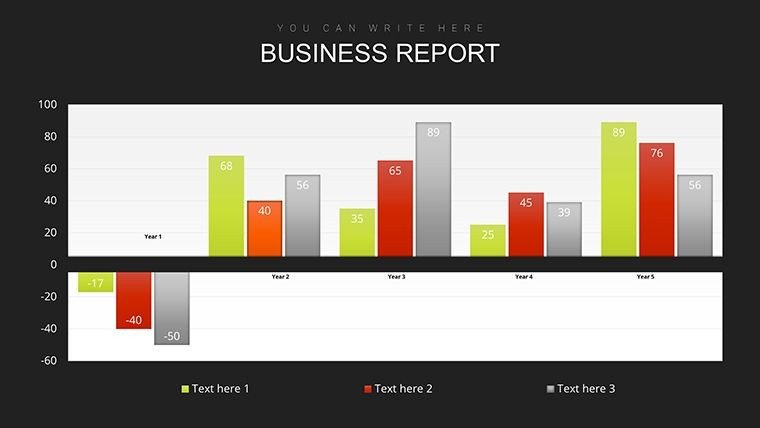
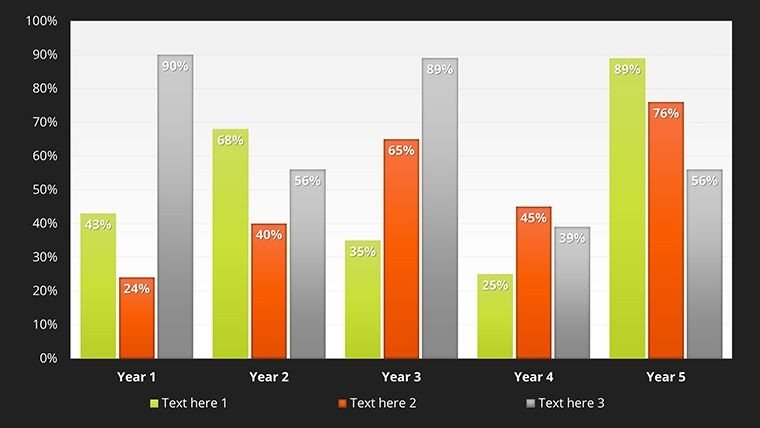
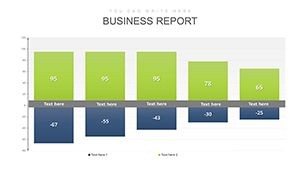
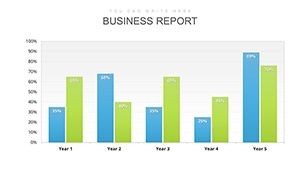
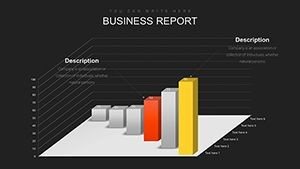
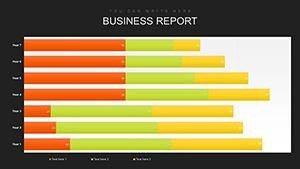
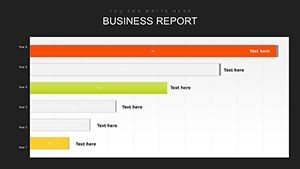
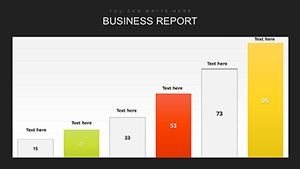
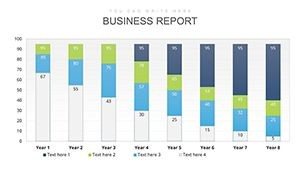
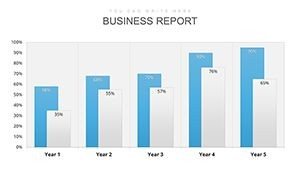
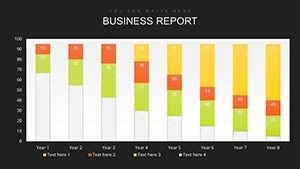
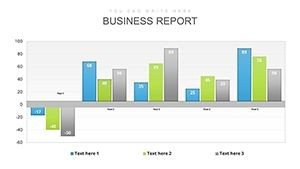
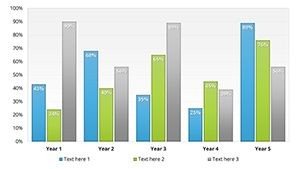
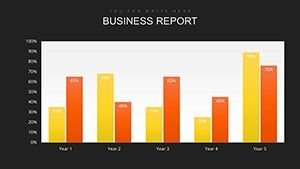
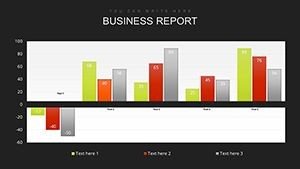
- Comparison bars: Horizontal and vertical bar sets allow side-by-side views of client groups, product lines, or team performances.
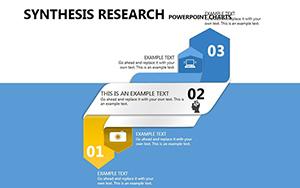
- Pipeline funnels: Dedicated slides visualize conversion stages, complete with percentage drops and value totals at each level.
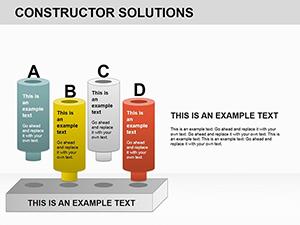
- Hybrid infographics: Combine icons, tables, and charts for cost structures or projection scenarios, with built-in animation sequences to reveal data progressively.
Each element uses vector shapes for flawless scaling, and multiple color themes let you align with brand guidelines in seconds.
Real-World Applications for Sales Professionals
Sales leaders preparing quarterly business reviews appreciate how these infographics distill complex datasets into digestible visuals that keep executive attention focused.
In client-facing proposals, the funnel charts effectively demonstrate opportunity progression, building credibility when discussing pipeline health. Marketing teams use the bar comparisons to present campaign ROI across channels during strategy sessions.
Analysts reporting on territory performance find the trend lines invaluable for spotting patterns that inform resource allocation decisions.
Seamless Integration Into Your Existing Workflow
This sales infographic PowerPoint charts template fits directly into standard preparation routines. Open in PowerPoint 2010 or later, or import to Google Slides for collaboration.
Copy-paste from Excel spreadsheets updates charts automatically, while manual tweaks to colors, fonts, or icons take minutes rather than hours. The included animation presets add polish without complicated timing setups.
For tight deadlines, start with a relevant slide, input data, and export – saving significant time compared to custom builds.
Proven Scenarios From Actual Client Decks
When pitching expansion budgets to investors, founders leverage the projection hybrids to illustrate upside potential alongside conservative estimates.
Regional managers during team updates employ client comparison bars to recognize top performers and address gaps constructively. In training workshops, facilitators use animated funnel slides to teach conversion optimization techniques interactively.
Enterprise account directors presenting annual reviews rely on the comprehensive metrics overviews to align stakeholders on achievements and next steps.
Advantages Over Alternative Approaches
| Aspect | This Sales Infographic Template | Default PowerPoint Charts | Building From Scratch | Free Online Options |
|---|---|---|---|---|
| Design Consistency | Professional infographic style throughout | Basic and mismatched | Time-consuming to unify | Variable quality |
| Animation Quality | Pre-built progressive reveals | Manual and clunky | Requires advanced skills | Often none |
| Sales-Specific Layouts | Funnels, pipelines, forecasts ready | Generic only | Custom research needed | Rarely tailored |
| Time to Professional Deck | Minutes with your data | Hours of formatting | Days of design work | Inconsistent results |
Download this template today and elevate your next sales presentation with visuals that command attention and convey expertise effortlessly.
Industry-Specific Use Cases for Maximum Impact
In technology sales, product managers highlight adoption curves using trend lines to justify roadmap priorities. Healthcare account executives present territory penetration with regional pie breakdowns during leadership alignments.
Financial services teams visualize asset growth pipelines to secure internal funding approvals. Manufacturing sales directors compare channel performances to optimize distribution strategies.
Consulting partners incorporate client portfolio analyses to demonstrate value delivery in retainer renewals.
Frequently Asked Questions
How do I customize the colors to match my company branding?
Select any element, use the format shape options to change fills and lines, or apply one of the built-in theme variations – the entire slide updates consistently in under a minute.
Can these charts link directly to live Excel data?
Yes, paste special as linked objects or embed Excel sheets; changes in your source file reflect instantly when refreshing in PowerPoint.
This works seamlessly for dynamic quarterly updates.
Are the animations suitable for both in-person and virtual presentations?
The subtle entrance and emphasis effects perform reliably across platforms, including screen shares, without overwhelming bandwidth.
What file formats are included in the download?
You receive .pptx for modern PowerPoint, plus compatible sources – instant access after purchase for immediate editing.
Is this template optimized for Google Slides as well?
Import the .pptx file directly; most elements including charts and animations translate accurately for cloud-based collaboration.