Audit Process Flow PowerPoint Charts for Professional Precision


Presenting audit findings to a skeptical board or training internal teams on compliance procedures demands absolute clarity. I've built dozens of decks where poorly visualized audit processes led to misunderstandings; this audit process flow PowerPoint template eliminates that risk by providing structured, standard-aligned diagrams that command trust.
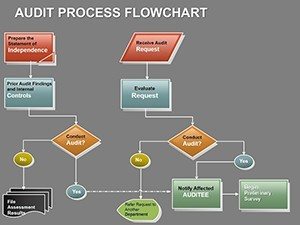
Featuring 14 specialized slides, this template guides viewers through planning, fieldwork, evaluation, and reporting phases with precise flowcharts and supporting elements. Color-coded for risks and controls, it draws on frameworks like COSO to ensure your visuals reflect professional rigor.
Whether conducting financial, operational, or IT audits, these layouts help you focus on insights rather than diagram drafting.
Detailed Breakdown of the 14 Audit-Focused Slides
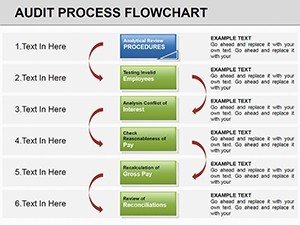
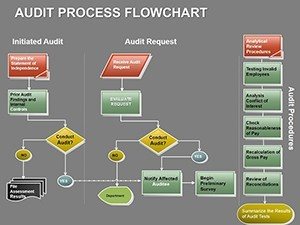
The template progresses logically through audit stages, with dedicated layouts for each critical component.
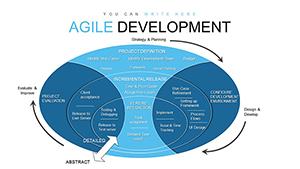
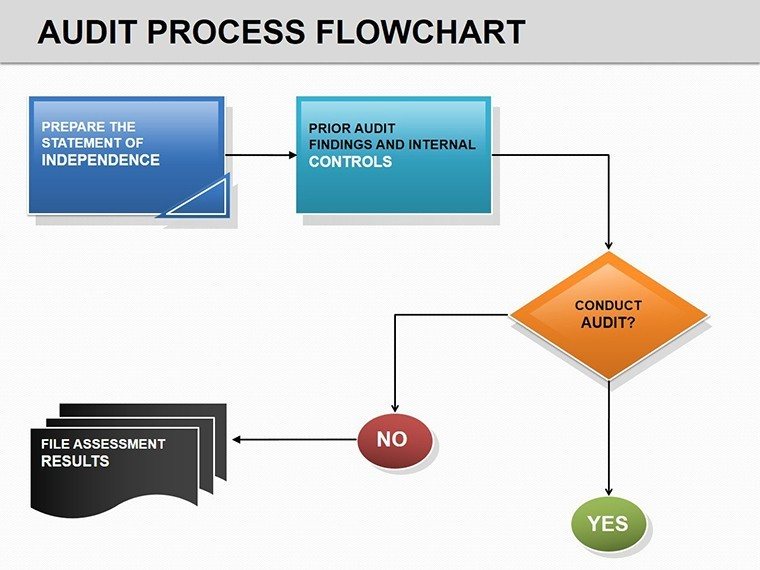
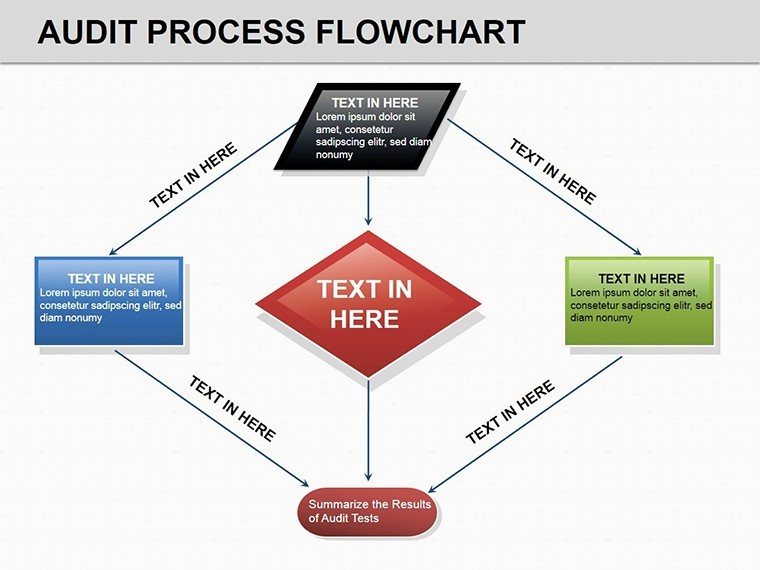
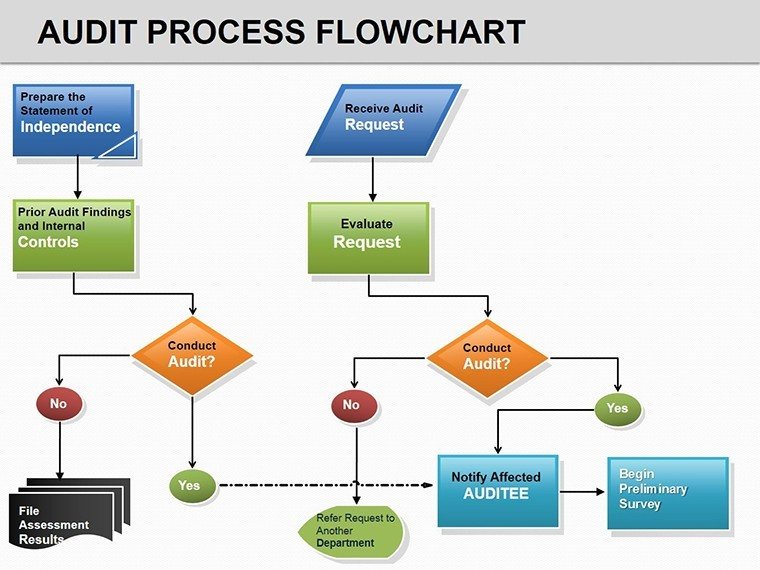
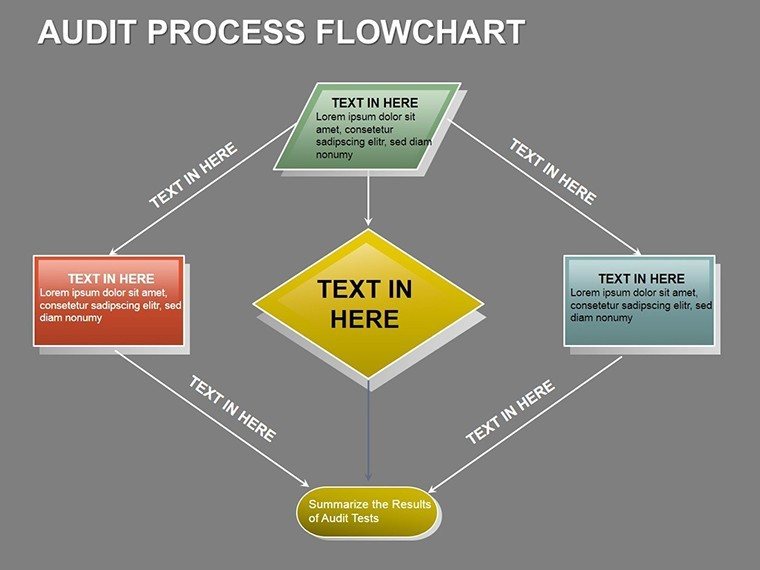
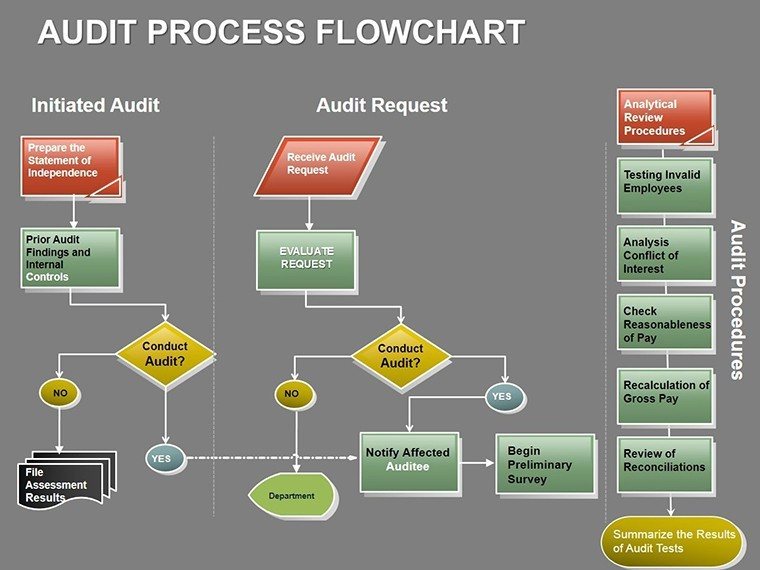
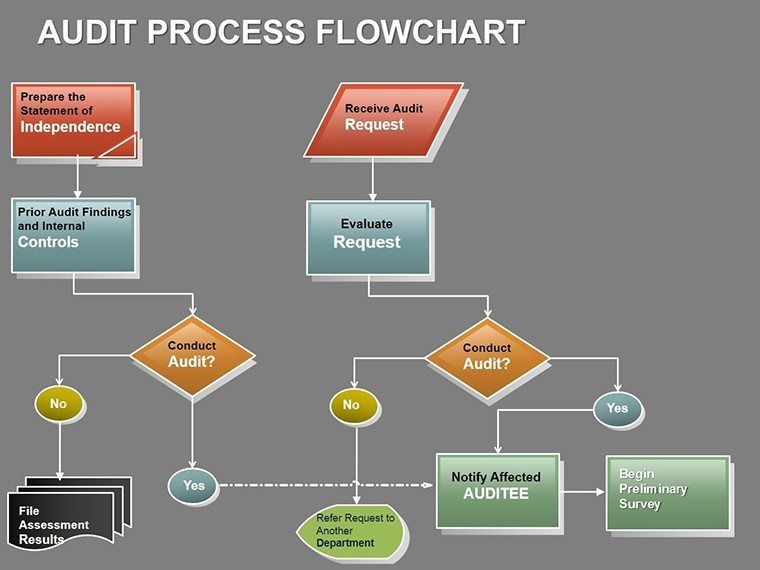
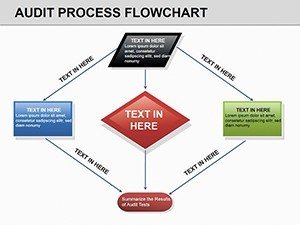
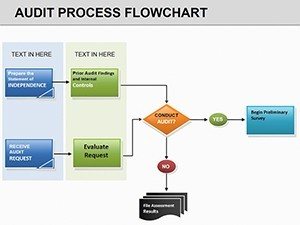
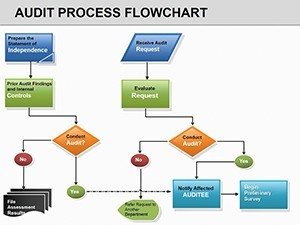
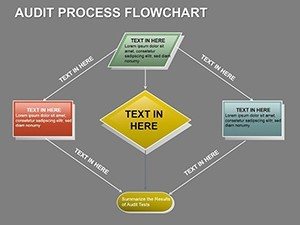
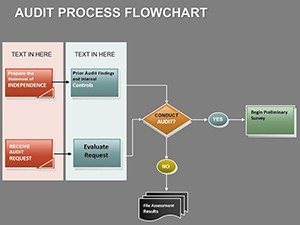
- Planning phase maps: Outline scope, objectives, and risk identification with branched decision trees.
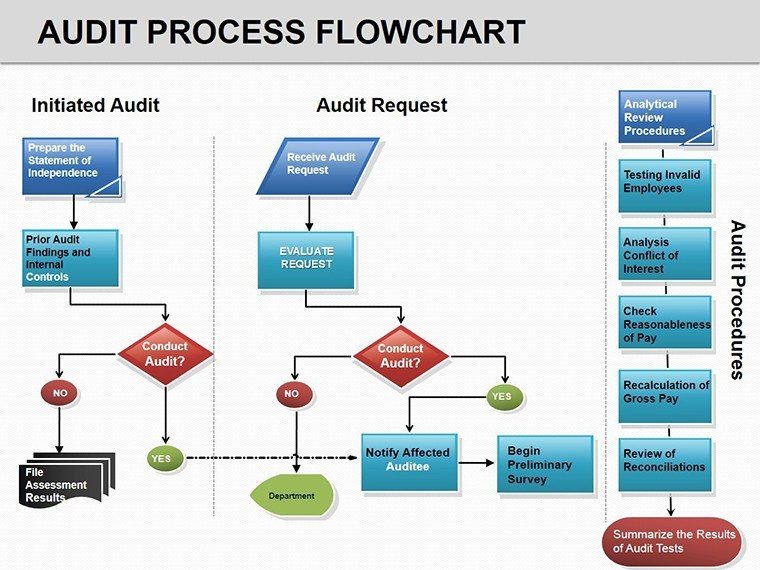
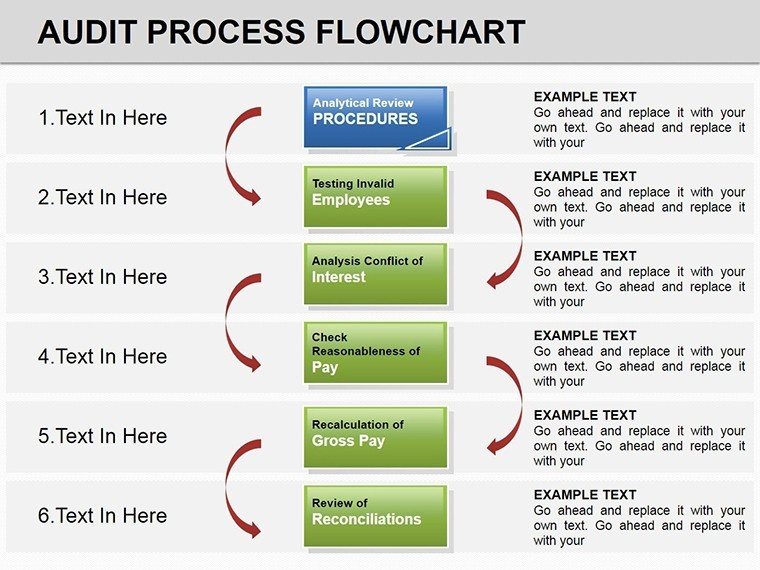
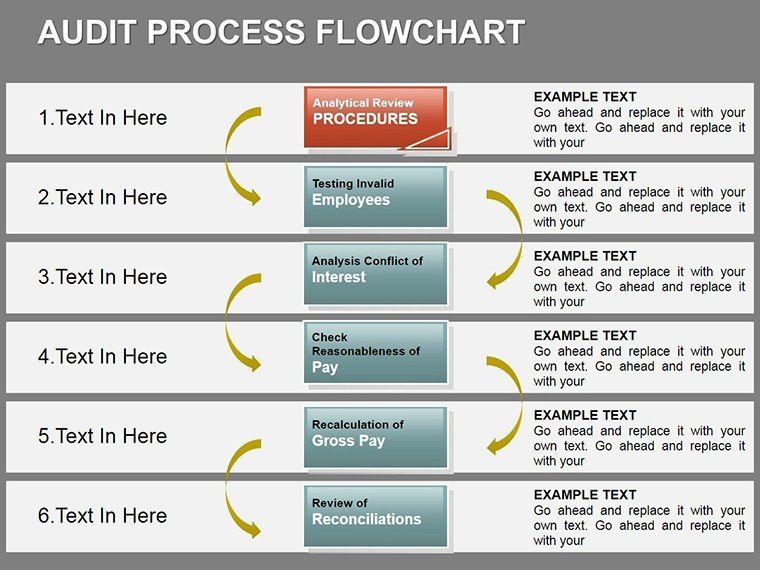
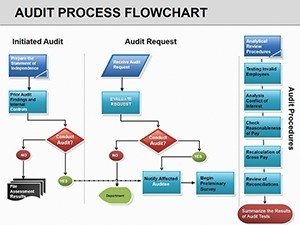
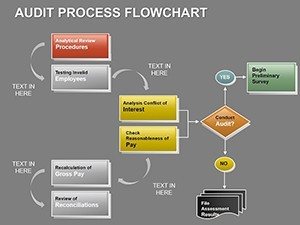
- Fieldwork flowcharts: Step-by-step testing procedures, including sampling and evidence collection paths.
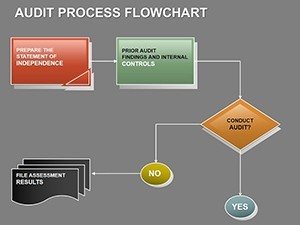
- Risk and control diagrams: Highlight vulnerabilities in red and mitigations in green for immediate visual impact.
- Organizational structures: Swimlane views assigning roles across audit teams and departments.
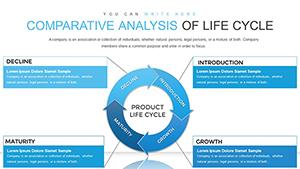
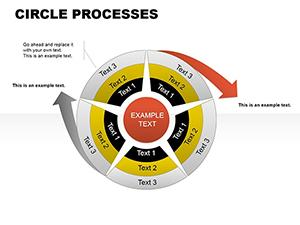
- Reporting cycles: Closed-loop slides showing finding communication and follow-up actions.
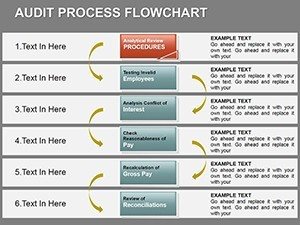
Integrated tables allow direct data insertion for variance analysis, while audit-themed icons reinforce context without clutter.
How Auditors and Consultants Deploy This Template Effectively
In Big Four-style client deliverables, these slides map internal control assessments to accelerate review cycles.
Internal audit teams use them for operational reviews, pinpointing supply chain weaknesses during management presentations.
Compliance officers present regulatory adherence loops to executives, while trainers visualize procedures for new staff orientation.
Government auditors rely on the structured flows for policy enforcement overviews in multi-agency settings.
Incorporating Into Your Audit Presentation Routine
Fully compatible with PowerPoint 2016+, the .pptx format supports collaborative editing via OneDrive.
Customization takes minutes: update text, adjust colors for your firm's branding, or hyperlink to detailed sub-processes.
This integration reduces preparation time significantly, letting you concentrate on analytical depth.
Client Examples Where Audit Flows Made the Difference
For a financial services client, decision trees clarified merger due diligence steps, speeding stakeholder approval.
An IT audit engagement used swimlane diagrams to expose access control gaps in cybersecurity reviews.
Training workshops employed cyclic flows to teach ongoing monitoring protocols.
Executive reports featured risk-coded maps that directly influenced remediation priorities.
Comparison to Conventional Methods
| Element | This Audit Process Flow Template | Standard PowerPoint Shapes | Manual Creation |
|---|---|---|---|
| Standard Alignment | Built-in COSO/IIA elements | None inherent | Requires research |
| Risk Visualization | Color-coded risks/controls | Manual coloring | Inconsistent application |
| Preparation Speed | Ready in minutes | Extended formatting | Significant time investment |
| Professional Depth | Audit-specific icons/tables | Generic tools | Variable expertise needed |
Elevate your audit communications - instantly download this specialized template and deliver with precision.
Tailored Applications Across Audit Domains
Finance professionals map transaction flows to detect anomalies.
Technology auditors diagram IT general controls and application workflows.
Healthcare compliance teams visualize regulatory requirement adherence.
Educational institutions chart grant expenditure oversight processes.
Marketing auditors review campaign expenditure and ROI tracking.
Consulting firms standardize client audit methodology visuals.
Frequently Asked Questions
Does this template include color-coding for risks?
Yes, red highlights risks and potential issues, while green denotes effective controls - easily adjustable to your preferred scheme.
How suitable is it for IT audits?
Highly suitable, with adaptable flowcharts for access controls, change management, and cybersecurity testing sequences.
Can I add hyperlinks to sub-process details?
Absolutely, shapes support hyperlinks to additional slides or external documents for drill-down during presentations.
What frameworks does it align with?
Elements reflect COSO for internal controls and IIA standards, adaptable to IFRS or other relevant guidelines.
Are tables integrated for data analysis?
Yes, embedded editable tables for variance reporting or evidence summaries directly within flowchart slides.
How many slides are dedicated to reporting phases?
Several slides focus on findings communication, recommendations, and follow-up cycles for complete closure.