Average Order Value PowerPoint Template with Editable Charts


Overview
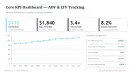
This PowerPoint template delivers 36 editable slides built specifically for Average Order Value (AOV) analysis and reporting. It is designed for sales, e-commerce, marketing, and finance professionals who need clear visual presentation of order value metrics.
Practical Editing Behavior
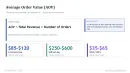
- All charts use editable data points — simply replace the numbers to update the visuals automatically.
- Text placeholders and vector elements allow quick customization of titles, labels, and annotations.
- Multiple chart layouts (bars, lines, columns, dashboards) give flexibility for different presentation needs.
Technical Advantages
- Native PPTX format ensures full compatibility with Microsoft PowerPoint.
- 36 pre-designed slides speed up creation of professional AOV reports.
- Consistent layout structure maintains visual quality across all slides.
- Easy data updates support frequent performance reporting cycles.
| Specification | Details |
|---|---|
| Slide Count | 36 editable slides |
| File Formats | PPTX |
| Editable Elements | Chart data points, text placeholders, vector elements |
FAQs
Can I change the chart data?
Yes. All charts are fully editable in PowerPoint. Update the data directly in the chart editor.
Is this template suitable for e-commerce reporting?
Yes. The slides are optimized for Average Order Value metrics commonly used in e-commerce and sales performance analysis.