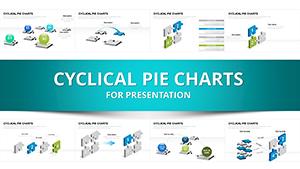
Demand Seasonality PowerPoint Template and Charts


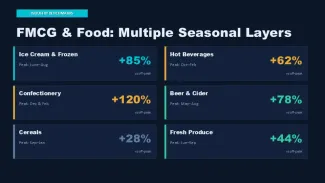
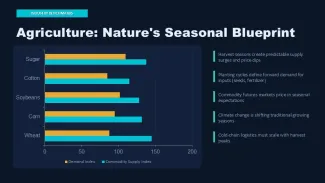


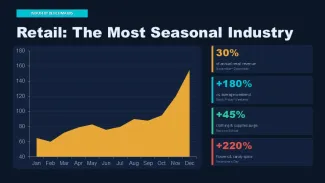


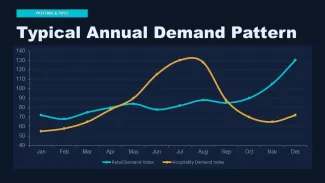
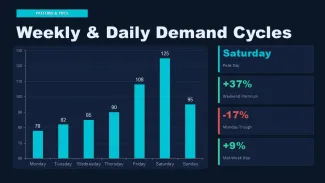


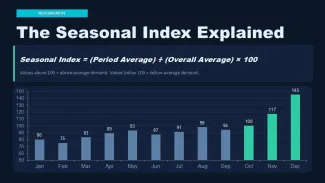
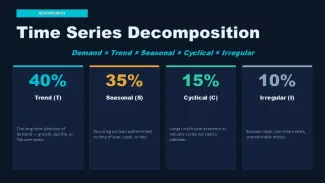


This Demand Seasonality PowerPoint template is designed for analysts and business planners who need to present cyclical sales patterns, inventory forecasts, or marketing campaign performance. The template provides a structured framework for turning raw seasonal data into clear, presentation-ready charts. Instead of building charts from scratch, users can edit the pre-built data series and slide layouts.
Editing behavior is straightforward. Chart data can be updated directly within PowerPoint's worksheet, and all connected slides will reflect the new numbers. Color theming is controlled through the Slide Master; changing the accent color in the master updates all chart series automatically. Grouped elements, such as trend lines and data labels, remain aligned when resizing, preserving the original layout proportions.
- Slide Master Color Controls - Update template colors globally from a single location
- Consistent Layout Grid - All charts align to the same baseline grid for multi-chapter presentations
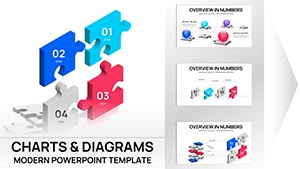
- Editable Vector Graphics - All chart elements are fully resizable without quality loss
- Direct Data Entry - Edit numbers directly in PowerPoint's integrated worksheet
- Print-Ready Format - 16:9 aspect ratio optimized for both screen and printed handouts
| Specification | Details |
|---|---|
| Slide Count | 30 editable slides |
| File Format | .pptx |
| Aspect Ratio | 16:9 (widescreen) |
| Editable Elements | All charts, data series, labels, and text placeholders |
| Color Customization | Slide Master color themes |
| Compatibility | PowerPoint 2016, 2019, 2021, 365 (Windows & macOS) |