Market Share Analysis PowerPoint Charts Template 2026


Type: PowerPoint Charts template
Category: Graphs
Sources Available: .pptx
Product ID: PC01132
Template incl.: 32 editable slides
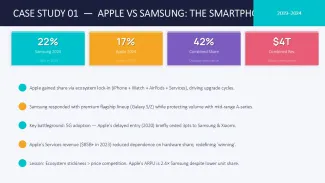
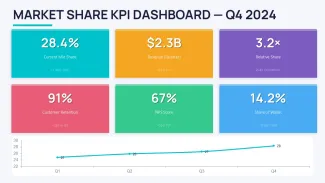
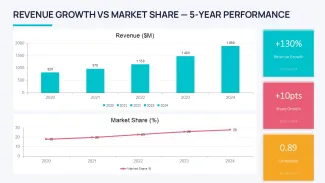
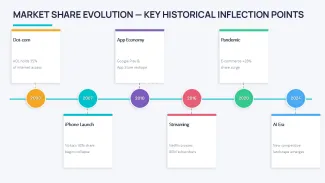
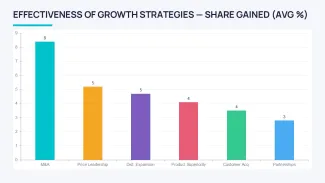
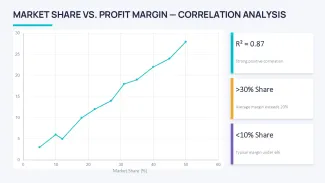
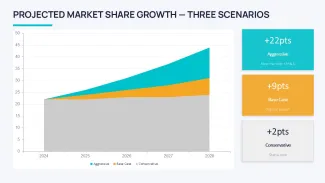
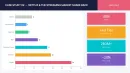
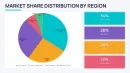
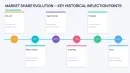
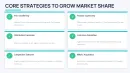
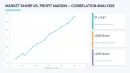
Market share comparison charts that actually show competitive movement over time
The thing about market share charts is they force you to pick sides. You see who gained ground last quarter and who lost it. This collection gives you 32 slides built around that exact need - clustered columns, stacked bars, line overlays, the works. Analysts and strategy leads use them when the executive team wants numbers that tell a story, not just a table.
When I opened templates from this collection for a client quarterly review the column alignment held even after swapping real data sets. That rarely happens with custom builds. Basically the structure already accounts for labels and legends so you don`t spend an hour fixing overlaps.
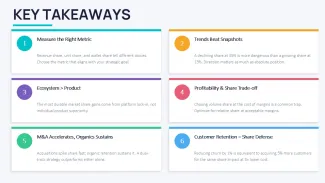
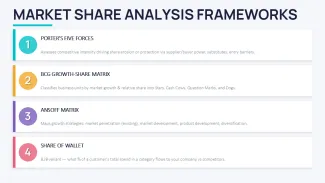
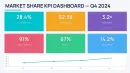
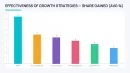
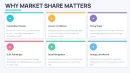
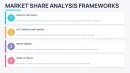
Why market share visuals beat plain tables for competitive updates
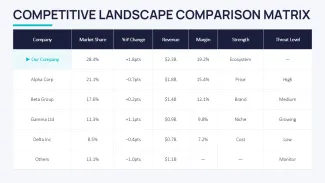
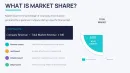
Tables list percentages. Charts show direction. One slide with a stacked bar across four competitors makes the shift obvious in seconds. You know that moment when the deck is due at 9am and the summary slide still looks wrong - this is exactly that fix. Swap data, adjust one color in the master, done.
Honestly the way these handle multiple series is what makes them usable. Add a competitor, the spacing adjusts without breaking the rest of the slide. In practice I`ve seen this save entire review meetings from derailing on formatting questions.
But these aren`t great if you need live Excel links or highly custom calculations. They work best as static presentation assets.
Editing market share PowerPoint charts without destroying alignment
Most people fight the chart editor the first time. Right-click the graph, edit data like in Excel, then tweak colors via the slide master. The templates keep consistent font stack and border render across all 32 slides so you don`t have to reset everything manually. Oh, and the aspect ratio is 16:9 by default.
You can resize individual bars or lines independently in most cases. Just avoid stretching the whole group object too far or labels start to overlap. From experience that`s the main gotcha.
Compared to building from scratch these already solve the decisions on column width, legend position and color contrast. Saves the back-and-forth that usually eats an afternoon.
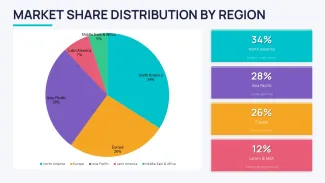
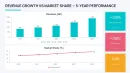
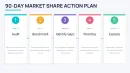
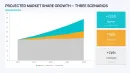
Pick this over generic pie charts when you need to show change across multiple periods or competitors. Pies work for single snapshots. These graphs handle the movement.
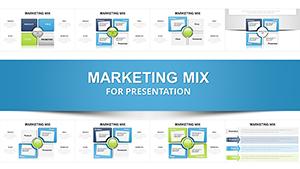
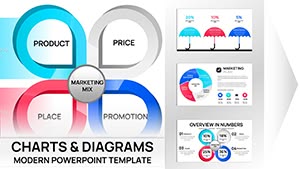
Related: Marketing Mix PowerPoint Charts, Profit Forecast PowerPoint Template, more Graphs templates.If your next board review needs clear competitor positioning, these layouts get the point across fast.
How do I change colors in these market share PowerPoint charts?
So basically go to View > Slide Master. Find the color scheme at the top, pick a new set and it applies across the 32 slides. Individual charts can be overridden by selecting the chart and using the Format tab. First time it looks like a lot but the system is straightforward once you see which master layout controls the main palette. Usually yes, but double-check legend colors after switching.
Can these templates be used for client commercial projects?
Yes, standard commercial license allows use in client work. One purchase covers one end project. You can deliver the final presentation but don`t redistribute the template files themselves. From experience most agencies duplicate the needed slides into their own deck and that keeps everything clean.
What are the differences between free and paid versions?
Paid gives you the full 32 editable slides with all variants and color schemes. Free versions on the site are usually limited to 1-2 sample slides with watermarks or reduced editing flexibility. The paid one includes the complete set ready for immediate use in board or strategy meetings.
What is the refund policy for this market share PowerPoint chart template?
Standard digital download policy applies - refunds are case-by-case if the file doesn`t open or has major issues. Since it`s editable PPTX most people test one slide right after purchase. Contact support with your order details if something doesn`t work as expected.
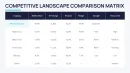
Will adding extra competitors break the market share chart layout?
In most cases no, the clustered and stacked variants handle 4–6 series comfortably. Beyond that readability drops and you should consider splitting into two slides. The column spacing holds pretty well but test with your data first. That`s the practical limit I`ve run into.