3D Volume Cyclic PowerPoint Charts - Editable Slides


Files and Formats Included
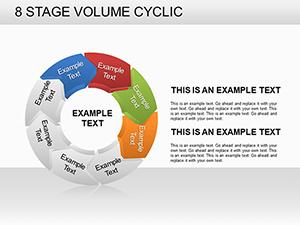
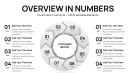
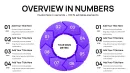
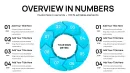
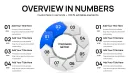
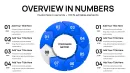
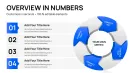
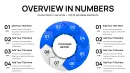
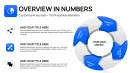
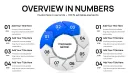
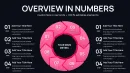
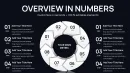
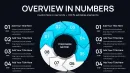
40 slides contain 3D volume cyclic charts built for PowerPoint. Every diagram category supports independent segment editing and the file opens directly in current PowerPoint versions.
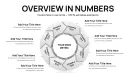
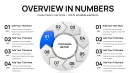
Color contrast between volume layers helps distinguish magnitude while flow direction arrows link phases. The information spacing keeps labels readable even when projected.
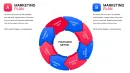
Compared to flat cycle diagrams this set adds volumetric depth that shows quantity changes across stages. Zone fills communicate magnitude without requiring a legend. It suits teams that present cyclic data because the pre-attentive 3D layering lets executives grasp volume relationships before reading any numbers.
What is a PowerPoint diagram template? A PowerPoint diagram template is a pre-built .pptx file with editable charts and graphs that professionals customize in Microsoft PowerPoint for business presentations.
Key Specifications At a Glance
| Feature | Details |
|---|---|
| Slides / diagrams included | 40 editable 3D volume cyclic charts |
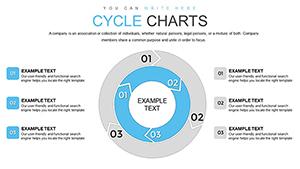
| Diagram categories | cycle stages with volume layers |
| Editable elements | shapes recolor and resize independently |
| Aspect ratio | 16:9 widescreen |
| PowerPoint compatibility | 2016 2019 365 on Windows and Mac |
| Color schemes | theme palette updates globally |
| Animation support | entrance animations optional |
From Download to Final Deck
Open the .pptx file and spend the first two minutes orienting to the slide master structure - this is where all color changes happen globally. The most common mistake is editing individual slide colors directly going through the master saves 15 minutes of repeated work. Once content is in place the export step depends on the destination audience.
State editing difficulty: Moderate.
Real Scenarios
A management consultant reused the same template file across 11 client engagements over 8 months. Each time swap labels adjust color export.
The file stayed consistent across quarterly briefings and investor decks reducing per-session prep from 2 hours to 20 minutes.
Download and start editing immediately
Why This Template Not a Blank Slide
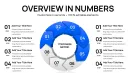
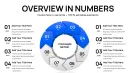
Re-creating 3D volume cyclic charts manually takes three hours and often produces misaligned layers. Volume layering in cyclic diagrams shows magnitude changes across stages that flat versions cannot convey. A level-4 volume reads as visually heavier than a level-2 before the audience reads the label - that pre-attentive encoding matters in live board settings where attention shifts between discussion and slide.
This template eliminates alignment errors and delivers ready visual hierarchy.
Download and start editing immediately
Professionals searching cycle PowerPoint chart templates frequently pair this deck with stage volume cyclic charts for deeper phase analysis or rings connection charts when they need both linear and circular data in one sales presentation.
Which PowerPoint version works with this template?
PowerPoint 2016 2019 or Microsoft 365 on Windows and Mac opens all 40 slides without error. The 3D volume effects render correctly in these versions and diagram connectors stay fully adjustable.
How do I change the color scheme?
Edit the slide master theme colors once and every volume layer updates across the entire deck. Individual shape overrides remain available through the Format Shape pane for targeted adjustments.
What does the license allow?
The license covers internal reporting and external client proposals. You can embed the charts in your decks and present them to paying customers while keeping the original file private.
What is included in the paid versus free version?
The paid version includes all 40 editable slides and full 3D volume elements. Any free preview supplies only static images or limited slides without edit capability.
What is the refund policy?
Request a refund within 30 days if the 3D effects do not render in your PowerPoint version or the cyclic layout does not fit your data. The process requires no explanation beyond confirming the file was not shared.
How do I update chart data?
Select any volume segment right-click Edit Data and replace values. The 3D rendering refreshes automatically preserving your color theme adjustments and layer order.