Flow Funnel PowerPoint Charts - 38 Professional Slides | Fully Editable Process Templates

Type: PowerPoint Charts template
Category: Flow
Sources Available: .pptx
Product ID: PC01112
Template incl.: 38 editable slides
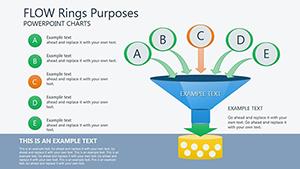
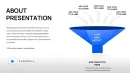
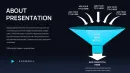
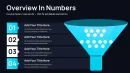
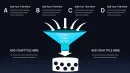
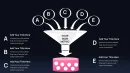
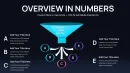
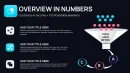
Presenting multi-stage processes to leadership demands visual clarity that traditional bullet points cannot provide. This flow funnel PowerPoint charts template includes 38 professionally designed slides that transform complex workflows, sales pipelines, and customer journeys into compelling visual narratives executives grasp immediately.
During quarterly business reviews, I've watched teams struggle to explain conversion metrics until they switched to funnel visualizations. Suddenly, the conversation shifted from "what are the numbers" to "why is this stage underperforming" - exactly where executive attention should focus.
Why Flow Funnels Outperform Standard Charts
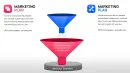
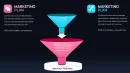
Sales directors use funnel charts to report pipeline health, showing lead progression from initial contact through closed revenue. Marketing teams map multi-channel customer journeys across awareness, consideration, and decision stages. Operations managers diagram production workflows to identify bottlenecks draining efficiency.
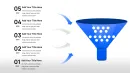
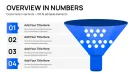
The funnel metaphor is universally understood: volume enters at the top, filters through qualifying stages, and emerges refined at the bottom. This visual language works whether you're explaining venture capital fundraising stages, employee recruitment processes, or product development gates. With 38 slides, you have configurations for every scenario.
Complete Slide Library for Every Process Type
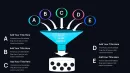
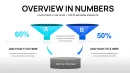
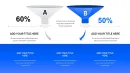
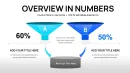
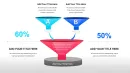
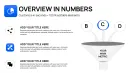
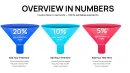
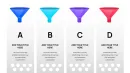
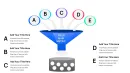
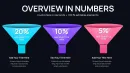
The template covers simple 3-stage funnels for executive summaries, detailed 6-stage versions for comprehensive pipeline analysis, horizontal timeline funnels for project tracking, and comparative multi-funnel layouts for A/B testing results. Specialized slides include funnel-to-metrics dashboards, stage-specific drill-downs, and integrated conversion rate calculators.
Vector graphics maintain perfect clarity whether projected in boardrooms or viewed on mobile devices during virtual meetings. Every element - rings, labels, connectors, data callouts - is fully ungrouped for granular customization. Swap colors to match brand guidelines, adjust proportions to reflect actual conversion rates, or combine multiple funnels to compare segments.
Real-World Applications Across Business Functions
In board presentations, CEOs use comprehensive funnels to demonstrate growth strategy execution, showing how market opportunities funnel down to revenue realization. CFOs present budget allocation funnels that track capital from annual planning through departmental deployment to project execution.
Product teams illustrate feature adoption funnels, revealing where users engage versus where they churn. HR departments track hiring funnels from job posting through offer acceptance, identifying stages where candidate quality deteriorates or process delays occur. The visual immediately highlights which stage needs process improvement investment.
Customization Workflow for Professional Results
Select the funnel configuration matching your process complexity - simple overview funnels for executive audiences, detailed multi-stage versions for operational reviews. Click text boxes to update stage labels with your terminology: "Qualification," "Proposal," "Negotiation," or whatever framework your organization uses.
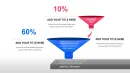
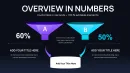
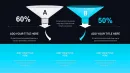
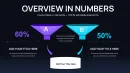
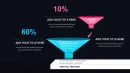
Input your actual metrics directly into pre-formatted data fields. The template accommodates percentages, absolute numbers, dollar values, or time durations. Apply your brand colors by selecting funnel segments and choosing from PowerPoint's color picker. Duplicate stages to extend the funnel or remove rings to simplify, depending on process depth.
Strategic Funnel Type Selection Guide
| Funnel Configuration | Optimal Use Case | Target Audience |
|---|---|---|
| Simple 3-Stage | High-level pipeline status, executive briefings | C-suite, board members, investors |
| Detailed 6-Stage | Comprehensive process analysis, operational reviews | Department heads, process owners |
| Horizontal Timeline | Time-dependent workflows, project phases | Project managers, operations teams |
| Multi-Funnel Comparison | Segment performance, A/B testing, regional comparison | Strategy teams, marketing analysts |
| Integrated Dashboard | Funnel metrics with supporting KPIs | Executive leadership, performance reviews |
Industry-Specific Implementation Examples
SaaS companies track user activation funnels from signup through core feature adoption, identifying friction points that prevent trial-to-paid conversion. Financial services firms map client onboarding journeys from initial consultation through account funding and first transaction.
Healthcare organizations visualize patient care pathways, showing progression from emergency admission through diagnosis, treatment, and discharge. Manufacturing operations illustrate quality control funnels where raw materials filter through inspection gates to finished goods.
B2B technology vendors present sales cycle funnels to investors, demonstrating predictable revenue generation as enterprise leads progress through lengthy evaluation processes. Consulting firms use engagement funnels to show how initial scoping conversations develop into multi-year client relationships.
Advanced Features for Complex Processes
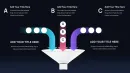
Several slides include branching funnels that show alternative pathways - useful when different customer segments follow distinct journeys or when decision trees create multiple outcome scenarios. Reverse funnels illustrate expansion processes like customer referrals or product line extensions where volume increases at each stage.
Layered funnel slides allow simultaneous display of multiple time periods, making year-over-year comparisons immediately visible. Annotated versions include callout boxes for stage-specific metrics, conversion triggers, or improvement initiatives currently in flight.
Stakeholder Communication Benefits
Investors appreciate funnel charts because they demonstrate process maturity and predictable outcomes - critical factors in valuation discussions. Leadership teams use funnels to align cross-functional resources, showing exactly which stage needs marketing support, sales enablement, or operational capacity.
During strategy sessions, funnels facilitate data-driven debate about where to invest improvement resources. The visual makes it obvious whether problems stem from top-of-funnel volume issues or mid-funnel conversion inefficiencies, driving more focused solutions.
Start Creating Compelling Process Presentations
Transform your process data into executive-ready presentations. Download this 38-slide flow funnel template and deliver insights that drive strategic decisions.
Frequently Asked Questions
How do I choose between the 14-slide and 38-slide funnel templates?
The 38-slide version provides comprehensive coverage for organizations managing multiple process types or requiring specialized funnel configurations like comparative analysis, branching pathways, or integrated dashboards. Choose this if you regularly present to diverse audiences requiring different levels of detail. The 14-slide version works well for teams focused on a single primary process who need essential configurations without extensive variety.
Can I animate the funnel to reveal stages progressively?
Yes, all funnel elements are separate objects you can animate individually. Use PowerPoint's animation pane to set entrance effects for each stage, revealing the funnel from top to bottom. This works particularly well when walking executives through each stage's performance before showing the complete picture. Apply subtle fade or wipe effects rather than flashy animations for professional presentations.
What metrics should I display at each funnel stage?
Include volume or count entering each stage, conversion rate to the next stage, and time spent in that stage if relevant. For sales funnels, add deal value and average deal size. For marketing funnels, show cost per conversion and channel attribution. Always highlight variance from target or benchmark - executives want to know immediately whether performance meets expectations.
How should I handle funnels with inconsistent stage widths?
Adjust each stage's width proportionally to actual volume or conversion rates for data accuracy. If one stage shows unusually high drop-off, the narrow width visually emphasizes the problem, driving focus to that bottleneck. Alternatively, maintain uniform widths for aesthetic consistency and use percentage labels to convey actual conversion rates - this works better when stage-to-stage variations are extreme.
Do these templates work for non-commercial processes?
Absolutely. Academic institutions use funnels to track student progression from application through graduation. Non-profits visualize donor engagement from first contact through recurring contribution. Government agencies map citizen service delivery from request through resolution. Any multi-stage process where volume changes between stages benefits from funnel visualization.
Can I integrate these funnels with live data sources?
PowerPoint does not support direct database connections for chart updates. However, you can link text boxes to Excel cells containing your metrics, so updating the Excel file refreshes funnel numbers automatically. For truly dynamic dashboards with real-time data, consider exporting your funnel designs to business intelligence tools like Tableau or Power BI after establishing the visual framework in PowerPoint.