Finish Line PowerPoint Charts - 41 Premium Slides for Project Tracking


Type: PowerPoint Charts template
Category: Relationship, 3D
Sources Available: .pptx
Product ID: PC01109
Template incl.: 41 editable slides
Senior executives reviewing project portfolios need comprehensive visualization tools that go beyond basic progress bars. This premium finish line PowerPoint chart template delivers 41 professionally designed slides specifically for milestone tracking, multi - phase project reporting, and goal achievement presentations in board meetings, investor pitches, and strategic planning sessions.
Why Choose the 41 - Slide Premium Version
This expanded template provides nearly double the slide options compared to standard finish line chart sets, giving you complete flexibility for complex project presentations. When I'm preparing quarterly board decks or annual strategic reviews, I need variety: different chart styles for different data types, multiple layout options for varying audience sizes, and backup slides for detailed questions. This template delivers all of that.
The additional 17 slides include: advanced multi - project tracking layouts, detailed dependency chain visualizations, comparative analysis charts for portfolio performance, team contribution breakdowns with individual milestone markers, risk assessment timelines showing potential delays, and celebration slides for completed initiatives. Use this version when presenting to boards of directors who expect comprehensive analysis, when managing large - scale transformation programs with 10+ concurrent workstreams, or when investor presentations require detailed proof of execution capability.
Complete Slide Inventory: 41 Layouts Explained
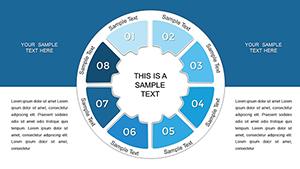
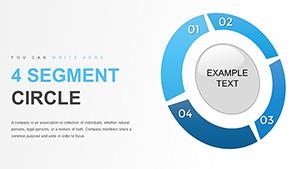
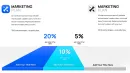
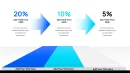
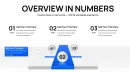
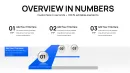
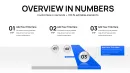
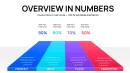
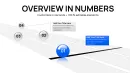
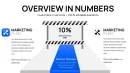
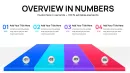
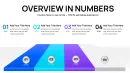
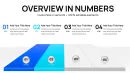
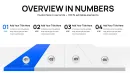
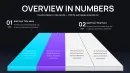
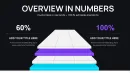
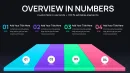
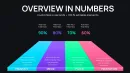
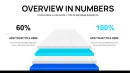
Executive Summary Section (Slides 1 - 8): Title slides, high - level dashboard views, portfolio overview charts, and executive briefing layouts. Slide 5 offers a quadrant view showing four major initiatives simultaneously - I use this in CEO updates to show enterprise - wide progress at a glance.
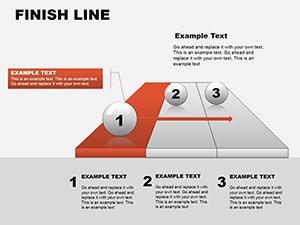
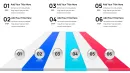
Detailed Project Tracking (Slides 9 - 25): The core of this template includes single - project timelines, multi - phase trackers, milestone markers with date annotations, dependency chains, critical path visualizations, and progress bars with percentage completion. Slide 17 features a vertical timeline format that works particularly well in printed reports where horizontal space is limited. Slide 22 includes a curved path design that metaphorically shows the non - linear nature of complex projects - useful when explaining scope changes or pivots to stakeholders.
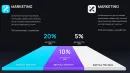
Comparative Analysis Charts (Slides 26 - 33): Portfolio comparison layouts, target vs. actual performance charts, year - over - year progress comparisons, and competitive positioning visuals. Slide 29 displays up to 6 concurrent projects side - by - side - essential for portfolio management offices tracking numerous initiatives. These slides help CFOs understand resource allocation efficiency across the portfolio.
Team & Contribution Views (Slides 34 - 41): Department - specific progress charts, individual contributor milestone tracking, cross - functional collaboration visualizations, and achievement celebration slides. Slide 38 breaks down a single finish line into team contributions, showing how engineering, marketing, and sales each played their part in reaching the goal. Use these slides in all - hands meetings to recognize team efforts and demonstrate shared ownership of outcomes.
Advanced Editing Workflow for Complex Presentations
For multi - section presentations, create a master outline first: Section 1 (Portfolio Overview) uses slides 1 - 8, Section 2 (Deep Dive Projects) uses slides 9 - 25 selecting 3 - 4 most relevant, Section 3 (Performance Analysis) pulls from slides 26 - 33, and Section 4 (Team Recognition) uses slides 34 - 41. Delete unused slides to keep the deck focused - board members appreciate conciseness.
Advanced customization: link charts to Excel data using PowerPoint's "Paste Special > Paste Link" feature. Update your source Excel file with current milestone dates and completion percentages, then refresh links in PowerPoint to automatically update all charts. This is particularly valuable for weekly leadership team meetings where project status changes frequently. To set up: create an Excel table with columns for Project Name, Start Date, End Date, and Completion Percentage, then copy and paste link into the appropriate chart text boxes.
For presentations requiring drill - down capability, use PowerPoint's hyperlink features. Make your overview chart on slide 4 clickable: select a project bar, click Insert > Link, choose "Place in This Document," and link to the detailed slide covering that specific project. During Q&A sessions, executives can ask about specific initiatives, and you can jump directly to detailed views without scrolling through the entire deck.
Strategic Presentation Scenarios
Annual Board Meeting - Enterprise Transformation Update: You're presenting a three - year digital transformation initiative to the board. Open with slide 3 showing the overall transformation journey from year 1 through year 3. Use slides 11 - 15 to detail year 2 initiatives currently in flight: cloud migration, ERP implementation, customer portal launch, and data governance program. Pull up slide 29 to compare planned vs. actual timelines across all four workstreams, explaining where you're ahead and where delays occurred. Close with slide 40 celebrating completed year 1 milestones to reinforce execution capability before discussing year 3 funding needs.
Investor Due Diligence - Operational Readiness Presentation: During Series B fundraising, investors want evidence you can scale. Use slide 6 to show your product roadmap with clearly defined launch milestones over the next 18 months. Slides 18 - 20 demonstrate manufacturing capacity expansion, go - to - market strategy rollout, and team hiring milestones. The finish line visual demonstrates that you're not just planning growth - you're methodically executing toward defined objectives with measurable progress markers. This builds investor confidence that their capital will be deployed systematically, not chaotically.
PMO Portfolio Review - Resource Allocation Planning: As PMO director, you're presenting portfolio health to the CIO. Slide 7 displays all active projects color - coded by status: green for on - track, yellow for at - risk, red for delayed. Dive into slide 29 comparing resource burn rates across projects, helping the CIO decide where to reallocate staff or budget. Use slide 33 to show which initiatives are approaching their finish lines this quarter (requiring QA resources) versus which are just starting (requiring architecture resources). This data - driven view helps leadership make objective resource decisions rather than relying on the loudest project manager.
Template Application Matrix: Matching Slides to Objectives
| Presentation Objective | Recommended Slides | Customization Priority | Expected Outcome |
|---|---|---|---|
| Board - level portfolio overview | Slides 1 - 8, plus 29 for comparisons | Update project names, completion % | Board approves resource allocation |
| Investor fundraising pitch | Slides 6, 18 - 20, 40 (achievements) | Highlight completed milestones | Demonstrate execution capability |
| Project deep - dive review | Slides 9 - 25 (select 5 - 7 relevant) | Add specific task dependencies | Stakeholder alignment on risks |
| Team all - hands celebration | Slides 34 - 41 (contributor views) | Add team member names/photos | Boost morale, show impact |
| Weekly leadership sync | Slides 10, 17, 22 (core trackers) | Link to live Excel data | Quick status alignment, no prep |
Industry - Specific Applications
Enterprise Software Implementation: IT directors use this template to show ERP or CRM implementation progress across modules: procurement module live, finance module in UAT, HR module in development. The expanded slide count allows visualization of parallel implementation tracks across global regions.
Pharmaceutical Clinical Trials: Clinical operations managers track drug development from preclinical through Phase III trials, showing regulators and executives exactly where each study stands relative to FDA submission deadlines. The detailed milestone slides accommodate the complex, multi - year timelines inherent in drug development.
Construction & Infrastructure: Program managers visualize massive infrastructure projects spanning 5 - 10 years, from environmental impact studies through design, permitting, construction, and commissioning. The 41 - slide variety allows separate tracks for civil work, electrical systems, and mechanical systems all converging at project completion.
Merger Integration: M&A integration leads track post - acquisition milestones: systems integration, cultural alignment programs, customer communication campaigns, and financial consolidation. The comparative slides help acquired company leadership see how integration milestones align with parent company timelines.
Government & Defense Programs: Program managers in defense contracting visualize multi - phase weapon system development, showing oversight committees progress from concept development through production to deployment, with detailed milestone tracking required for contract compliance reporting.
This premium 41 - slide template serves teams managing large - scale, complex initiatives requiring comprehensive stakeholder communication. Download now and build your next executive presentation.
Frequently Asked Questions
What's the difference between this 41 - slide version and the 24 - slide version?
The 41 - slide premium version includes 17 additional layouts focused on portfolio management, comparative analysis, and team contribution visualization. Choose the 24 - slide version for single - project presentations or departmental updates. Choose this 41 - slide version for enterprise - wide reporting, board presentations covering multiple initiatives, or investor pitches requiring comprehensive milestone documentation. The expanded version also includes more design variations within each category, giving you layout flexibility based on data density and audience preferences.
Can I link these charts directly to project management software like Jira or Asana?
PowerPoint doesn't support direct API connections to project management tools, but you can create a data bridge using Excel. Export milestone data from Jira or Asana to Excel, then use PowerPoint's "Paste Link" feature to connect chart text boxes to specific Excel cells. When you update your Excel file with fresh export data, refresh links in PowerPoint to update all charts. I run this process every Monday morning for weekly leadership meetings - takes about 10 minutes to export from Jira, refresh Excel, and update the PowerPoint deck. This semi - automated approach balances data accuracy with time investment.
How do I present 41 slides without losing executive attention?
You don't present all 41 slides - you curate. For a 30 - minute board presentation, I typically use 12 - 15 slides from this template: 3 overview slides, 6 - 8 detailed project slides, 2 comparative analysis slides, and 1 - 2 celebration/achievement slides. The remaining slides serve as backup for Q&A. Use PowerPoint's "Hide Slide" feature (right - click > Hide Slide) to keep backup content in the file without cluttering your presentation flow. During Q&A, if the CFO asks about a specific project's timeline, you can unhide and jump to that detailed slide. The 41 - slide count gives you options, not an obligation to present everything.
Does this template support multiple currency formats for budget tracking?
The template uses placeholder text boxes that accept any currency format you enter. When adding budget or cost data to milestone charts, simply type your currency symbol and amount ($500K, €750K, ¥1.2M). For multinational presentations, I create a legend slide showing exchange rates and present all figures in a single base currency (usually USD or EUR) to avoid confusion. If you need dynamic currency conversion, link text boxes to Excel cells containing currency formulas, then use the "Paste Link" method described earlier. This approach works well for global PMO reports where stakeholders in different regions need to see costs in their local currency.
Can I use sections of this template in other presentations without downloading the entire file each time?
Yes, create a personal slide library. Open this template and save individual slides or slide groups as separate .pptx files organized by category: "Overview Slides.pptx," "Project Detail Slides.pptx," "Portfolio Comparison Slides.pptx." When building new presentations, use PowerPoint's "Reuse Slides" feature (Home > New Slide > Reuse Slides) to import specific layouts from your library. I maintain a "Master Charts Library" folder with templates from various sources organized this way. For recurring presentations like monthly board meetings, save a pre - populated version as your template with your branding, typical projects, and standard sections - then you're always 5 minutes from a fresh update.
What resolution and aspect ratio should I use for large conference room displays?
The template works in both 16:9 widescreen (standard) and 4:3 formats. For modern conference rooms with widescreen displays, keep the 16:9 ratio - it fills the screen without letterboxing. To check or change aspect ratio: Design tab > Slide Size > Standard (4:3) or Widescreen (16:9). Test your presentation on the actual display before critical board meetings. I learned this the hard way when small text I could read on my laptop became illegible on a 90 - inch boardroom display 20 feet away. Use minimum 18pt font for body text and 28pt for headings. For charts with dense data, consider creating two versions: a detailed version for printed handouts and a simplified version with larger elements for screen projection.