Doughnut PowerPoint Charts Template - Editable Data Slides for Presentations


Present complex proportions and relationships with clarity and impact using the Doughnut PowerPoint Charts Template - a 34-slide editable PPTX designed for professionals who build decks weekly for board meetings, investor updates, strategy reviews, and operational reporting. Standard PowerPoint pie charts often leave audiences guessing at values or miss opportunities to tell a story with data; this template solves that by converting numbers into elegant doughnut visuals that convey context instantly and convincingly.
Every slide is crafted to help you explain "what changed," "how big it is," and "why it matters" - not just show percentages. You`ll arrive at meetings with visuals ready for discussion, not excuses for sloppy charts.
Template Breakdown & Slide Features
This template includes 34 editable doughnut chart slides built for real business needs:
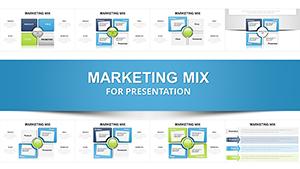
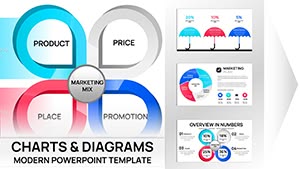
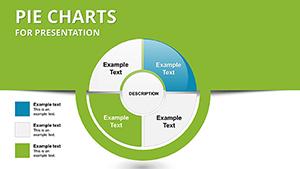
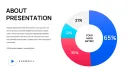
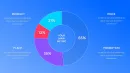
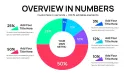
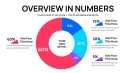
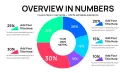
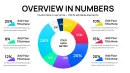
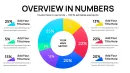
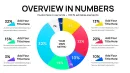
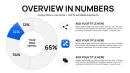
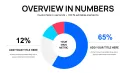
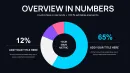
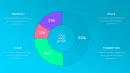
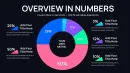
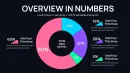
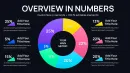
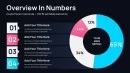
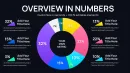
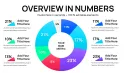
- Core proportion charts with clean legends and callouts for clear percentage communication.
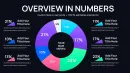
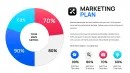
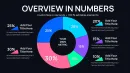
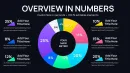
- Nested doughnuts for comparing related metrics (e.g., total vs segment performance).
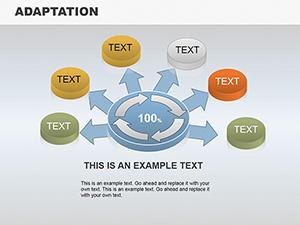
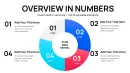
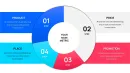
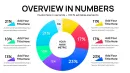
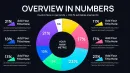
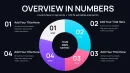
- Process-oriented doughnuts that frame stages or cyclical workflows around a central theme.
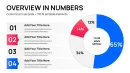
- Label-first layouts for executive presentations where numbers must register immediately.
All slides are fully editable in PowerPoint - change colors, fonts, labels, and data without breaking layouts.
Professional Use Cases
Use this template when you need to:
- Break down budget allocations by department or initiative for quarterly or annual reports.
- Show market share and segment performance in investor pitches or competitive reviews.
- Visualize survey results and key metrics quickly for strategic planning sessions.
- Present process and cycle data where each part contributes to a whole.
Workflow Integration (PowerPoint & More)
The Doughnut PowerPoint Charts Template is built in PPTX format for compatibility with:
- Microsoft PowerPoint (2016 and newer) - place slides into your deck and update data in seconds using built-in chart editing.
- Google Slides - import the PPTX file and retain structure; adjust colors and text as needed.
- Keynote - open the PPTX directly and fine-tune visuals to suit Apple presentations.
This means you can prepare once and reuse slides across platforms and teams.
Real-World Presentation Scenarios
Imagine you`re in a board review and need to answer these questions within minutes:
- What portion of our revenue came from new products? Swap in data and your doughnut chart speaks immediately.
- Which operational costs contribute most to budget variance? A nested chart highlights layers of impact without clutter.
- How did last quarter compare with this one? Two side-by-side doughnuts make that comparison unmistakable.
Internal Slide Types & Outcomes
| Slide Category | Best For | Outcome |
|---|---|---|
| Single Doughnut Overview | Quick metric summaries | Instant audience comprehension |
| Nested Doughnuts | Comparative analysis | Contextual insight |
| Process-centric Layouts | Workflow explanation | Clear narratives |
Industry Applications
This template is ideal across industries:
- Finance & Accounting: Expense breakdowns and portfolio distribution.
- Marketing & Sales: Channel share and campaign segmentation.
- Consulting: Client insights and performance summaries.
- Education & Research: Study results and cohort comparisons.
Frequently Asked Questions
When should I use this doughnut chart template?
Use it when you need to visualize proportions, segment comparisons, or cyclical frameworks where audience clarity and professional polish matter.
Can I edit the chart data directly in PowerPoint?
Yes. After inserting a slide into your deck, open the chart`s embedded data table and update values - the visual updates automatically.
Will these slides work in Google Slides and Keynote?
Yes. Import the PPTX into Google Slides or open in Keynote; layouts remain editable, though chart behavior follows each platform`s native tools.