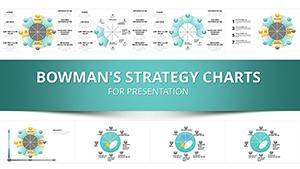
Bowman's Strategy Clock Charts Template for PowerPoint - 40 editable slides


Type: PowerPoint Charts template
Category: Cycle, Business Models, Pie
Sources Available: .pptx
Product ID: PC01088
Template incl.: 40 editable slides
As a senior presentation designer who's crafted decks for Fortune 500 boardrooms and startup pitches alike, I know the frustration of staring at blank slides when dissecting market competition. This Bowman's Strategy Clock PowerPoint template changes that game entirely, offering 40 editable infographic slides that map out strategic positions with precision and visual punch. It's built for professionals who need to convey complex competitive dynamics quickly, saving hours of custom design work while delivering C-level polish.
Imagine walking into a quarterly review armed with visuals that instantly clarify low-price tactics versus premium differentiation - that's the power here. Drawing from my weekly consulting gigs, this template has proven invaluable for turning abstract strategy theory into actionable insights. Whether you're advising executives on market shifts or training teams on positioning, it elevates your delivery without the usual hassle.
What sets this apart is its focus on infographic-driven clarity, ensuring even dense data feels approachable. I've used similar structures to help clients in retail pivot strategies, and the results speak volumes in engagement and understanding.
Detailed Breakdown of Key Template Components
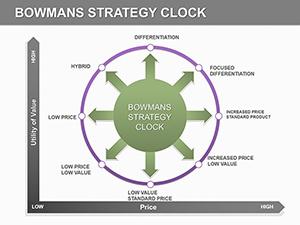
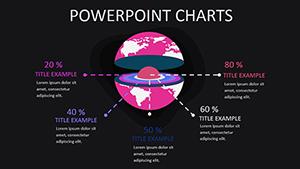
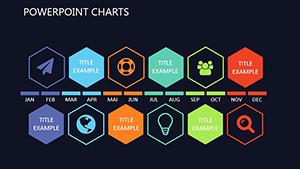
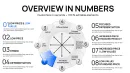
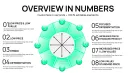
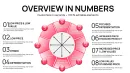
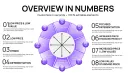
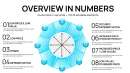
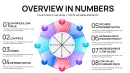
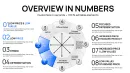
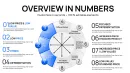
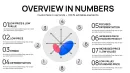
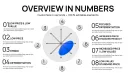
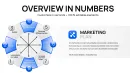
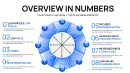
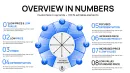
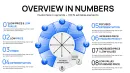
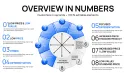
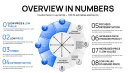
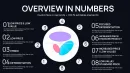
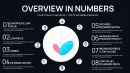
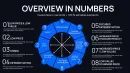
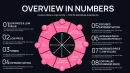
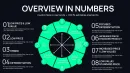
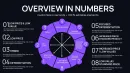
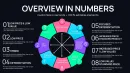
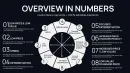
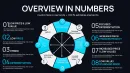
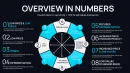
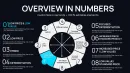
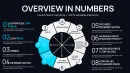
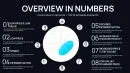
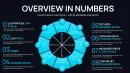
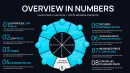
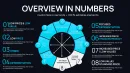
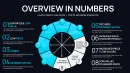
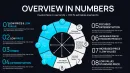
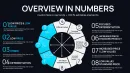
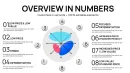
This template centers on the classic eight-position clock model, but with infographic enhancements that make each segment pop. The core slide features a central clock diagram where positions like low price/low value or focused differentiation are highlighted with icons and color-coded zones for immediate recognition.
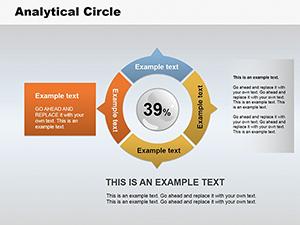
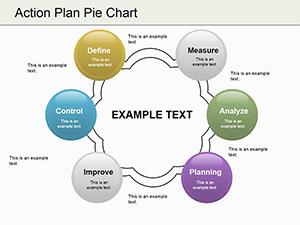
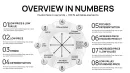
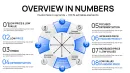
Supporting slides dive deeper: one set allows plotting your company's position with draggable elements, while others provide breakdown charts for perceived value versus price axes. Data placeholders are pre-formatted for quick input, like inserting sales figures or competitor benchmarks directly into bar graphs embedded in each segment.
Customization is straightforward - adjust color palettes to match brand guidelines, swap icons for industry-specific ones, or expand text boxes for detailed explanations. In my experience, these features let you tailor the deck to specific scenarios, like analyzing e-commerce rivals, without rebuilding from scratch.
Professional Applications in Daily Workflows
In board meetings, I've deployed this template to outline competitive landscapes for product launches, using the clock to spotlight risks in overcrowded low-cost segments. It facilitates discussions on shifting to hybrid models, backed by visual data that keeps executives focused.
For educators in business workshops, the infographic slides serve as interactive tools, allowing participants to map real-time examples like grocery chains versus luxury brands. This hands-on approach has boosted retention in my training sessions for government agencies.
Consultants rely on it for client strategy sessions, where plotting positions reveals untapped opportunities, such as moving from standard differentiation to focused niches in manufacturing.
Seamless Integration into Your Presentation Process
This template slots effortlessly into standard workflows: download the .pptx file, open in PowerPoint 2016 or later, and start editing. It's also compatible with Keynote and Google Slides, ideal for collaborative teams across platforms.
Time savings are real - what used to take days in custom charting now happens in hours, freeing you for content refinement. One-time license means lifetime access, with no recurring fees.
Start by importing your data via linked Excel sheets, then tweak animations for sequential reveals that build suspense in pitches.
Actual Scenarios from Client Engagements
In a recent consultant project for a retail chain, we used the clock to visualize shifting from low-added-value positions to differentiation, incorporating sales data that convinced stakeholders to invest in branding.
Managers in enterprise teams apply it for project reviews, mapping vendor positions to negotiate better terms based on value perception.
Educators incorporate it into course materials, using editable segments to illustrate case studies from automotive industries.
Founders leverage it in investor decks, highlighting market gaps with infographics that secure funding rounds.
Analysts use the template for insights presentations, plotting quarterly trends to recommend strategic adjustments in logistics.
Template Advantages Over Alternatives
| Aspect | This Template | Default PowerPoint | From Scratch | Other Solutions |
|---|---|---|---|---|
| Slide Count | 40 Editable Infographics | Basic Charts Only | Build as Needed | Limited Variations |
| Customization | Full Color/Icon Edits | Limited Options | Total Flexibility but Time-Intensive | Partial Edits |
| Time Savings | Hours Saved | Standard Setup | Days Required | Moderate Savings |
| Visual Impact | High-Engagement Infographics | Generic Looks | Depends on Skill | Varies by Provider |
Industry-Specific Deployments
Finance pros use it for investment presentations, mapping fund strategies against market clocks to highlight returns.
Tech firms apply the template in product launches, positioning software solutions in differentiation segments.
Healthcare teams visualize research findings, using segments to compare treatment options on value scales.
In education, it structures academic lectures on business models, with infographics aiding student comprehension.
Marketing departments dissect campaign results, plotting ad strategies to optimize future spends.
Consulting reports gain depth by incorporating clock analyses for client deliverables in supply chain.
Download this template to streamline your strategic visuals right away.
Frequently Asked Questions
How do I customize the infographic elements in this template?
Simply select the icons or segments, then use PowerPoint's editing tools to change colors, sizes, or replace with your own assets. It's designed for quick tweaks, ensuring brand alignment in under 10 minutes for most users.
Is this compatible with older versions of Keynote?
Yes, it works seamlessly with Keynote 2016 and later, as well as Google Slides, allowing cross-platform collaboration without loss of functionality.
What data types fit best into the clock positions?
Competitor pricing, perceived value metrics, and market share data integrate easily via pre-set placeholders, making it ideal for quantitative strategy reviews.
Can I add animations to the clock reveals?
Absolutely, the template includes built-in animation options for sequential position unveils, enhancing narrative flow in live presentations.
How does this aid in risk assessment?
By mapping positions, you spot vulnerabilities like over-reliance on low-price strategies, drawing from real consulting practices to mitigate market threats.
What's the license policy after purchase?
One-time payment grants lifetime use across multiple projects, with no restrictions on edits or distributions within your organization.