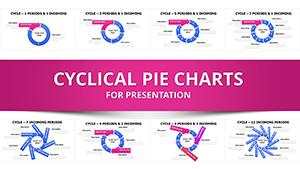
Cycle Periods Incoming PowerPoint Charts Template - 44 Slides

From my experience crafting decks for government agencies and tech enterprises, nothing derails a presentation faster than convoluted explanations of timed sequences with external influences. This cycle periods PowerPoint template, with its 44 streamlined slides, addresses that head-on by combining clean cycle divisions, labeled inflows, and pie hybrids to make interconnected timelines crystal clear.
You'll gain the ability to present compact summaries that connect periods to inputs, reducing preparation time and elevating audience retention in fast-paced environments. It's a practical asset for anyone dealing with sequential data in real client-facing scenarios.
I've relied on similar structures weekly to simplify complex briefings, turning potential confusion into confident discussions.
In-Depth Look at Template Components
The 44 slides are grouped for efficient navigation, emphasizing inflows and periods.
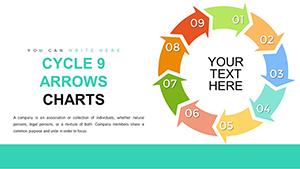
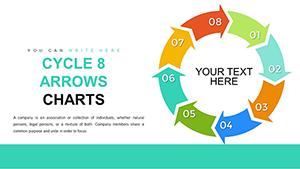
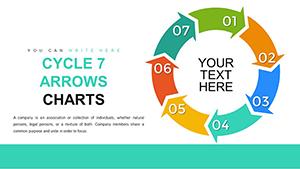
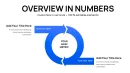
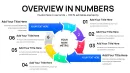
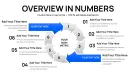
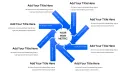
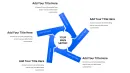
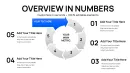
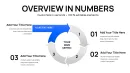
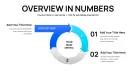
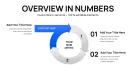
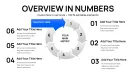
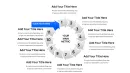
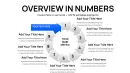
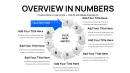
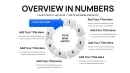
Fundamental Period Infographics (Opening Slides)
These initial slides provide core setups with adjustable divisions for timing visuals. For example, a slide might show segmented cycles for phase labeling, where you can resize segments to fit specific durations like project milestones.
Accents are editable to spotlight critical junctures, ensuring your focus on sequence flow is maintained.
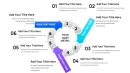
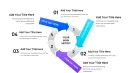
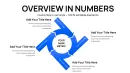
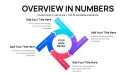
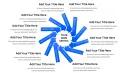
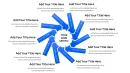
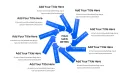
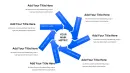
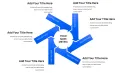
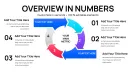
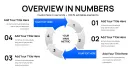
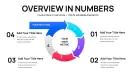
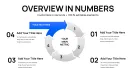
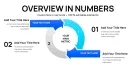
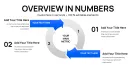
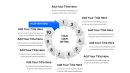
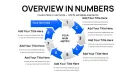
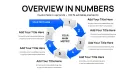
Inflow Arrow Designs (Central Slides)
Centered on arrow variations for input clarity, these allow style changes to distinguish sources. A typical slide features labeled arrows merging into periods, ideal for depicting data streams - modify directions or dashes for nuanced representations.
Standard animations can be applied to unfold elements during delivery.
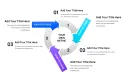
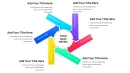
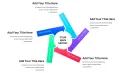
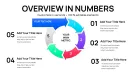
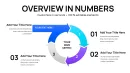
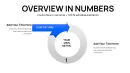
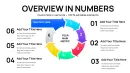
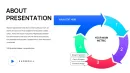
Pie-Integrated Hybrids (Closing Slides)
Final slides fuse pies for proportional emphasis within sequences. One configuration might embed a pie in a period for contribution breakdowns, with arrows for targeted highlights - direct data entry simplifies updates.
All are designed for rapid adaptation to your content needs.
How Experts Deploy This Template in Practice
In analysis presentations, it excels at linking inflows to periods for data connections, like supply chain updates. Teaching sessions utilize sequential infographics to break down concepts step-by-step.
Briefings for stakeholders benefit from compact summaries that tie dynamics together without overload.
Consulting firms apply it in workflow reviews, clarifying input impacts on timelines.
Fitting the Template into Daily Workflows
Incorporate it by importing data and editing directly in PowerPoint or Google Slides - broad compatibility ensures smooth transitions.
Edits use familiar tools, speeding up from concept to final polish. Permanent license supports ongoing use across multiple initiatives.
Efficiency gains come from pre-built structures, freeing time for strategy over setup.
Actual Deployment Examples in Presentations
- Consultants: Client summaries use pie arrows to pinpoint contributions in process overviews.
- Managers: Project briefings highlight inflow connections to timelines.
- Educators: Workshops feature infographic cycles for idea progression.
- Founders: Partner talks map dynamic sequences with inputs.
- Analysts: Reports integrate hybrids for layered insights.
Comparing This Template to Other Approaches
| Feature | This Template | Default Software Tools | Custom Builds | Competing Options |
|---|---|---|---|---|
| Focus on Inflows | Streamlined and labeled | Basic arrows | Laborious detailing | Broad but unfocused |
| Adaptation Ease | Quick direct edits | Restrictive | High effort | Variable quality |
| Visual Compactness | Concise hybrids | Sparse designs | Potentially cluttered | Inconsistent |
| Software Fit | Wide compatibility | Limited | Build-dependent | Often restricted |
Tailored Applications by Sector
Education employs it for concept cycles in lessons. Analysis fields use for inflow examinations in reports.
Finance tracks period-based investments with dynamics. Tech documents launch sequences.
Healthcare visualizes study timelines, marketing campaign phases.
Access this template now to streamline your next sequential presentation.
Frequently Asked Questions
How can I modify cycle divisions in this template?
Select and resize segments directly, repositioning for custom timing fits, like adjusting for uneven project stages.
What animation features does it support?
Apply standard effects to elements for dynamic reveals, enhancing flow during talks.
How to integrate data into pie sections?
Enter values manually or link charts, updating proportions effortlessly for accurate depictions.
Is it compatible with Keynote?
Yes, import the file and edit as needed, preserving all inflow and period structures.
Can I vary arrow styles for different inputs?
Absolutely, change dashes or colors to differentiate, adding clarity to varied dynamics.