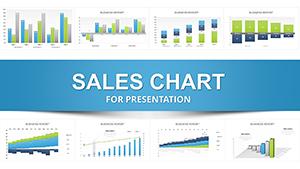
Sales Infographic PowerPoint Charts - Editable Slides


Sales professionals know that executives skim through dense spreadsheets during reviews, missing critical opportunities hidden in the data. This dedicated sales infographic PowerPoint charts template addresses that challenge head-on by providing polished, narrative-driven visuals that highlight pipeline strength and growth trajectories at a glance.
Drawing from years building decks for enterprise sales organizations, I rely on these exact styles of integrated charts to keep discussions focused on strategy rather than clarification questions. The editable collection delivers ready-to-use slides that transform standard reports into memorable presentations.
Teams choose it for the balance of sophistication and speed, ensuring every revenue discussion ends with alignment and momentum.
Key Visual Components That Drive Sales Narratives
The slides follow proven sales storytelling structures, allowing seamless data insertion while maintaining visual impact.
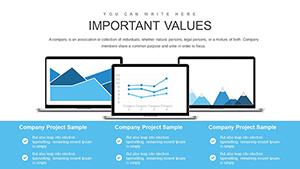
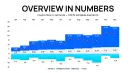
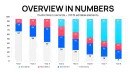
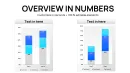
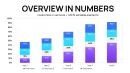
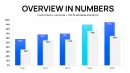
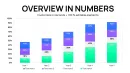
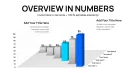
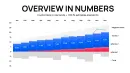
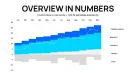
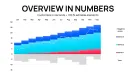
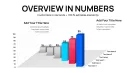
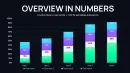
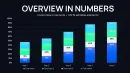
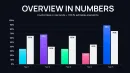
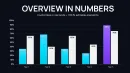
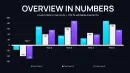
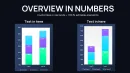
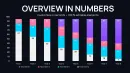
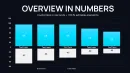
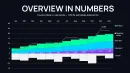
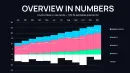
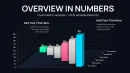
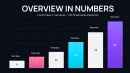
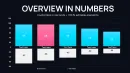
- Executive summary dashboards: Combined metrics displays with embedded pies and progress indicators for immediate overview.
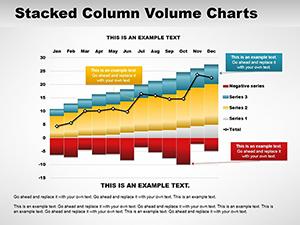
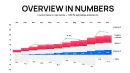
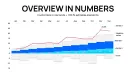
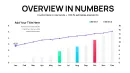
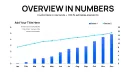
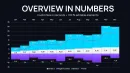
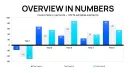
- Performance trend trackers: Smooth line charts with milestone markers to illustrate acceleration patterns.
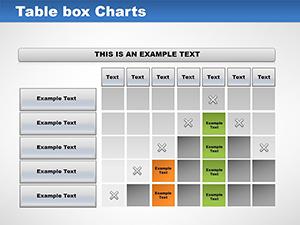
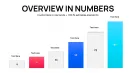
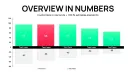
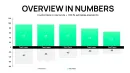
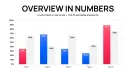
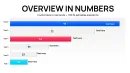
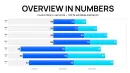
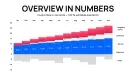
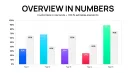
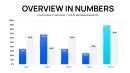
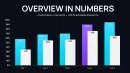
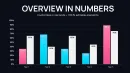
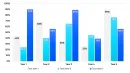
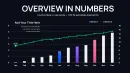
- Segment comparison arrays: Clustered bars for evaluating channels, territories, or product categories.
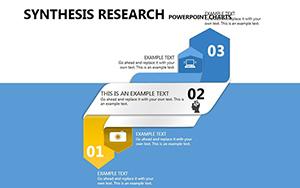
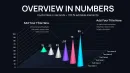
- Conversion funnel visuals: Layered designs showing drop-off rates and monetary values through stages.
- Forecast integration slides: Hybrid charts merging historical data with projected outcomes.
All components include flexible icon sets and palette options for precise brand alignment.
Practical Deployment in Sales Environments
Account executives preparing deal reviews use these infographics to frame opportunity risks and upsell potential clearly. Sales operations teams deploy the comparison layouts during planning cycles to allocate quotas effectively.
Leadership presenting to boards appreciates the clean funnel representations that justify investment requests with visible pipeline maturity.
Effortless Adoption in Daily Presentation Routines
Compatible with PowerPoint 2016 and newer versions, plus easy import to Keynote or Google Slides. Direct Excel linking keeps charts current, while straightforward editing tools handle text and color adjustments rapidly.
The organized slide master ensures consistency across additions, streamlining last-minute updates before critical meetings.
Field-Tested Examples From Revenue Teams
VP-level reviews benefit from dashboard summaries that consolidate multiple data sources into single persuasive views. Territory leads highlight regional differences using clustered comparisons to secure additional resources.
New hire onboarding incorporates funnel breakdowns to teach qualification processes visually. Partner ecosystem managers showcase joint performance metrics to strengthen alliance commitments.
Performance Comparison Across Methods
| Element | This Editable Sales Charts Template | Standard Software Tools | Manual Design Process | Basic Downloads |
|---|---|---|---|---|
| Visual Appeal | Infographic-level polish | Plain defaults | Variable skill-dependent | Limited refinement |
| Data Accuracy Ease | Direct linking supported | Basic entry only | Error-prone alignment | Static images often |
| Sales Context Fit | Pipeline-focused designs | General purpose | Requires deep customization | Rare specialization |
| Preparation Speed | Rapid population | Moderate formatting | Extensive time investment | Inconsistent |
Access these professional sales infographic charts now and deliver presentations that consistently move deals forward.
Tailored Applications Across Sales-Driven Sectors
SaaS companies track churn and expansion using trend overlays to inform retention strategies. Retail chains analyze store performance clusters to optimize merchandising plans.
Professional services firms present engagement pipelines to demonstrate capacity planning accuracy. Distribution networks visualize supplier metrics for partnership evaluations.
Telecom providers compare plan adoption rates to refine offering bundles effectively.
Frequently Asked Questions
How quickly can I update charts with new monthly data?
Linked Excel integration allows refreshes in seconds; manual entry takes just moments per slide thanks to organized layouts.
Do the infographic elements scale for large conference screens?
All vectors and high-resolution icons maintain crisp quality at any projection size or resolution.
Can I remove or add animation sequences easily?
The animation pane provides full control - delete entire sequences or modify individual effects without breaking layouts.
Will this work on older PowerPoint versions?
Optimized for 2016+, with backward-compatible elements that function reliably in earlier editions.
Are master slides included for global changes?
Yes, comprehensive slide masters enable one-click updates to fonts, colors, and logos across the entire deck.
How suitable are these for printed handout materials?
The clean designs translate excellently to PDF exports, maintaining readability in black-and-white if needed.