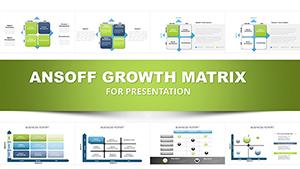
Ansoff Matrix Charts PPT Template for PowerPoint


Type: PowerPoint Charts template
Category: Matrix, Business Models, Tables
Sources Available: .pptx
Product ID: PC01082
Template incl.: 52 editable slides
In high-stakes strategy sessions with C-level executives, I've seen how a clear visual framework can shift the entire conversation from vague ideas to actionable decisions. The Ansoff Matrix provides exactly that structure, helping teams systematically evaluate growth paths without getting lost in endless debate. This dedicated Ansoff Matrix PowerPoint template delivers polished, ready-to-use slides that elevate your strategic discussions, ensuring every quadrant communicates risk and opportunity with precision.
With 52 fully editable slides, this collection goes beyond basic grids to include chart-enhanced variations that layer data directly onto the matrix. Professionals rely on it to present market penetration tactics, product development roadmaps, market expansion plans, and diversification initiatives in a cohesive, visually compelling way. The clean quadrant divisions and integrated visuals make complex strategic choices immediately understandable, saving hours of design time while delivering boardroom-ready impact.
As someone who builds investor pitches and corporate strategy decks weekly, I appreciate how this template accelerates alignment among leadership teams. It turns abstract growth concepts into tangible visuals that drive consensus and commitment.
Exploring the Core Layouts and Variations
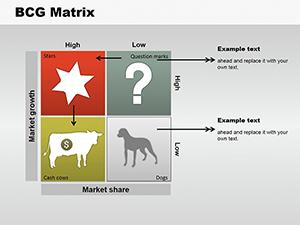
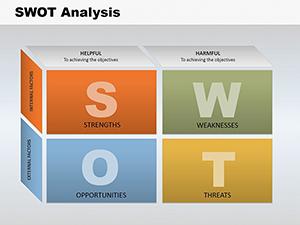
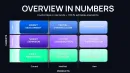
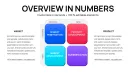
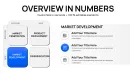
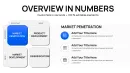
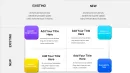
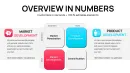
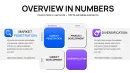
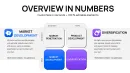
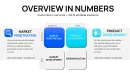
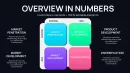
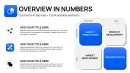
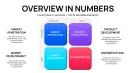
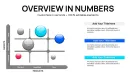
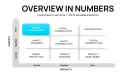
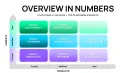
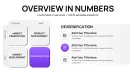
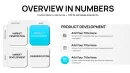
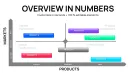
The foundation slides feature the signature 2x2 grid with distinct quadrants for existing and new markets crossed against existing and new products. Each section offers ample space for bullet-point descriptions of specific initiatives, accompanied by subtle icons that reinforce the strategic direction.
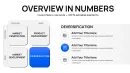
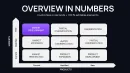
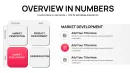
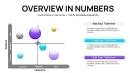
Advanced variations incorporate overlaid charts - such as bar elements showing projected revenue impacts or scatter points indicating risk levels - directly within the quadrants. This integration allows you to plot multiple initiatives simultaneously, highlighting relative priorities at a glance.
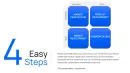
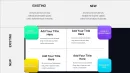
Supporting slides include expanded views of individual quadrants, timeline integrations for phased rollouts, and risk-reward scales that add depth to diversification discussions. All elements remain fully customizable, from color palettes to font styles, ensuring seamless alignment with your corporate branding.
Strategic Applications in Real-World Scenarios
During quarterly board meetings, executives use these Ansoff Matrix slides to frame annual growth targets, weighing safe penetration strategies against bolder diversification moves. The visual clarity helps non-executive directors quickly grasp the balance of risk across options.
In investor pitch decks, founders highlight product development and market expansion quadrants to demonstrate scalable growth potential, backed by data overlays that substantiate projections.
Consultants deploy the template in client workshops to facilitate breakout sessions, where teams populate quadrants in real time before converging on prioritized paths forward.
Enterprise strategy teams integrate it into annual planning cycles, using the chart-enhanced slides to compare initiative portfolios across business units.
Seamless Integration into Your Presentation Workflow
This Ansoff Matrix PowerPoint template fits naturally into established workflows, whether you're starting from a blank deck or enhancing existing materials. Open in PowerPoint 2016 or later, or import directly into Google Slides for collaborative editing.
Customization takes minutes: update text placeholders with your specific strategies, adjust colors to match brand guidelines, and modify chart data series for accurate projections. The one-time download provides lifetime access, allowing reuse across multiple projects without additional costs.
I've found it particularly valuable when deadlines tighten - drop in your content, refine the visuals, and deliver a strategy presentation that looks custom-designed.
Proven Impact Across Presentation Contexts
A tech startup CEO recently used these slides to secure Series B funding by clearly delineating market penetration successes while outlining measured diversification into adjacent categories.
In government agency planning sessions, analysts mapped policy initiatives across quadrants to balance incremental improvements with innovative breakthroughs.
Educators in MBA programs rely on the template for case study discussions, enabling students to populate matrices with real company examples and debate strategic merits.
Corporate trainers incorporate it into leadership development workshops, guiding participants through live exercises that build strategic thinking skills.
Advantages Over Alternative Approaches
| Aspect | This Ansoff Matrix Template | Default PowerPoint Tools | Building from Scratch | Generic Online Options |
|---|---|---|---|---|
| Visual Polish | Professional quadrant designs with integrated chart overlays | Basic shapes requiring manual alignment | Hours of design work needed | Inconsistent styling across slides |
| Slide Variety | 52 specialized strategic layouts | Limited to standard SmartArt | Custom but time-intensive | Few dedicated variations |
| Customization Speed | Rapid edits with preserved formatting | Formatting breaks easily | Full control but slow | Restricted editing capabilities |
| Strategic Depth | Built-in risk and data visualization elements | No inherent strategic framework | Flexible but requires expertise | Surface-level grids only |
Industry-Specific Strategic Mapping
In finance, investment committees use the matrix to evaluate portfolio company growth strategies, balancing low-risk penetration with calculated diversification.
Technology firms map product roadmap decisions, plotting new feature development against entry into emerging markets.
Healthcare organizations assess service line expansions, weighing existing patient base growth against new therapeutic areas.
Marketing teams frame campaign strategies, distinguishing brand penetration tactics from new segment outreach.
Manufacturing leaders evaluate operational improvements versus geographic or product line diversification.
Ready to transform your next strategy session? Download this Ansoff Matrix PowerPoint template instantly and start building presentations that drive decisive growth conversations.
Frequently Asked Questions
How many slides does the Ansoff Matrix template include?
The collection contains 52 fully editable slides, ranging from core grid layouts to advanced chart-integrated variations and supporting strategic visuals. This breadth ensures coverage for everything from quick overviews to detailed initiative breakdowns.
Can I add my own data charts to the quadrants?
Yes - each chart-enhanced slide uses native PowerPoint elements, allowing direct data input and automatic updates. Simply select the chart, edit the data sheet, and watch projections reflect accurately across the matrix.
Is this template suitable for Google Slides?
Absolutely. Upload the .pptx file to Google Slides for full editing capability, including collaborative real-time updates during team strategy workshops.
How do I customize colors for my brand?
Use PowerPoint's theme colors panel to redefine accents globally, or select individual elements for targeted adjustments. The template's structured design preserves professional appearance throughout changes.
What makes this better for executive presentations?
The combination of clean strategic framework with data visualization overlays delivers the clarity executives demand, enabling faster comprehension and more productive discussions around growth trade-offs.