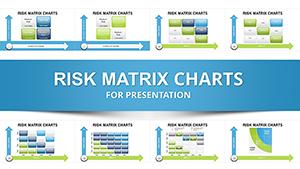
Risk Matrix Charts Template for PowerPoint


Type: PowerPoint Charts template
Category: Matrix, Business Models
Sources Available: .pptx
Product ID: PC01080
Template incl.: 32 editable slides
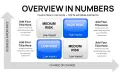
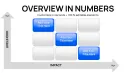
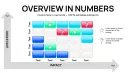
When presenting to senior leaders under tight deadlines, vague risk descriptions often dilute urgency and stall approvals. This dedicated risk matrix PowerPoint template counters that with precise, visually striking infographics that pinpoint threats instantly. Its focused collection of editable charts enables you to map likelihood against consequences, fostering aligned decisions in demanding environments like executive briefings or program evaluations.
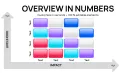
Built on proven assessment structures I rely on for client work, these designs emphasize heat-based coloring and structured grids to elevate standard spreadsheets into compelling narrative tools.
For professionals handling strategic vulnerabilities, this resource provides the refined visuals essential for credible, action-oriented communications.
Key Grid Configurations in This Specialized Set
The slides prioritize practical adaptability, letting you tailor each to your dataset efficiently.
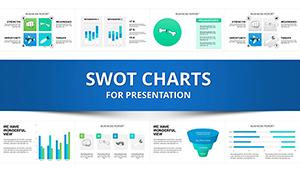
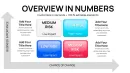
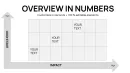
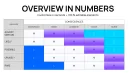
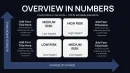
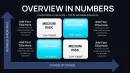
- Compact Overview Grids: Streamlined formats for rapid threat scans in operational check-ins.
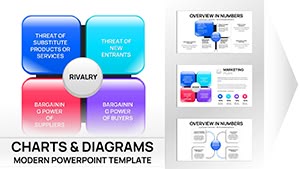
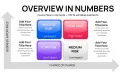
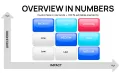
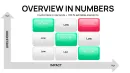
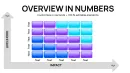
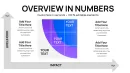
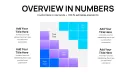
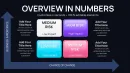
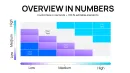
- Detailed Severity Maps: Layered color progressions to differentiate escalating concerns.
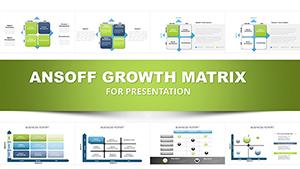
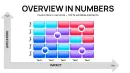
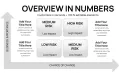
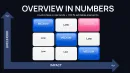
- Dual-Axis Plotting Layouts: Customizable for specific metrics like delay probabilities versus cost overruns.
- Symbol-Enhanced Designs: Integrated markers for common hazard categories.
Every component supports quick modifications to reflect your exact requirements.
Applying These Matrices in High-Pressure Briefings
A chief risk officer can deploy detailed maps to outline emerging compliance issues during audit preparations.
Startup teams highlight funding contingencies against growth projections in pitch sessions.
Department heads visualize staffing gaps impacting deliverables in resource planning forums.
Fitting Into Standard Deck Preparation Routines
Insert your identified items directly onto the grids, adjust shading thresholds, and incorporate notes for context. Fully compatible with current PowerPoint versions and adaptable to collaborative platforms.
Targeted Applications I've Seen Succeed
IT leaders mapping vulnerability patches in security reviews.
Manufacturing supervisors assessing supply interruptions.
Non-profit directors evaluating program sustainability threats.
Benefits Compared to Standard Methods
| Element | This Focused Template | Built-In Tools | Manual Design |
|---|---|---|---|
| Severity Signaling | Refined gradient shading for immediate prioritization | Flat colors without depth | Uneven manual fills |
| Layout Options | Curated risk-specific configurations | Generic inserts | Custom effort per slide |
| Edit Efficiency | Rapid data placement and styling | Limited flexibility | Prolonged adjustments |
Strengthen your risk narratives with targeted visuals - acquire this template for polished deliveries.
Sector-Specific Implementations
Energy firms charting regulatory changes.
Retail operations identifying inventory disruptions.
Academic programs outlining research funding uncertainties.
Frequently Asked Questions
How easily can I adjust the grid dimensions?
Grids are built with editable shapes, allowing you to resize rows or columns by dragging handles while maintaining alignment.
Are there pre-defined animation sequences?
Elements are grouped for easy application of fade or wipe animations to uncover risks progressively.
Does it work well in Keynote?
Yes, import the .pptx file, and all vector elements transfer cleanly for Mac-based editing.
Can I add my own icons to represent specific risks?
Definitely - insert additional shapes or images and position them within cells as needed.