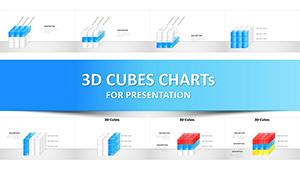
3D Cube Charts PowerPoint Template


Unlock Multi-Dimensional Data Storytelling
Spreadsheet columns and flat bar graphs collapse under the weight of three-variable analysis. When quarterly revenue needs simultaneous breakdown by region, product line, and customer segment, standard charts force you to choose which dimension gets buried in footnotes. This 3D cube chart PowerPoint template solves that limitation directly, providing 41 editable slides designed for volumetric data representation where depth, height, and width each carry distinct analytical meaning.
In my consulting work preparing investor presentations and strategic planning decks, cube visualizations consistently accelerate stakeholder comprehension of interconnected metrics. Unlike 2D matrices that flatten relationships, cubes preserve spatial context—viewers immediately grasp how variables interact across dimensions. The template integrates seamlessly with PowerPoint 2016 through Microsoft 365, plus maintains full formatting when imported into Google Slides for collaborative editing.
Each cube structure in this collection features adjustable face colors, edge definition controls, and perspective depth settings. This isn't decorative 3D for visual novelty—these are analytical tools calibrated for scenarios where dimensional relationships determine strategic decisions. From portfolio analysis to resource allocation modeling, the geometric precision ensures your data's complexity doesn't become your audience's confusion.
Detailed Slide Composition and Structure
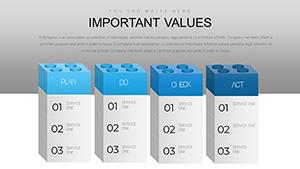
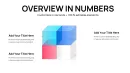
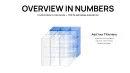
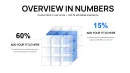
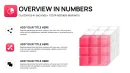
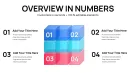
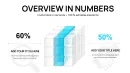
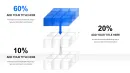
The opening slides present single cubes with six distinct faces, each accommodating text labels, numerical values, or small icons. I've deployed this format extensively for capability assessments where cube faces represent technology, people, process, governance, data, and culture dimensions. Color-coding each face creates instant visual segmentation—critical when board members need to absorb multi-factor evaluations during time-constrained strategy sessions.
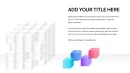
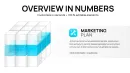
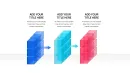
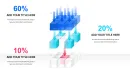
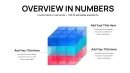
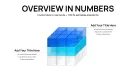
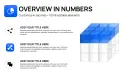
Slides 8-15 introduce cube clusters arranged in grids or pyramids, ideal for comparative analysis across business units or product portfolios. When a SaaS company needed to evaluate 12 feature modules across development complexity, market demand, and competitive differentiation, we mapped each module as a positioned cube where size indicated complexity, vertical placement showed demand, and horizontal axis tracked differentiation. The resulting visual matrix enabled prioritization decisions that typically required three separate meetings.
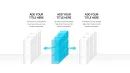
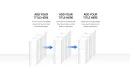
Exploded cube diagrams appear in slides 20-28, where cube components separate to reveal internal relationships. Use these for organizational structure presentations where outer cube faces represent customer-facing functions while inner segments show supporting operations. In merger integration planning, exploded cubes have proven invaluable for illustrating how combining entities' capabilities stack to form unified service offerings.
Rotation and Perspective Controls
Select cube configurations include pre-animated rotations revealing different faces sequentially. During financial reviews, I've used this animation to transition from revenue view (front face) to cost structure (side face) to profitability (top face), maintaining audience focus through guided visual progression rather than overwhelming with simultaneous data display.
Professional Applications Across Business Functions
Finance teams employ cube charts for three-factor portfolio analysis: axes representing asset class, risk profile, and time horizon. Each investment appears as a positioned cube, with size indicating allocation amount. This spatial arrangement surfaces concentration risks that traditional allocation pie charts obscure—when too many cubes cluster in one quadrant, rebalancing needs become immediately apparent.
Supply chain managers visualize inventory positioning across warehouses (x-axis), product categories (y-axis), and stock age (z-axis). Cubes color-coded by turnover velocity help identify slow-moving items in specific locations, driving targeted clearance strategies. One retail client reduced obsolete inventory by 23% within two quarters after implementing cube-based inventory reviews.
Product managers map feature roadmaps as cubes positioned across customer value (height), development effort (depth), and competitive pressure (width). This three-dimensional prioritization framework replaces lengthy spreadsheet scoring models, making trade-off discussions more collaborative and less contentious during planning sessions.
Research and Academic Deployment
University researchers present experimental variables as cube axes: treatment type, dosage level, and duration. Individual study results occupy specific cube positions, enabling meta-analysis visualizations that reveal gaps in existing research coverage. Grant review panels appreciate this spatial data representation, as it clarifies proposed study contributions within the broader research landscape.
Workflow Integration and Technical Setup
Start by mapping your three variables to cube dimensions before opening the template. If analyzing sales performance, decide whether geography, time period, or product category occupies which axis. This pre-planning prevents mid-presentation dimension swapping that confuses audiences.
Import data from Excel by linking text boxes to specific cells, enabling automatic updates when underlying data changes. For monthly reporting cycles, this connection means refreshing numbers requires only a spreadsheet update rather than manual slide editing. Navigate to Insert > Text > Text Box > Link to File to establish these connections.
When customizing cube colors, maintain consistent encoding across all slides—if blue represents high performance in slide 5, blue must mean high performance throughout the deck. I've seen promising analyses undermined by inconsistent color usage that forced audiences to constantly reorient themselves.
Animation Sequencing for Complex Narratives
Build cube arrangements progressively rather than displaying complete configurations immediately. Show base cubes first, then animate additional layers to demonstrate growth or accumulation over time. This sequential reveal supports storytelling cadence, particularly effective when walking investment committees through multi-year expansion scenarios.
Cube Template vs. Alternative Visualization Methods
| Capability | 3D Cube Template | Scatter Plot Matrix | Stacked Bar Charts |
|---|---|---|---|
| Three-Variable Display | Simultaneous spatial representation of x, y, z dimensions | Requires multiple paired plots, fragmenting analysis | Third variable relegated to color coding, reducing clarity |
| Categorical Data | Distinct cube positioning for discrete categories | Limited to continuous variables | Effective for categories but loses dimensional relationships |
| Visual Impact | Volumetric presence commands attention, aids retention | Statistical precision but lower engagement | Familiar format, less memorable for complex scenarios |
| Customization Time | Pre-built structures editable in under 90 seconds | Manual axis configuration for each variable pair | Quick setup but conceptually limiting |
| Audience Accessibility | Intuitive spatial metaphors, minimal statistical training needed | Requires analytical fluency to interpret correctly | Universally understood but oversimplifies relationships |
Industry-Specific Implementation Examples
Pharmaceutical project managers track drug development pipelines as cubes positioned across therapeutic area, clinical phase, and market potential. This visualization consolidates what previously required separate pipeline lists, phase status trackers, and market forecasts into unified strategic views that inform portfolio investment decisions.
Real estate developers assess property opportunities using cubes where dimensions represent location quality, development cost, and projected yield. During acquisition committee meetings, this spatial arrangement facilitates comparative discussions—"the Westside project offers better location but higher cost than the downtown opportunity" becomes visually self-evident.
IT departments map application portfolios across business criticality, technical debt, and user satisfaction dimensions. Legacy systems cluster in high-criticality, high-debt, low-satisfaction zones, visually arguing for modernization investments. Cloud migration priorities emerge naturally from this spatial analysis without contentious scoring debates.
Marketing and Campaign Analysis
Digital marketing teams position campaigns across reach (audience size), engagement (interaction rate), and conversion (sales impact). Cubes sized by budget investment create instant ROI visualization—large cubes in low-conversion zones highlight misallocated spending, while small cubes achieving high conversion suggest scaling opportunities.
Technical Specifications and Platform Compatibility
The template file delivers 41 slides totaling 4.2 MB, structured for rapid loading even on bandwidth-constrained connections during remote presentations. All cubes consist of ungrouped vector shapes, allowing independent face editing without disturbing overall cube geometry. This modular construction prevents the common frustration where adjusting one element distorts the entire graphic.
PowerPoint 2016, 2019, 2021, and Microsoft 365 users experience full feature access including animation sequencing and 3D rotation controls. Mac compatibility extends to PowerPoint for Mac 2019 and later with complete functionality. Google Slides import maintains 90% formatting fidelity—occasional shadow depth adjustments may be needed due to cloud rendering differences, correctable in under three minutes per slide.
For organizations using Keynote, direct import preserves cube structures and animations with minor gradient adjustments. The primary compatibility consideration involves perspective distortion, which Keynote handles slightly differently than PowerPoint. Export from PowerPoint as PDF for pixel-perfect reproduction if presentation software varies across team members.
Advanced Customization Techniques
Create dynamic cubes by linking face text to Excel cells containing formulas—as underlying data updates, cube labels automatically refresh. This live data connection proves invaluable during quarterly business reviews where last-minute results need incorporation without slide rebuilding.
For presentations requiring audience interaction, employ PowerPoint's zoom feature to navigate between overview slides showing all cubes and detailed slides examining specific cube clusters. This navigation structure supports both executive summaries and detailed deep-dives without separate deck versions.
When presenting to colorblind audiences, supplement color coding with pattern fills or text labels. PowerPoint's format menu offers textured fills that maintain visual distinction while ensuring accessibility. This inclusive design consideration prevents excluding approximately 8% of male audience members from fully comprehending your analysis.
Elevate Your Analytical Presentations Immediately
Multi-dimensional data deserves multi-dimensional visualization. Stop compressing three-variable relationships into inadequate 2D formats that obscure strategic insights. Download this template and start building cube analyses that make complexity comprehensible.
Frequently Asked Questions
How do I rotate cubes to show different faces?
Select the cube group, navigate to Shape Format > Rotate, and choose 3D Rotation Options. Adjust X, Y, and Z rotation values to reposition the cube. Save custom rotations by right-clicking the cube and selecting "Save as Picture" for reuse across presentations.
Can cubes display actual data values on each face?
Yes, each cube face contains editable text boxes. Type values directly, or link text boxes to Excel cells for automatic updates. Use font sizes between 10-14 points for optimal readability on standard projection screens.
What's the maximum number of cubes per slide while maintaining clarity?
Limit to 12-15 cubes per slide for presentation contexts. Beyond this threshold, individual cube identification becomes difficult, particularly for remote viewers on smaller screens. For larger datasets, use multiple slides or implement zoom functionality for progressive disclosure.
Are the cube templates compatible with dark-themed presentations?
Fully compatible. Invert cube face colors and lighten edge definitions against dark backgrounds. The template includes pre-configured dark mode variants in slides 35-41, eliminating manual adjustment when adapting to evening presentations or corporate brand guidelines requiring dark themes.
How do I animate cube clusters to build sequentially?
Ungroup the cube cluster, select individual cubes, and apply Entrance animations (Fade or Grow works well). Set animation order via Animation Pane, using "After Previous" triggers with 0.3-second delays between cubes. This sequential build maintains audience focus while preventing overwhelming simultaneous appearance.
Can I use these cubes in client-facing deliverables?
The purchase license covers unlimited use in internal presentations and client deliverables. Embed cube slides in proposals, reports, and presentations shared with external stakeholders without additional licensing requirements or usage restrictions.