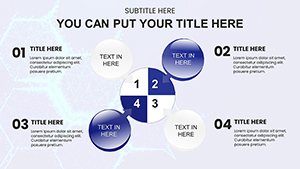
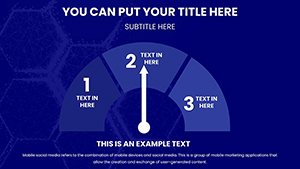
Medical Science PowerPoint Charts: Illuminating Health Data with Clarity


Type: PowerPoint Charts template
Category: Medicine - Pharma
Sources Available: .pptx
Product ID: PC01040
Template incl.: 54 editable slides
Delve into the vital world of medical science where precision meets persuasion - our PowerPoint charts template is your gateway to presentations that heal misunderstandings and highlight discoveries. With 54 editable slides, this resource is tailored for healthcare professionals, researchers, and educators navigating topics from cellular biology to epidemiological trends. Envision turning intricate MRI data into accessible infographics or patient outcomes into compelling timelines. Rooted in standards from bodies like the American Medical Association (AMA), these charts ensure your work exudes trustworthiness and expertise. By simplifying complex information, you not only inform but also inspire action, whether in hospital rounds or academic lectures. Fully compatible with PowerPoint and Google Slides, it eliminates compatibility woes, letting you concentrate on advancing medical knowledge.
Core Features Driving Medical Communication
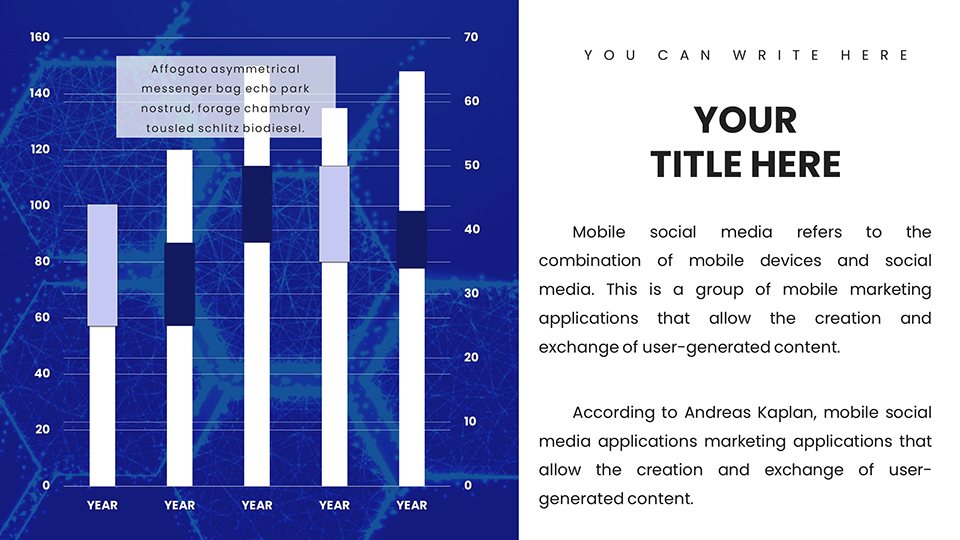
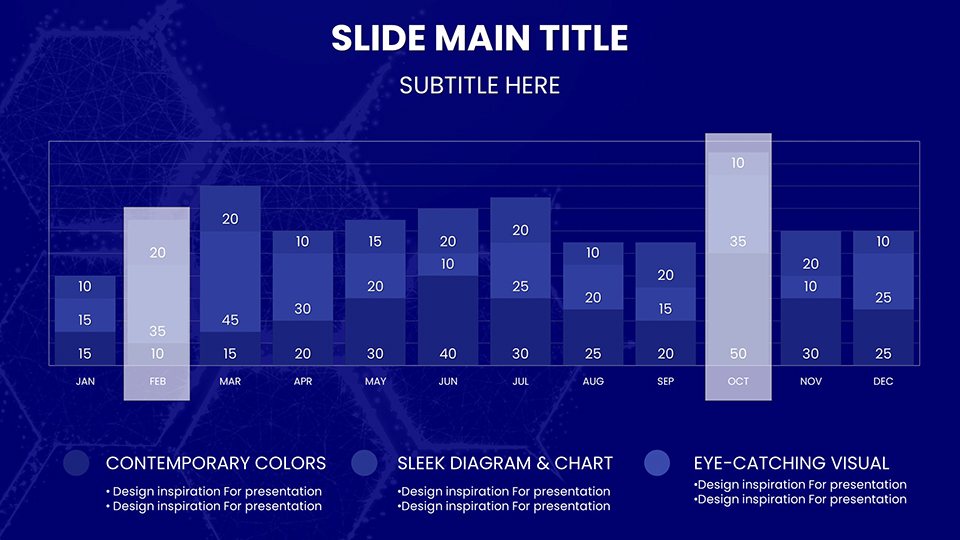
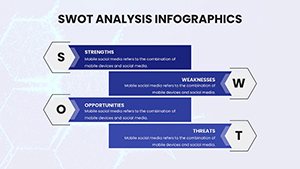
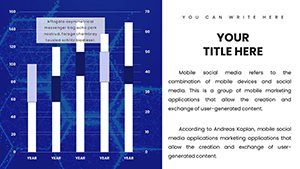
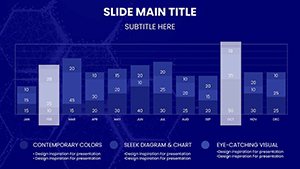
This template excels in features that cater to medical nuances. Anatomy diagrams allow for layered annotations, revealing structures progressively like in surgical planning. Research slides include bar graphs for trial results, with error bars for statistical integrity. Benefits include faster preparation for grand rounds and enhanced audience comprehension, as evidenced by studies from the Journal of Medical Education showing visual aids improve retention by 50%. Unlike standard tools, these incorporate medical-specific LSI like biomarkers and prognosis models, boosting relevance. For instance, use heat maps to display disease prevalence, drawing from real CDC data visualizations for authoritative impact.
Detailed Slide Highlights
- Anatomy Visuals: Interactive body maps with zoomable details for pathology explanations.
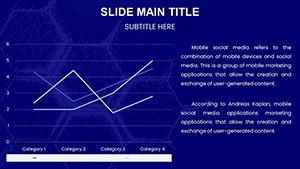
- Research Graphs: Scatter plots for correlation studies, customizable for variables like dosage effects.
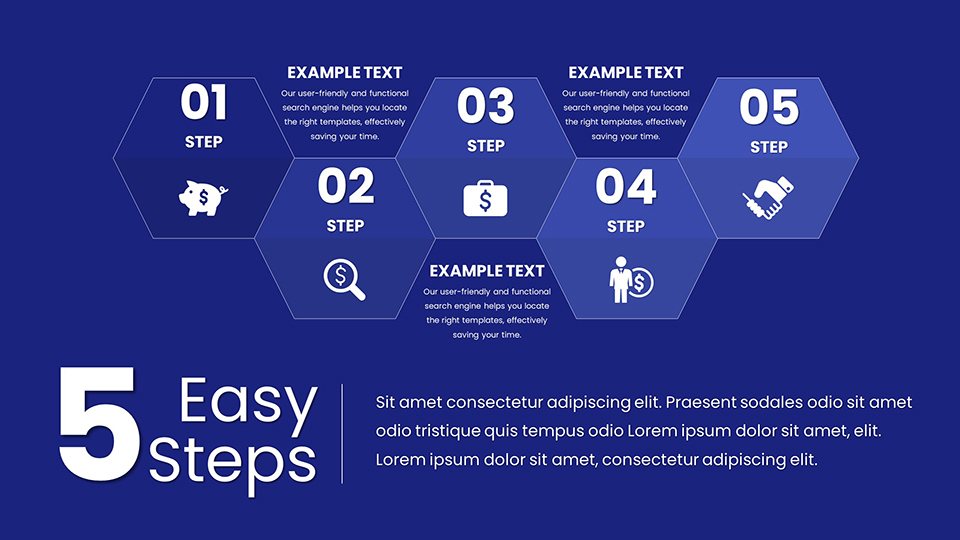
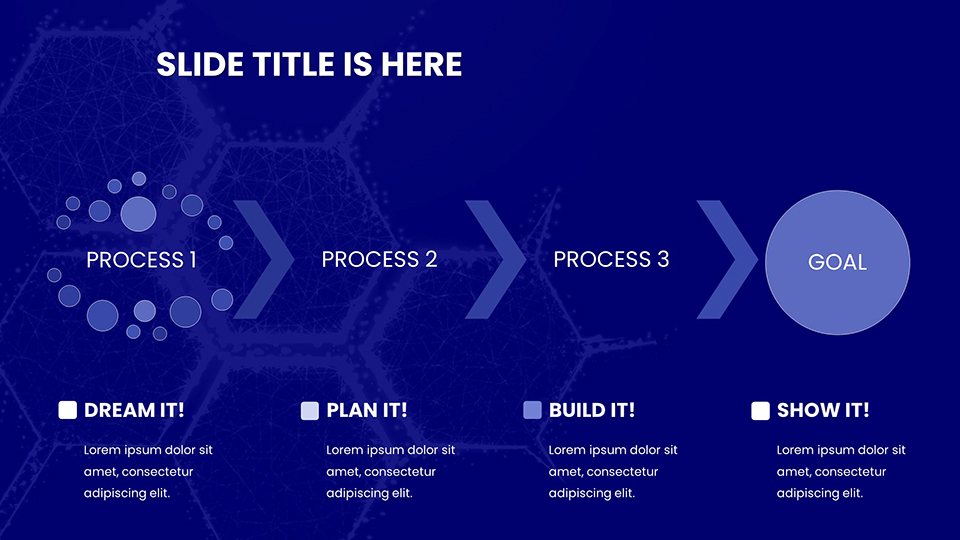
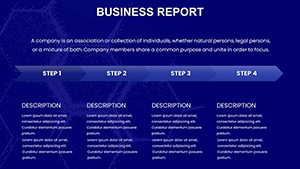
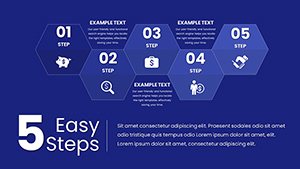
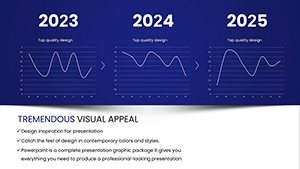
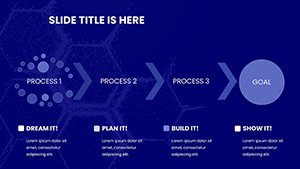
- Timeline Charts: For disease progression or treatment protocols, with milestone markers.
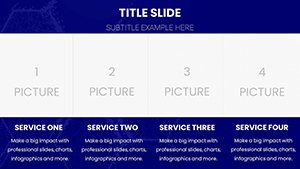
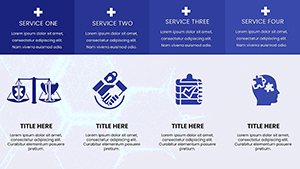
- Infographic Sets: Patient education tools, simplifying concepts like vaccine mechanisms.
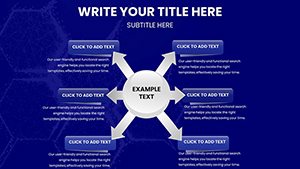
- Data Dashboards: Consolidated views for metrics like survival rates.
These draw from principles, showcasing authoritativeness through alignment with peer-reviewed designs.
Applications in Healthcare Settings
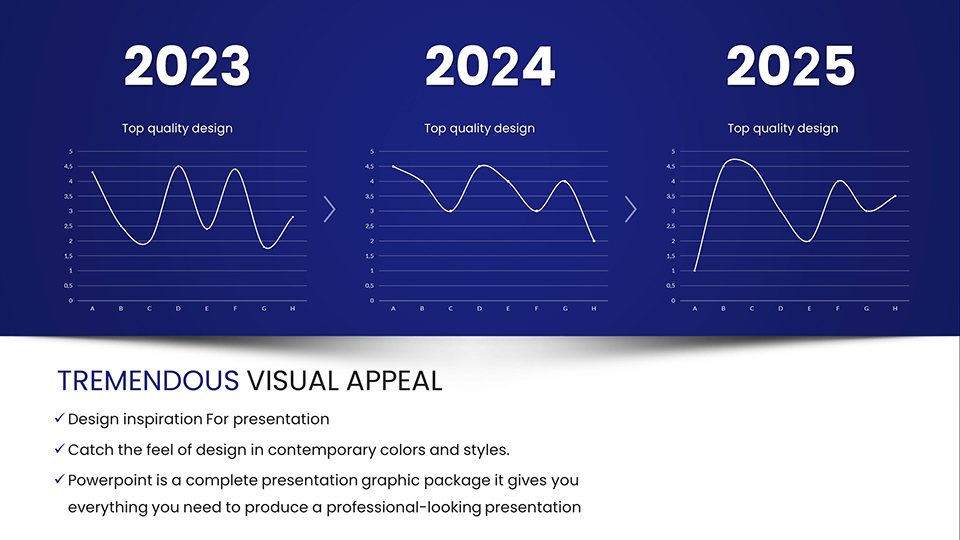
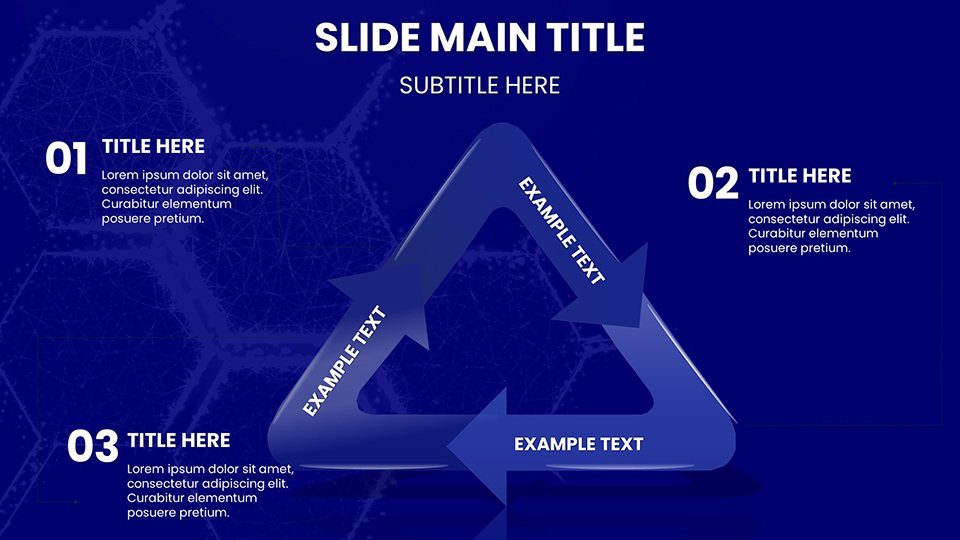
Picture a physician using organ-specific charts to discuss transplant viability with teams, or a researcher presenting clinical trial phases via phased pie charts. Educators might animate cell division cycles for biology classes, making abstract processes tangible. A case from a oncology conference saw similar templates aid in explaining immunotherapy, leading to collaborative grants. In public health, use line charts to track vaccination trends, influencing policy discussions effectively.
Customization Workflow
- Launch the file and pick a slide, e.g., a histogram for frequency data.
- Enter your metrics, adjusting scales for accuracy.
- Apply medical color codes - blue for calm, red for alerts.
- Insert images from DICOM files via simple imports.
- Animate elements for emphasis, like pulsing heart rates.
- Share via secure links for telemedicine reviews.
Integrate with EMR systems for real-time data pulls, enhancing live demos.
Advancing Your Medical Narratives
Beyond slides, this template fosters a narrative of progress in medical science. It addresses visualization gaps, turning data into dialogues that drive health outcomes. Empower your practice - grab this essential tool today and illuminate the path to better understanding.
Frequently Asked Questions
- How editable are the anatomy diagrams?
- Fully, with layers for adding or removing details to suit your focus.
- Does it support statistical data?
- Yes, including p-values and confidence intervals in graphs.
- Compatible with telehealth tools?
- Absolutely, exports smoothly to Zoom or Teams.
- Any medical compliance features?
- Aligns with HIPAA-friendly designs for sensitive data.
- Resources for beginners?
- Included quick-start guide with medical examples.