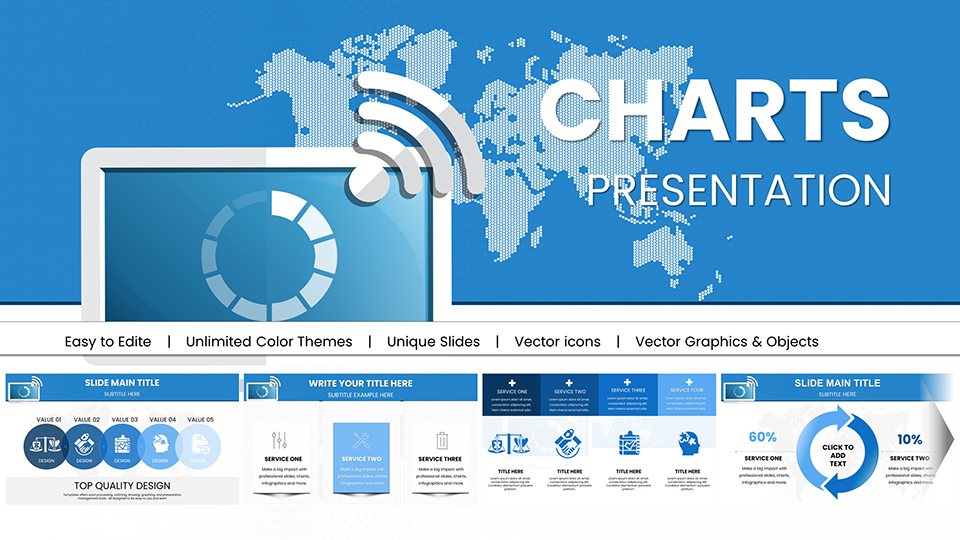
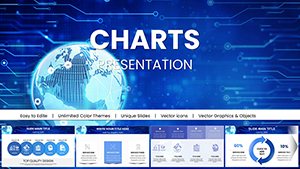
Worldwide Internet Network PowerPoint Charts for Data Mastery


Type: PowerPoint Charts template
Category: Relationship, Illustrations
Sources Available: .pptx
Product ID: PC01030
Template incl.: 59 editable slides
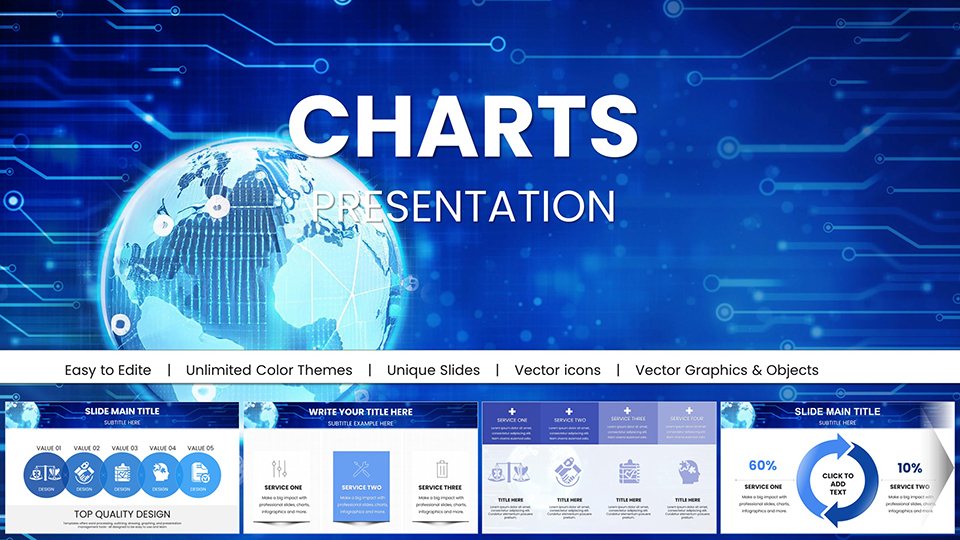
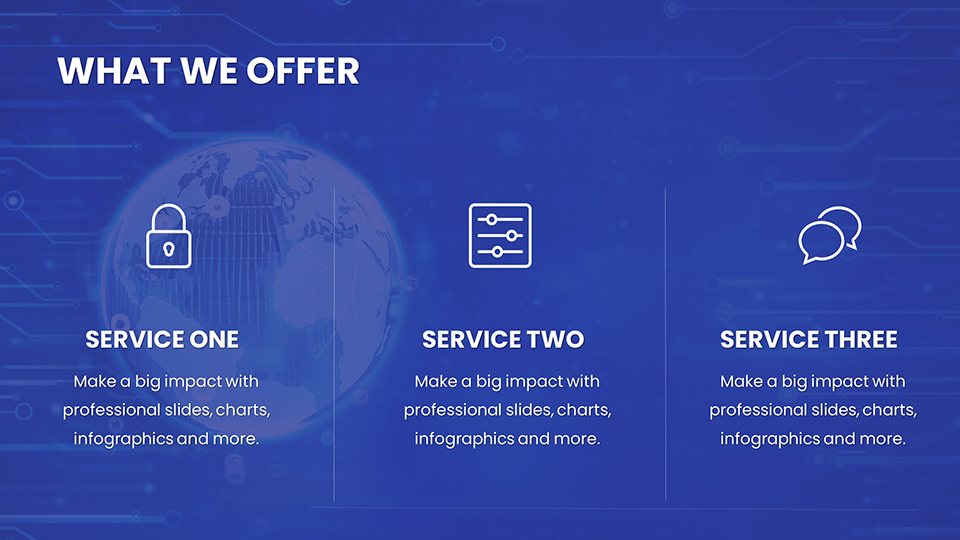
In today's hyper-connected world, understanding global internet dynamics is crucial for innovators and analysts alike. Our Worldwide Internet Network PowerPoint Charts template unlocks that potential with 59 editable slides, transforming raw data on connectivity and speeds into insightful visuals. Whether you're a tech executive mapping digital infrastructure or a researcher presenting penetration trends, this animated PPTX tool delivers clarity and impact, drawing from standards like those from the Internet Society.
Forget wrestling with disparate data sources; this template streamlines visualization, animating network expansions to showcase growth stories like the rollout of 5G across continents. It's designed to inspire confidence in your digital narratives.
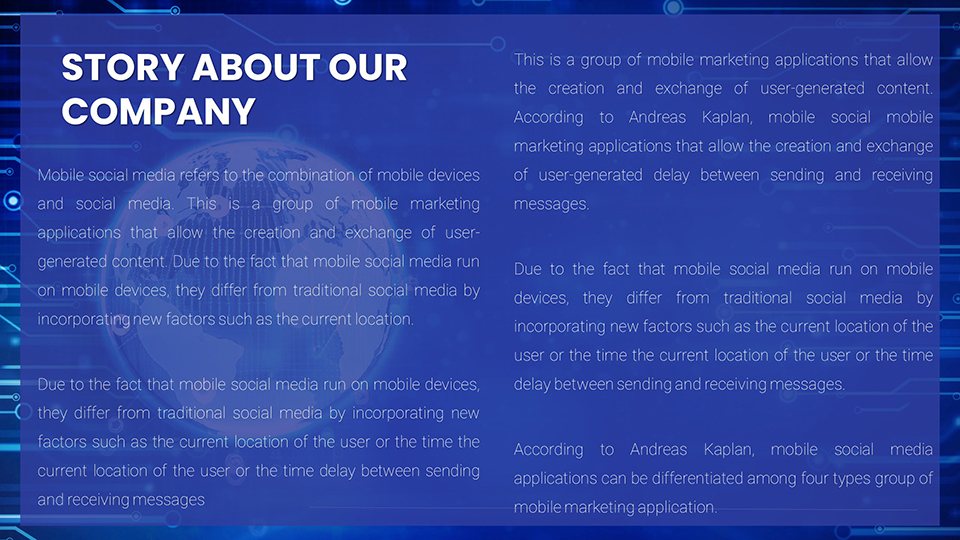
Mapping the Digital Globe Visually
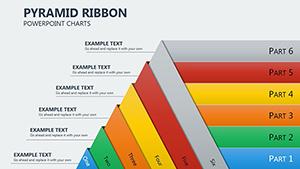
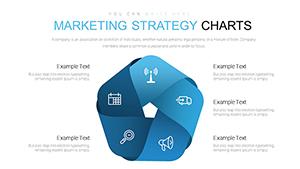
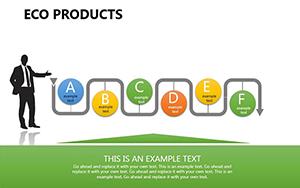
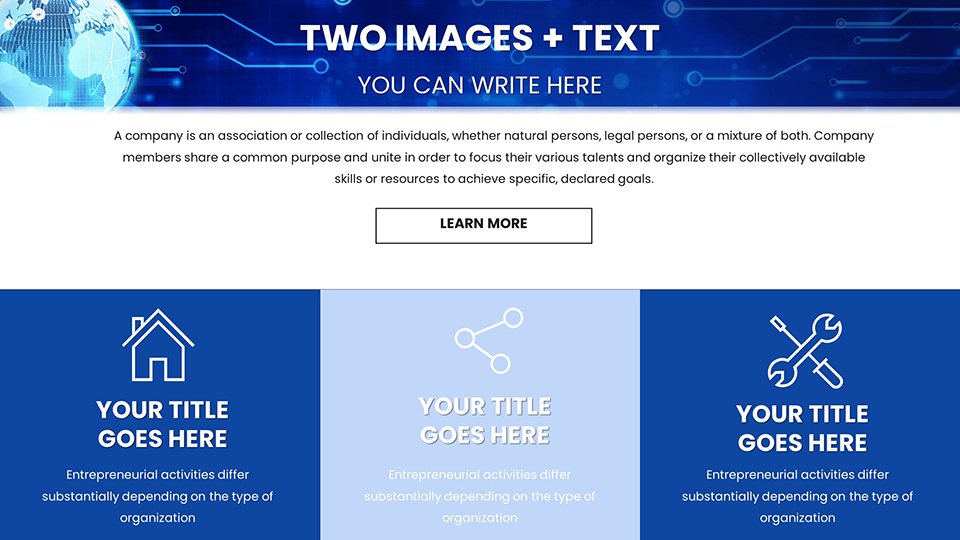
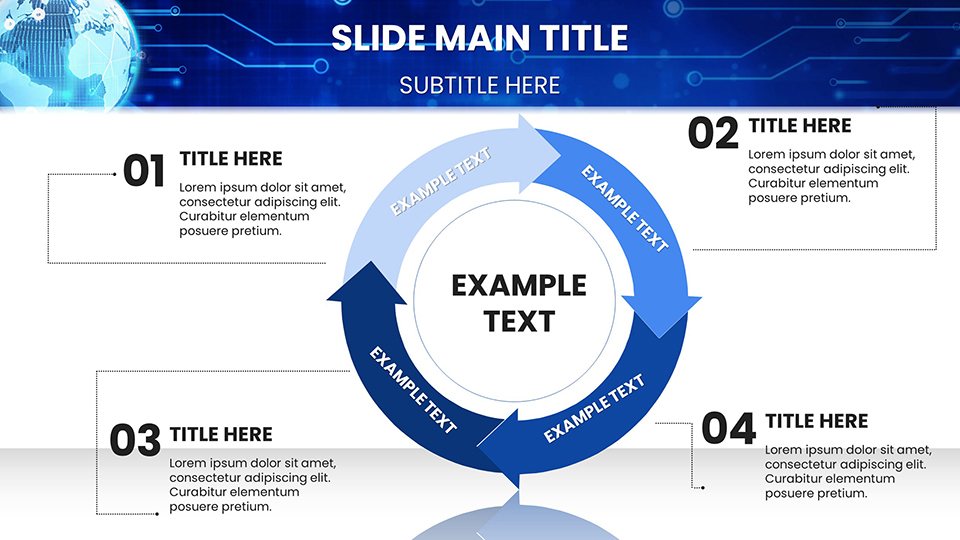
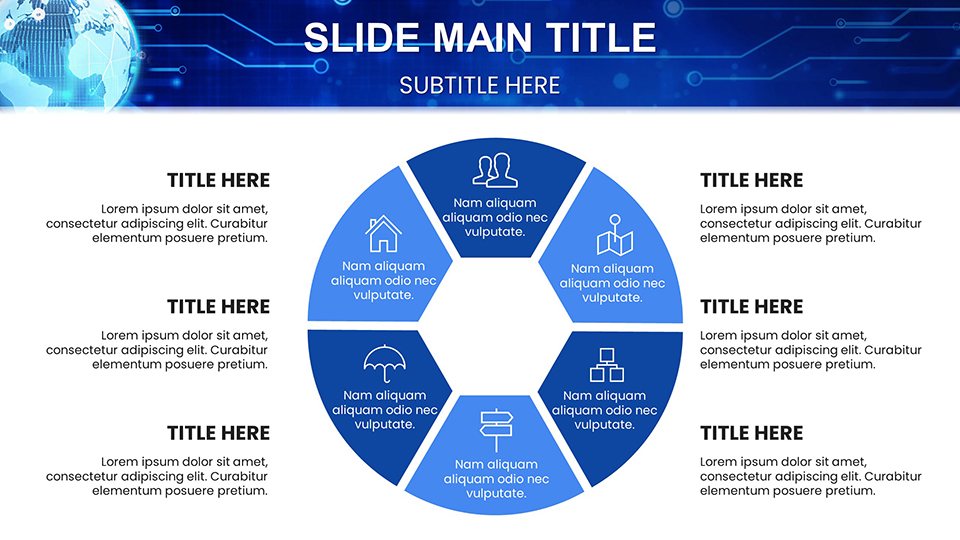
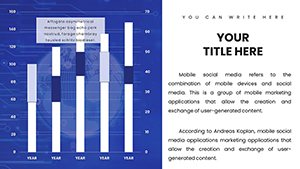
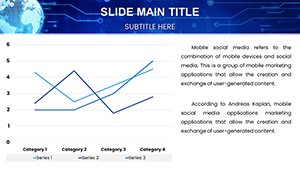
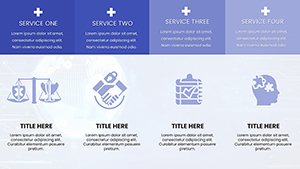
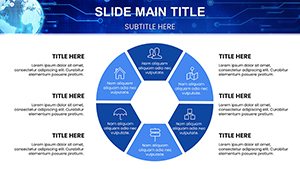
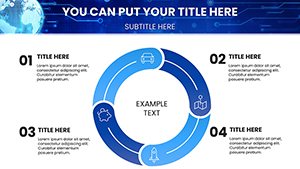
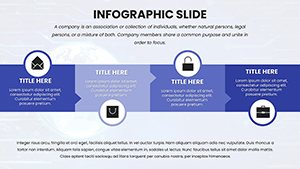
Core to this template is its array of charts tailored for network data: World maps highlighting connectivity hotspots, line graphs tracking bandwidth evolutions, and sankey diagrams illustrating data flows. Customize with vibrant gradients to represent speed tiers or embed logos for branded reports.
Imagine pitching to investors on emerging markets: Animate a choropleth map to reveal internet adoption rates in Asia-Pacific, underscoring opportunities in underserved regions. This not only informs but drives strategic decisions.
Essential Features for Network Insights
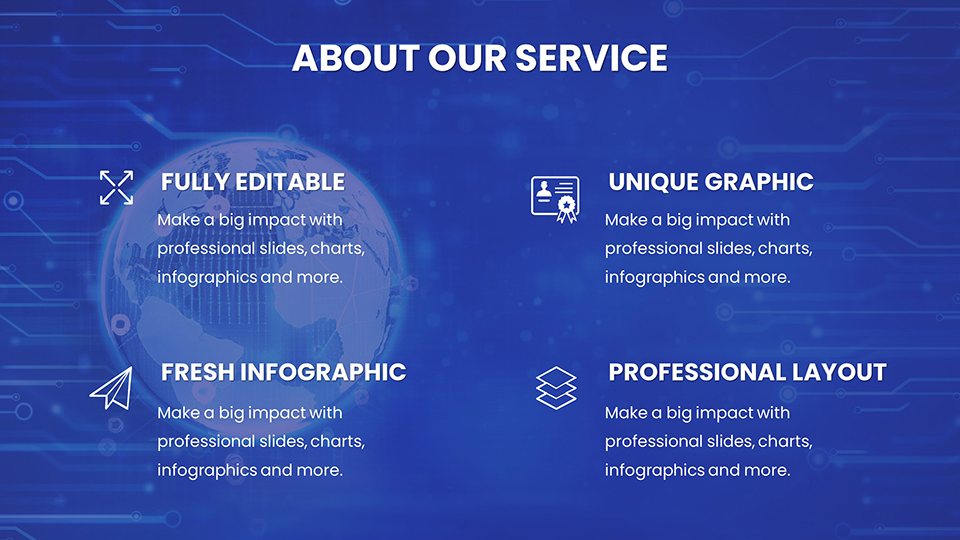
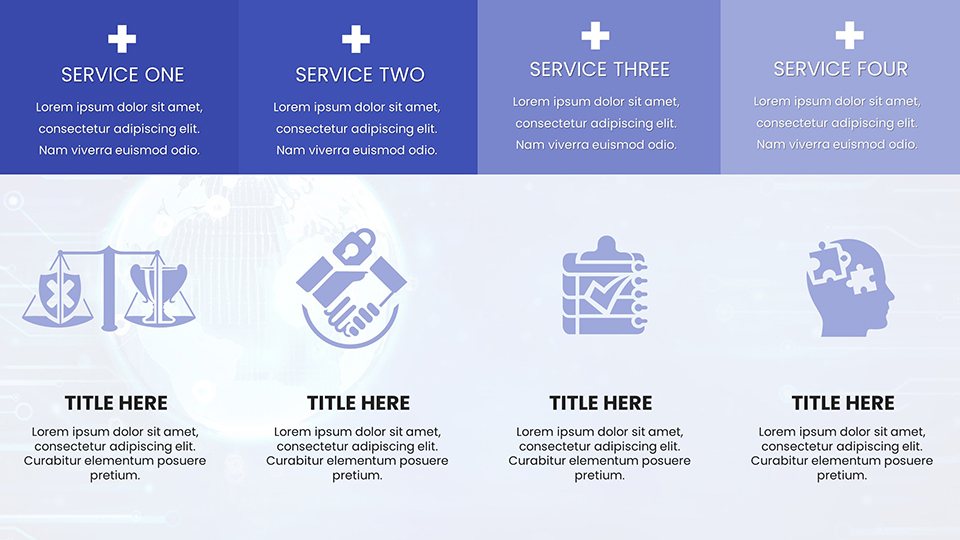
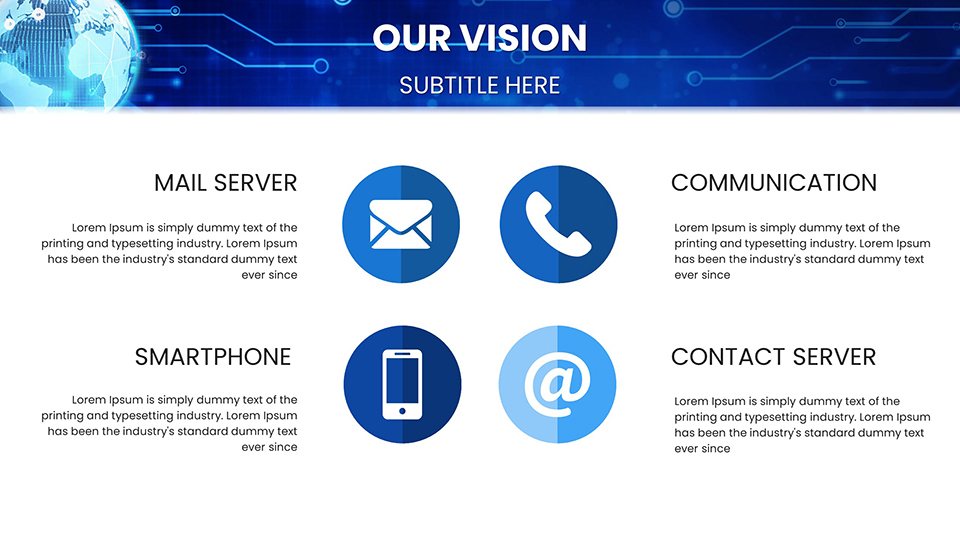
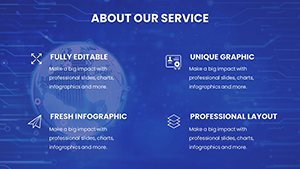
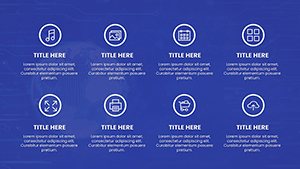
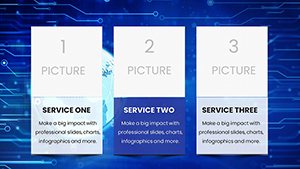
- Global Visuals: Interactive maps and diagrams for worldwide perspectives.
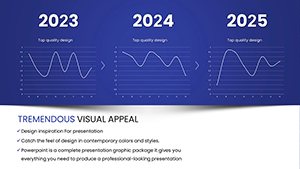
- Data-Driven Animations: Reveal trends over time with smooth reveals.
- Customization Depth: Alter shapes, colors, and texts effortlessly.
- Compatibility: Works in PowerPoint and Google Slides.
- Integration: Pull data from APIs or Excel for live updates.
Users benefit from accelerated report creation, with tech firms noting enhanced stakeholder buy-in through compelling visuals.
Applications in Tech and Beyond
From cybersecurity briefings to educational lectures, versatility shines. Use network graphs to depict cyber threat vectors globally, animating attack paths for emphasis. In academia, chart the digital divide with bar comparisons, referencing UN reports for authority.
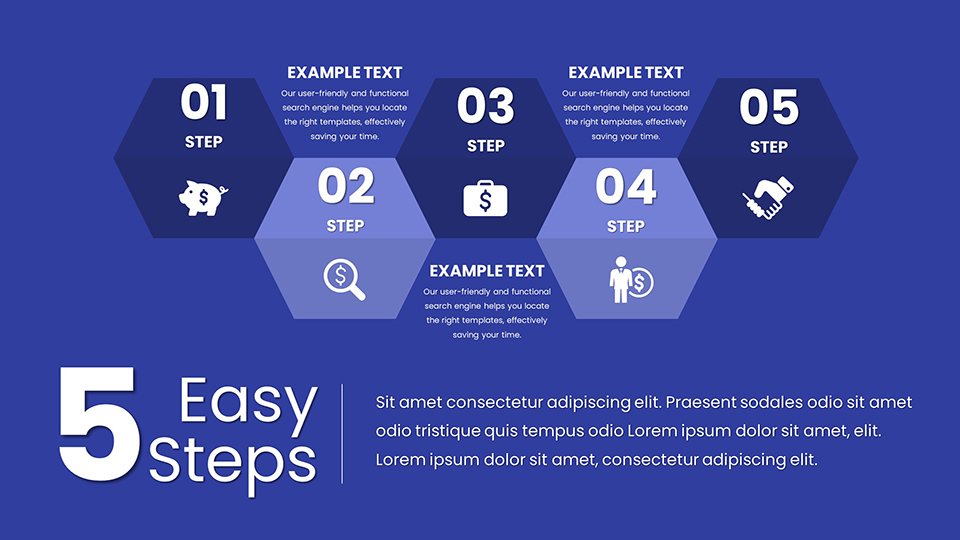
For IT planning, model infrastructure with flow charts, projecting future bandwidth needs based on trends like IoT proliferation.
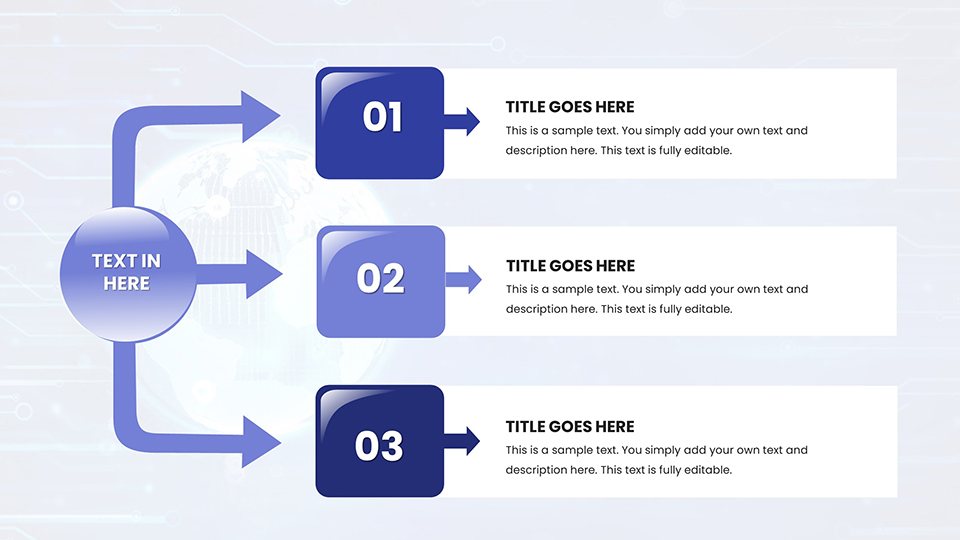
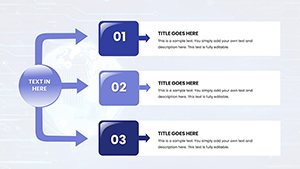
Streamlined Creation Process
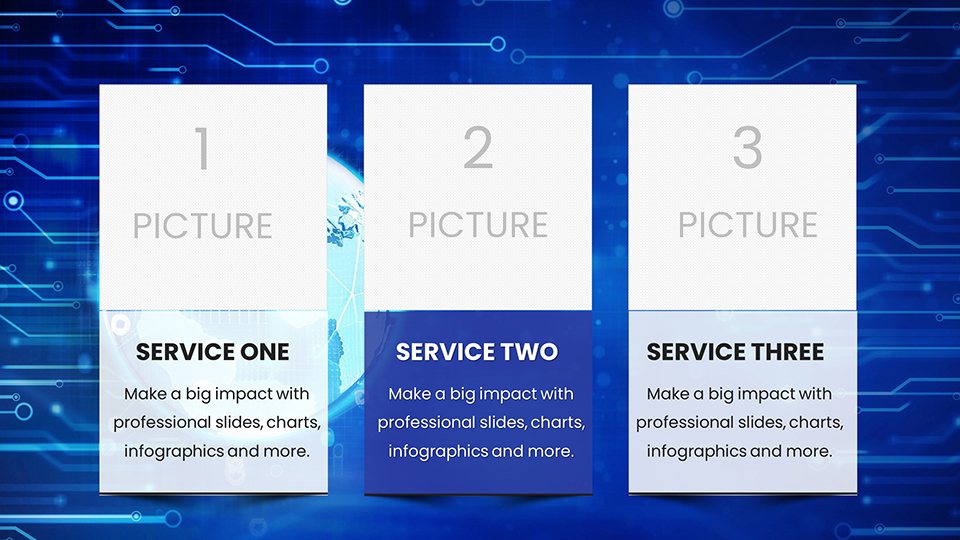
- Download PPTX and initiate.
- Select a global-themed slide.
- Input network metrics.
- Apply animations for dynamism.
- Refine for audience fit.
- Share your connected vision.
Pair with collaboration suites for real-time team inputs.
Tips for Digital Presentation Prowess
Expert advice: Use high-contrast for data legibility, layering info to build complexity. Draw from cases like Google's Project Loon, where visuals aided in securing partnerships.
Superior to basics, with network-specific tools for precise storytelling.
Connect Your Ideas Globally
Harness the power of 59 slides to navigate the internet's vast landscape. This template is your gateway to informed, influential presentations.
Dive into digital depths - download and network your way to success.
Frequently Asked Questions
How global are the map options?
Includes detailed world and regional maps for precise localization.
Supports real-time data?
Yes, via Excel links for dynamic updates.
Ideal for non-tech users?
User-friendly interface suits all levels.
Format details?
.pptx, optimized for efficiency.
Animation customization?
Extensive, from speed to sequence.
Vs. free alternatives?
More robust features and professional polish.